Free Statistics
of Irreproducible Research!
Description of Statistical Computation | |||||||||||||||||||||||||||||||||
|---|---|---|---|---|---|---|---|---|---|---|---|---|---|---|---|---|---|---|---|---|---|---|---|---|---|---|---|---|---|---|---|---|---|
| Author's title | |||||||||||||||||||||||||||||||||
| Author | *Unverified author* | ||||||||||||||||||||||||||||||||
| R Software Module | rwasp_density.wasp | ||||||||||||||||||||||||||||||||
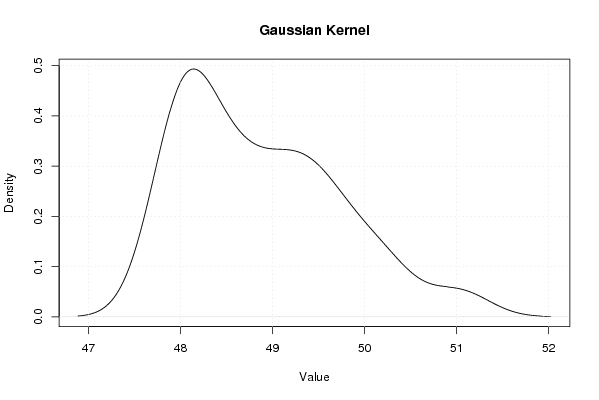
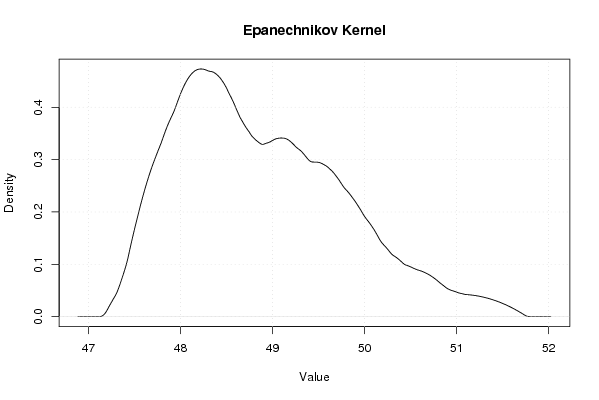
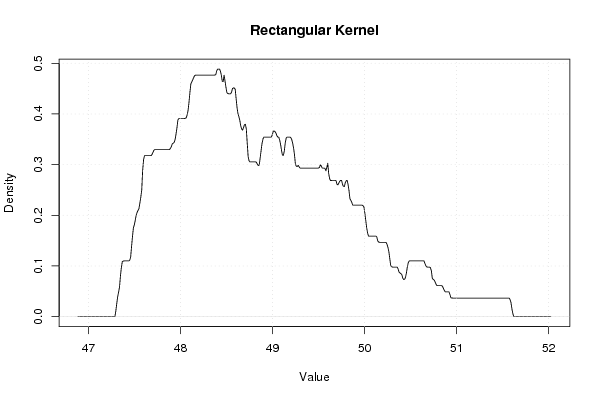
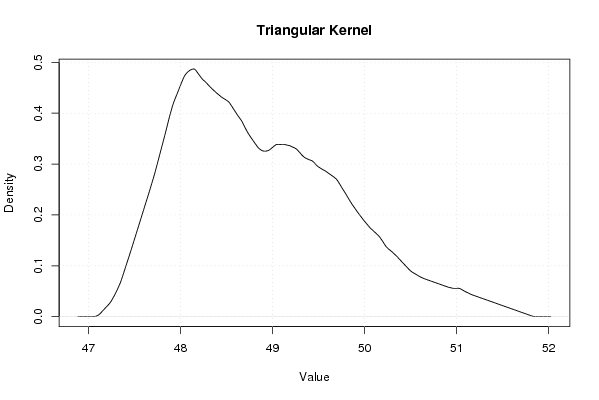
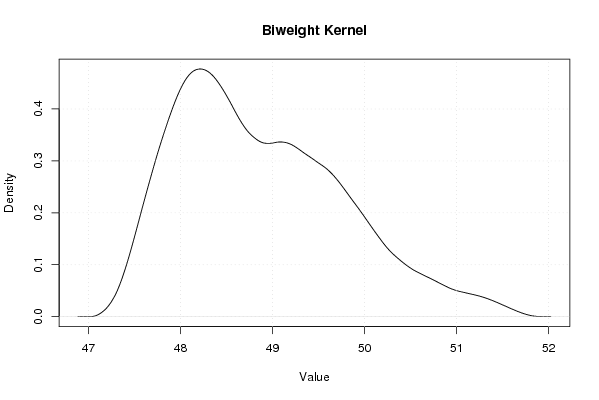
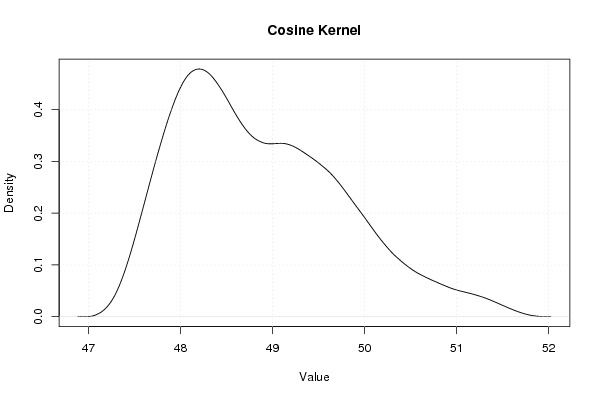
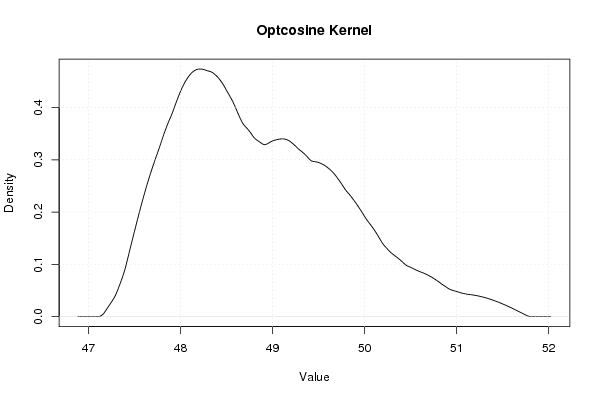
| Title produced by software | Kernel Density Estimation | ||||||||||||||||||||||||||||||||
| Date of computation | Thu, 28 Feb 2008 11:14:30 -0700 | ||||||||||||||||||||||||||||||||
| Cite this page as follows | Statistical Computations at FreeStatistics.org, Office for Research Development and Education, URL https://freestatistics.org/blog/index.php?v=date/2008/Feb/28/t1204222565z7tvd5agdsxyrdg.htm/, Retrieved Tue, 14 May 2024 22:29:11 +0000 | ||||||||||||||||||||||||||||||||
| Statistical Computations at FreeStatistics.org, Office for Research Development and Education, URL https://freestatistics.org/blog/index.php?pk=9272, Retrieved Tue, 14 May 2024 22:29:11 +0000 | |||||||||||||||||||||||||||||||||
| QR Codes: | |||||||||||||||||||||||||||||||||
|
| |||||||||||||||||||||||||||||||||
| Original text written by user: | |||||||||||||||||||||||||||||||||
| IsPrivate? | No (this computation is public) | ||||||||||||||||||||||||||||||||
| User-defined keywords | |||||||||||||||||||||||||||||||||
| Estimated Impact | 235 | ||||||||||||||||||||||||||||||||
Tree of Dependent Computations | |||||||||||||||||||||||||||||||||
| Family? (F = Feedback message, R = changed R code, M = changed R Module, P = changed Parameters, D = changed Data) | |||||||||||||||||||||||||||||||||
| - [Kernel Density Estimation] [Dichtheidsgrafiek...] [2008-02-28 18:14:30] [bd1a672bbeeae91e7f15e9efb6f60992] [Current] | |||||||||||||||||||||||||||||||||
| Feedback Forum | |||||||||||||||||||||||||||||||||
Post a new message | |||||||||||||||||||||||||||||||||
Dataset | |||||||||||||||||||||||||||||||||
| Dataseries X: | |||||||||||||||||||||||||||||||||
47,87 47,87 47,89 47,88 47,91 47,92 47,92 47,91 47,93 48,05 48,03 48,04 48,04 48,06 48,04 48,09 48,12 48,16 48,16 48,16 48,08 48,13 48,16 48,15 48,15 48,15 48,27 48,47 48,51 48,53 48,53 48,53 48,68 48,64 48,67 48,66 48,66 48,67 48,71 48,96 49,01 49,04 49,04 49,04 49,06 49,13 49,19 49,26 49,26 49,26 49,29 49,43 49,43 49,45 49,45 49,46 49,57 49,68 49,71 49,7 49,7 49,8 49,84 50,09 50,2 50,16 50,16 50,29 50,36 51,02 51,03 51,04 | |||||||||||||||||||||||||||||||||
Tables (Output of Computation) | |||||||||||||||||||||||||||||||||
| |||||||||||||||||||||||||||||||||
Figures (Output of Computation) | |||||||||||||||||||||||||||||||||
Input Parameters & R Code | |||||||||||||||||||||||||||||||||
| Parameters (Session): | |||||||||||||||||||||||||||||||||
| Parameters (R input): | |||||||||||||||||||||||||||||||||
| R code (references can be found in the software module): | |||||||||||||||||||||||||||||||||
bitmap(file='density1.png') | |||||||||||||||||||||||||||||||||