Free Statistics
of Irreproducible Research!
Description of Statistical Computation | |||||||||||||||||||||||||||||||||||||||||
|---|---|---|---|---|---|---|---|---|---|---|---|---|---|---|---|---|---|---|---|---|---|---|---|---|---|---|---|---|---|---|---|---|---|---|---|---|---|---|---|---|---|
| Author's title | |||||||||||||||||||||||||||||||||||||||||
| Author | *Unverified author* | ||||||||||||||||||||||||||||||||||||||||
| R Software Module | rwasp_univariatedataseries.wasp | ||||||||||||||||||||||||||||||||||||||||
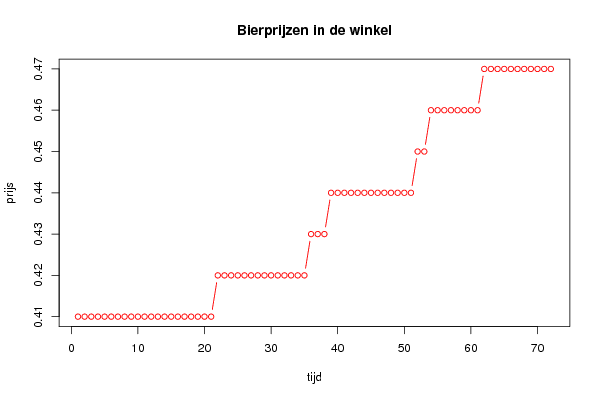
| Title produced by software | Univariate Data Series | ||||||||||||||||||||||||||||||||||||||||
| Date of computation | Mon, 25 Feb 2008 08:19:40 -0700 | ||||||||||||||||||||||||||||||||||||||||
| Cite this page as follows | Statistical Computations at FreeStatistics.org, Office for Research Development and Education, URL https://freestatistics.org/blog/index.php?v=date/2008/Feb/25/t1203952824swrtndlriph1amc.htm/, Retrieved Sat, 11 May 2024 17:33:37 +0000 | ||||||||||||||||||||||||||||||||||||||||
| Statistical Computations at FreeStatistics.org, Office for Research Development and Education, URL https://freestatistics.org/blog/index.php?pk=8922, Retrieved Sat, 11 May 2024 17:33:37 +0000 | |||||||||||||||||||||||||||||||||||||||||
| QR Codes: | |||||||||||||||||||||||||||||||||||||||||
|
| |||||||||||||||||||||||||||||||||||||||||
| Original text written by user: | |||||||||||||||||||||||||||||||||||||||||
| IsPrivate? | No (this computation is public) | ||||||||||||||||||||||||||||||||||||||||
| User-defined keywords | |||||||||||||||||||||||||||||||||||||||||
| Estimated Impact | 188 | ||||||||||||||||||||||||||||||||||||||||
Tree of Dependent Computations | |||||||||||||||||||||||||||||||||||||||||
| Family? (F = Feedback message, R = changed R code, M = changed R Module, P = changed Parameters, D = changed Data) | |||||||||||||||||||||||||||||||||||||||||
| - [Univariate Data Series] [Bierprijzen - Qui...] [2008-02-25 15:19:40] [4c7a5669b420c0879a97a0998c00f1a1] [Current] | |||||||||||||||||||||||||||||||||||||||||
| Feedback Forum | |||||||||||||||||||||||||||||||||||||||||
Post a new message | |||||||||||||||||||||||||||||||||||||||||
Dataset | |||||||||||||||||||||||||||||||||||||||||
| Dataseries X: | |||||||||||||||||||||||||||||||||||||||||
0,41 0,41 0,41 0,41 0,41 0,41 0,41 0,41 0,41 0,41 0,41 0,41 0,41 0,41 0,41 0,41 0,41 0,41 0,41 0,41 0,41 0,42 0,42 0,42 0,42 0,42 0,42 0,42 0,42 0,42 0,42 0,42 0,42 0,42 0,42 0,43 0,43 0,43 0,44 0,44 0,44 0,44 0,44 0,44 0,44 0,44 0,44 0,44 0,44 0,44 0,44 0,45 0,45 0,46 0,46 0,46 0,46 0,46 0,46 0,46 0,46 0,47 0,47 0,47 0,47 0,47 0,47 0,47 0,47 0,47 0,47 0,47 | |||||||||||||||||||||||||||||||||||||||||
Tables (Output of Computation) | |||||||||||||||||||||||||||||||||||||||||
| |||||||||||||||||||||||||||||||||||||||||
Figures (Output of Computation) | |||||||||||||||||||||||||||||||||||||||||
Input Parameters & R Code | |||||||||||||||||||||||||||||||||||||||||
| Parameters (Session): | |||||||||||||||||||||||||||||||||||||||||
| par1 = Bierprijzen ; par2 = http://www.nbb.be/belgostat/PublicatieSelectieLinker?LinkID=151000093|910000082&Lang=N ; par3 = Prijzen van bier in de winkel ; | |||||||||||||||||||||||||||||||||||||||||
| Parameters (R input): | |||||||||||||||||||||||||||||||||||||||||
| par1 = Bierprijzen ; par2 = http://www.nbb.be/belgostat/PublicatieSelectieLinker?LinkID=151000093|910000082&Lang=N ; par3 = Prijzen van bier in de winkel ; | |||||||||||||||||||||||||||||||||||||||||
| R code (references can be found in the software module): | |||||||||||||||||||||||||||||||||||||||||
bitmap(file='test1.png') | |||||||||||||||||||||||||||||||||||||||||