Free Statistics

of Irreproducible Research!

Author's title

Author*Unverified author*
R Software Modulerwasp_histogram.wasp
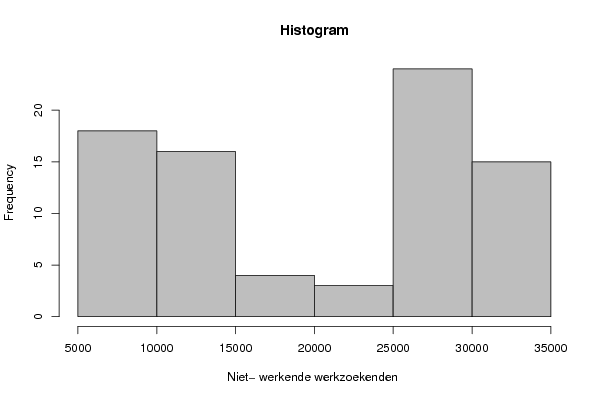
Title produced by softwareHistogram
Date of computationSat, 23 Feb 2008 06:20:53 -0700
Cite this page as followsStatistical Computations at FreeStatistics.org, Office for Research Development and Education, URL https://freestatistics.org/blog/index.php?v=date/2008/Feb/23/t1203773064u8wi4i2yo0hs5i1.htm/, Retrieved Mon, 13 May 2024 23:13:06 +0000
Statistical Computations at FreeStatistics.org, Office for Research Development and Education, URL https://freestatistics.org/blog/index.php?pk=8559, Retrieved Mon, 13 May 2024 23:13:06 +0000
QR Codes:

Original text written by user:
IsPrivate?No (this computation is public)
User-defined keywordsNiet-werkende werkzoekenden van 50 tot -55 jaar.
Estimated Impact201
Family? (F = Feedback message, R = changed R code, M = changed R Module, P = changed Parameters, D = changed Data)
-       [Histogram] [Histogram] [2008-02-23 13:20:53] [d8973bbb712c03ae516525a15d4e5e48] [Current]
Feedback Forum

Post a new message
Dataseries X:
7840
8292
8534
8441
8602
8468
8832
9006
8749
8714
8193
8251
8192
9056
9407
9068
9431
9907
10044
10838
10871
11127
11303
11349
11493
12694
13227
12253
12234
12491
13248
14042
14392
14834
15542
15518
16197
17325
24016
23671
24998
25329
25904
26548
26752
26967
27034
27056
27476
28497
29085
28720
29067
29249
29672
29761
30066
30315
30571
30757
30742
31310
31381
31470
31226
31081
31061
31114
30828
30418
30195
29877
29192
29876
29409
28458
28340
28164
28438
28053


Summary of compuational transaction
Raw Inputview raw input (R code)
Raw Outputview raw output of R engine
Computing time2 seconds
R Server'Sir Ronald Aylmer Fisher' @ 193.190.124.24

\begin{tabular}{lllllllll}
\hline
Summary of compuational transaction \tabularnewline
Raw Input & view raw input (R code)  \tabularnewline
Raw Output & view raw output of R engine  \tabularnewline
Computing time & 2 seconds \tabularnewline
R Server & 'Sir Ronald Aylmer Fisher' @ 193.190.124.24 \tabularnewline
\hline
\end{tabular}
%Source: https://freestatistics.org/blog/index.php?pk=8559&T=0

[TABLE]
[ROW][C]Summary of compuational transaction[/C][/ROW]
[ROW][C]Raw Input[/C][C]view raw input (R code) [/C][/ROW]
[ROW][C]Raw Output[/C][C]view raw output of R engine [/C][/ROW]
[ROW][C]Computing time[/C][C]2 seconds[/C][/ROW]
[ROW][C]R Server[/C][C]'Sir Ronald Aylmer Fisher' @ 193.190.124.24[/C][/ROW]
[/TABLE]
Source: https://freestatistics.org/blog/index.php?pk=8559&T=0

Globally Unique Identifier (entire table): ba.freestatistics.org/blog/index.php?pk=8559&T=0

As an alternative you can also use a QR Code:  

The GUIDs for individual cells are displayed in the table below:

Summary of compuational transaction
Raw Inputview raw input (R code)
Raw Outputview raw output of R engine
Computing time2 seconds
R Server'Sir Ronald Aylmer Fisher' @ 193.190.124.24


Frequency Table (Histogram)
BinsMidpointAbs. FrequencyRel. FrequencyCumul. Rel. Freq.Density
[5000,10000[7500180.2250.2254.5e-05
[10000,15000[12500160.20.4254e-05
[15000,20000[1750040.050.4751e-05
[20000,25000[2250030.03750.51258e-06
[25000,30000[27500240.30.81256e-05
[30000,35000]32500150.187513.7e-05

\begin{tabular}{lllllllll}
\hline
Frequency Table (Histogram) \tabularnewline
Bins & Midpoint & Abs. Frequency & Rel. Frequency & Cumul. Rel. Freq. & Density \tabularnewline
[5000,10000[ & 7500 & 18 & 0.225 & 0.225 & 4.5e-05 \tabularnewline
[10000,15000[ & 12500 & 16 & 0.2 & 0.425 & 4e-05 \tabularnewline
[15000,20000[ & 17500 & 4 & 0.05 & 0.475 & 1e-05 \tabularnewline
[20000,25000[ & 22500 & 3 & 0.0375 & 0.5125 & 8e-06 \tabularnewline
[25000,30000[ & 27500 & 24 & 0.3 & 0.8125 & 6e-05 \tabularnewline
[30000,35000] & 32500 & 15 & 0.1875 & 1 & 3.7e-05 \tabularnewline
\hline
\end{tabular}
%Source: https://freestatistics.org/blog/index.php?pk=8559&T=1

[TABLE]
[ROW][C]Frequency Table (Histogram)[/C][/ROW]
[ROW][C]Bins[/C][C]Midpoint[/C][C]Abs. Frequency[/C][C]Rel. Frequency[/C][C]Cumul. Rel. Freq.[/C][C]Density[/C][/ROW]
[ROW][C][5000,10000[[/C][C]7500[/C][C]18[/C][C]0.225[/C][C]0.225[/C][C]4.5e-05[/C][/ROW]
[ROW][C][10000,15000[[/C][C]12500[/C][C]16[/C][C]0.2[/C][C]0.425[/C][C]4e-05[/C][/ROW]
[ROW][C][15000,20000[[/C][C]17500[/C][C]4[/C][C]0.05[/C][C]0.475[/C][C]1e-05[/C][/ROW]
[ROW][C][20000,25000[[/C][C]22500[/C][C]3[/C][C]0.0375[/C][C]0.5125[/C][C]8e-06[/C][/ROW]
[ROW][C][25000,30000[[/C][C]27500[/C][C]24[/C][C]0.3[/C][C]0.8125[/C][C]6e-05[/C][/ROW]
[ROW][C][30000,35000][/C][C]32500[/C][C]15[/C][C]0.1875[/C][C]1[/C][C]3.7e-05[/C][/ROW]
[/TABLE]
Source: https://freestatistics.org/blog/index.php?pk=8559&T=1

Globally Unique Identifier (entire table): ba.freestatistics.org/blog/index.php?pk=8559&T=1

As an alternative you can also use a QR Code:  

The GUIDs for individual cells are displayed in the table below:

Frequency Table (Histogram)
BinsMidpointAbs. FrequencyRel. FrequencyCumul. Rel. Freq.Density
[5000,10000[7500180.2250.2254.5e-05
[10000,15000[12500160.20.4254e-05
[15000,20000[1750040.050.4751e-05
[20000,25000[2250030.03750.51258e-06
[25000,30000[27500240.30.81256e-05
[30000,35000]32500150.187513.7e-05


Parameters (Session):
par2 = grey ; par3 = FALSE ; par4 = Unknown ;
Parameters (R input):
par1 = ; par2 = grey ; par3 = FALSE ; par4 = Unknown ;
R code (references can be found in the software module):
par1 <- as.numeric(par1)
if (par3 == 'TRUE') par3 <- TRUE
if (par3 == 'FALSE') par3 <- FALSE
if (par4 == 'Unknown') par1 <- as.numeric(par1)
if (par4 == 'Interval/Ratio') par1 <- as.numeric(par1)
if (par4 == '3-point Likert') par1 <- c(1:3 - 0.5, 3.5)
if (par4 == '4-point Likert') par1 <- c(1:4 - 0.5, 4.5)
if (par4 == '5-point Likert') par1 <- c(1:5 - 0.5, 5.5)
if (par4 == '6-point Likert') par1 <- c(1:6 - 0.5, 6.5)
if (par4 == '7-point Likert') par1 <- c(1:7 - 0.5, 7.5)
if (par4 == '8-point Likert') par1 <- c(1:8 - 0.5, 8.5)
if (par4 == '9-point Likert') par1 <- c(1:9 - 0.5, 9.5)
if (par4 == '10-point Likert') par1 <- c(1:10 - 0.5, 10.5)
bitmap(file='test1.png')
if (is.na(par1)) {
myhist<-hist(x,col=par2,main=main,xlab=xlab,right=par3)
} else {
if (par1 < 0) par1 <- 3
if (par1 > 50) par1 <- 50
myhist<-hist(x,breaks=par1,col=par2,main=main,xlab=xlab,right=par3)
}
dev.off()
myhist
n <- length(x)
load(file='createtable')
a<-table.start()
a<-table.row.start(a)
a<-table.element(a,hyperlink('histogram.htm','Frequency Table (Histogram)',''),6,TRUE)
a<-table.row.end(a)
a<-table.row.start(a)
a<-table.element(a,'Bins',header=TRUE)
a<-table.element(a,'Midpoint',header=TRUE)
a<-table.element(a,'Abs. Frequency',header=TRUE)
a<-table.element(a,'Rel. Frequency',header=TRUE)
a<-table.element(a,'Cumul. Rel. Freq.',header=TRUE)
a<-table.element(a,'Density',header=TRUE)
a<-table.row.end(a)
crf <- 0
if (par3 == FALSE) mybracket <- '[' else mybracket <- ']'
mynumrows <- (length(myhist$breaks)-1)
for (i in 1:mynumrows) {
a<-table.row.start(a)
if (i == 1)
dum <- paste('[',myhist$breaks[i],sep='')
else
dum <- paste(mybracket,myhist$breaks[i],sep='')
dum <- paste(dum,myhist$breaks[i+1],sep=',')
if (i==mynumrows)
dum <- paste(dum,']',sep='')
else
dum <- paste(dum,mybracket,sep='')
a<-table.element(a,dum,header=TRUE)
a<-table.element(a,myhist$mids[i])
a<-table.element(a,myhist$counts[i])
rf <- myhist$counts[i]/n
crf <- crf + rf
a<-table.element(a,round(rf,6))
a<-table.element(a,round(crf,6))
a<-table.element(a,round(myhist$density[i],6))
a<-table.row.end(a)
}
a<-table.end(a)
table.save(a,file='mytable.tab')