Free Statistics
of Irreproducible Research!
Description of Statistical Computation | |||||||||||||||||||||||||||||||||||||||||
|---|---|---|---|---|---|---|---|---|---|---|---|---|---|---|---|---|---|---|---|---|---|---|---|---|---|---|---|---|---|---|---|---|---|---|---|---|---|---|---|---|---|
| Author's title | |||||||||||||||||||||||||||||||||||||||||
| Author | *Unverified author* | ||||||||||||||||||||||||||||||||||||||||
| R Software Module | rwasp_univariatedataseries.wasp | ||||||||||||||||||||||||||||||||||||||||
| Title produced by software | Univariate Data Series | ||||||||||||||||||||||||||||||||||||||||
| Date of computation | Tue, 19 Feb 2008 23:58:56 -0700 | ||||||||||||||||||||||||||||||||||||||||
| Cite this page as follows | Statistical Computations at FreeStatistics.org, Office for Research Development and Education, URL https://freestatistics.org/blog/index.php?v=date/2008/Feb/20/t1203491657a6jle0g42sjfmgr.htm/, Retrieved Sat, 11 May 2024 10:10:34 +0000 | ||||||||||||||||||||||||||||||||||||||||
| Statistical Computations at FreeStatistics.org, Office for Research Development and Education, URL https://freestatistics.org/blog/index.php?pk=8386, Retrieved Sat, 11 May 2024 10:10:34 +0000 | |||||||||||||||||||||||||||||||||||||||||
| QR Codes: | |||||||||||||||||||||||||||||||||||||||||
|
| |||||||||||||||||||||||||||||||||||||||||
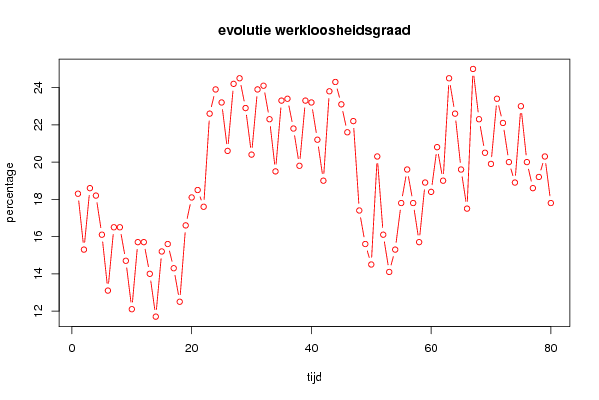
| Original text written by user: | evolutie van de werkloosheidsgraad in laatste 20 jaar (voor mensen jonger dan 25) | ||||||||||||||||||||||||||||||||||||||||
| IsPrivate? | No (this computation is public) | ||||||||||||||||||||||||||||||||||||||||
| User-defined keywords | |||||||||||||||||||||||||||||||||||||||||
| Estimated Impact | 207 | ||||||||||||||||||||||||||||||||||||||||
Tree of Dependent Computations | |||||||||||||||||||||||||||||||||||||||||
| Family? (F = Feedback message, R = changed R code, M = changed R Module, P = changed Parameters, D = changed Data) | |||||||||||||||||||||||||||||||||||||||||
| - [Univariate Data Series] [] [2008-02-20 06:58:56] [2fa459907c4dcce485bca7190e4cae85] [Current] | |||||||||||||||||||||||||||||||||||||||||
| Feedback Forum | |||||||||||||||||||||||||||||||||||||||||
Post a new message | |||||||||||||||||||||||||||||||||||||||||
Dataset | |||||||||||||||||||||||||||||||||||||||||
| Dataseries X: | |||||||||||||||||||||||||||||||||||||||||
18,3 15,3 18,6 18,2 16,1 13,1 16,5 16,5 14,7 12,1 15,7 15,7 14 11,7 15,2 15,6 14,3 12,5 16,6 18,1 18,5 17,6 22,6 23,9 23,2 20,6 24,2 24,5 22,9 20,4 23,9 24,1 22,3 19,5 23,3 23,4 21,8 19,8 23,3 23,2 21,2 19 23,8 24,3 23,1 21,6 22,2 17,4 15,6 14,5 20,3 16,1 14,1 15,3 17,8 19,6 17,8 15,7 18,9 18,4 20,8 19 24,5 22,6 19,6 17,5 25 22,3 20,5 19,9 23,4 22,1 20 18,9 23 20 18,6 19,2 20,3 17,8 | |||||||||||||||||||||||||||||||||||||||||
Tables (Output of Computation) | |||||||||||||||||||||||||||||||||||||||||
| |||||||||||||||||||||||||||||||||||||||||
Figures (Output of Computation) | |||||||||||||||||||||||||||||||||||||||||
Input Parameters & R Code | |||||||||||||||||||||||||||||||||||||||||
| Parameters (Session): | |||||||||||||||||||||||||||||||||||||||||
| par1 = Werkloosheidsgraad onder 25 jaar ; par2 = berekening NBB, methode EUROSTAT, gegevens RVA ; par3 = evolutie van de werkloosheidsgraad in laatste 20 jaar ; | |||||||||||||||||||||||||||||||||||||||||
| Parameters (R input): | |||||||||||||||||||||||||||||||||||||||||
| par1 = Werkloosheidsgraad onder 25 jaar ; par2 = berekening NBB, methode EUROSTAT, gegevens RVA ; par3 = evolutie van de werkloosheidsgraad in laatste 20 jaar ; | |||||||||||||||||||||||||||||||||||||||||
| R code (references can be found in the software module): | |||||||||||||||||||||||||||||||||||||||||
bitmap(file='test1.png') | |||||||||||||||||||||||||||||||||||||||||