Free Statistics
of Irreproducible Research!
Description of Statistical Computation | |||||||||||||||||||||||||||||||||||||||||
|---|---|---|---|---|---|---|---|---|---|---|---|---|---|---|---|---|---|---|---|---|---|---|---|---|---|---|---|---|---|---|---|---|---|---|---|---|---|---|---|---|---|
| Author's title | |||||||||||||||||||||||||||||||||||||||||
| Author | *Unverified author* | ||||||||||||||||||||||||||||||||||||||||
| R Software Module | rwasp_univariatedataseries.wasp | ||||||||||||||||||||||||||||||||||||||||
| Title produced by software | Univariate Data Series | ||||||||||||||||||||||||||||||||||||||||
| Date of computation | Mon, 18 Feb 2008 09:29:36 -0700 | ||||||||||||||||||||||||||||||||||||||||
| Cite this page as follows | Statistical Computations at FreeStatistics.org, Office for Research Development and Education, URL https://freestatistics.org/blog/index.php?v=date/2008/Feb/18/t1203352328d8ygojzzw6i8g7h.htm/, Retrieved Thu, 09 May 2024 18:18:51 +0000 | ||||||||||||||||||||||||||||||||||||||||
| Statistical Computations at FreeStatistics.org, Office for Research Development and Education, URL https://freestatistics.org/blog/index.php?pk=8340, Retrieved Thu, 09 May 2024 18:18:51 +0000 | |||||||||||||||||||||||||||||||||||||||||
| QR Codes: | |||||||||||||||||||||||||||||||||||||||||
|
| |||||||||||||||||||||||||||||||||||||||||
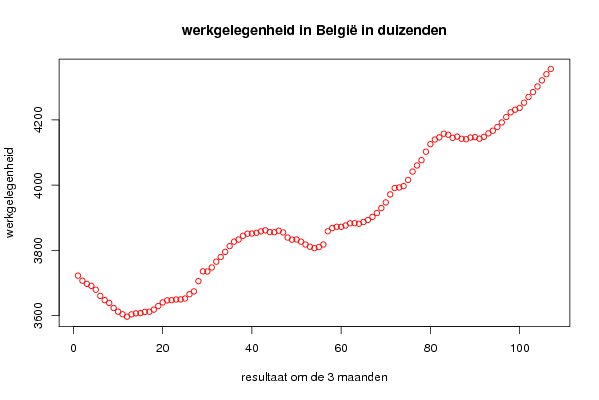
| Original text written by user: | Deze gegevens stellen de werkgelegenheid in Belgi� voor weergegeven om de 3 maanden sinds 1981 tot en met september 2007 | ||||||||||||||||||||||||||||||||||||||||
| IsPrivate? | No (this computation is public) | ||||||||||||||||||||||||||||||||||||||||
| User-defined keywords | |||||||||||||||||||||||||||||||||||||||||
| Estimated Impact | 328 | ||||||||||||||||||||||||||||||||||||||||
Tree of Dependent Computations | |||||||||||||||||||||||||||||||||||||||||
| Family? (F = Feedback message, R = changed R code, M = changed R Module, P = changed Parameters, D = changed Data) | |||||||||||||||||||||||||||||||||||||||||
| - [Univariate Data Series] [Werkgelegenheid i...] [2008-02-18 16:29:36] [3c8131ba61d1cf691c39623fabb076c5] [Current] | |||||||||||||||||||||||||||||||||||||||||
| Feedback Forum | |||||||||||||||||||||||||||||||||||||||||
Post a new message | |||||||||||||||||||||||||||||||||||||||||
Dataset | |||||||||||||||||||||||||||||||||||||||||
| Dataseries X: | |||||||||||||||||||||||||||||||||||||||||
3722.7 3707.1 3697.4 3691.4 3679.4 3660.6 3647.5 3639 3623.5 3612.2 3604.2 3596.9 3603.9 3606.9 3607.7 3611.4 3611.9 3618.4 3629.5 3640.6 3646.8 3647.3 3649.5 3649.7 3652.5 3665.8 3674.3 3705.8 3735.8 3735.4 3747.7 3765.5 3779.7 3795.5 3813.1 3826.9 3833.3 3844.8 3851.3 3851.8 3854.1 3858.4 3861.6 3856.3 3855.8 3860.4 3855.1 3839.5 3833 3833.6 3826.8 3818.2 3811.4 3806.8 3810.3 3818.2 3858.7 3868.7 3872.6 3872.4 3876.4 3883.2 3883.4 3881.8 3887.1 3893.3 3902.8 3914.7 3929.8 3947.3 3971.8 3991.3 3993 3997.2 4016.2 4041.7 4060.5 4076.7 4102.7 4125.8 4140.1 4146.7 4157.9 4154.7 4145.3 4149 4142.4 4141 4146.1 4147.6 4142.7 4148.1 4159 4167 4178.5 4192.5 4209.2 4223.7 4231.6 4236.9 4253 4270.5 4285.7 4302.8 4321.5 4340.3 4356.5 | |||||||||||||||||||||||||||||||||||||||||
Tables (Output of Computation) | |||||||||||||||||||||||||||||||||||||||||
| |||||||||||||||||||||||||||||||||||||||||
Figures (Output of Computation) | |||||||||||||||||||||||||||||||||||||||||
Input Parameters & R Code | |||||||||||||||||||||||||||||||||||||||||
| Parameters (Session): | |||||||||||||||||||||||||||||||||||||||||
| par1 = werkgelegenheid ; par2 = www.belgostat.Be ; par3 = Deze gegevens geeft de evolutie weer van de werkgelegenheid in Belgi� over 30 jaar telkens weergegeven om de 3 maanden ; | |||||||||||||||||||||||||||||||||||||||||
| Parameters (R input): | |||||||||||||||||||||||||||||||||||||||||
| par1 = werkgelegenheid ; par2 = www.belgostat.Be ; par3 = Deze gegevens geeft de evolutie weer van de werkgelegenheid in Belgi� over 30 jaar telkens weergegeven om de 3 maanden ; | |||||||||||||||||||||||||||||||||||||||||
| R code (references can be found in the software module): | |||||||||||||||||||||||||||||||||||||||||
bitmap(file='test1.png') | |||||||||||||||||||||||||||||||||||||||||