Free Statistics
of Irreproducible Research!
Description of Statistical Computation | |||||||||||||||||||||||||||||||||||||||||
|---|---|---|---|---|---|---|---|---|---|---|---|---|---|---|---|---|---|---|---|---|---|---|---|---|---|---|---|---|---|---|---|---|---|---|---|---|---|---|---|---|---|
| Author's title | |||||||||||||||||||||||||||||||||||||||||
| Author | *Unverified author* | ||||||||||||||||||||||||||||||||||||||||
| R Software Module | rwasp_univariatedataseries.wasp | ||||||||||||||||||||||||||||||||||||||||
| Title produced by software | Univariate Data Series | ||||||||||||||||||||||||||||||||||||||||
| Date of computation | Tue, 12 Feb 2008 04:06:27 -0700 | ||||||||||||||||||||||||||||||||||||||||
| Cite this page as follows | Statistical Computations at FreeStatistics.org, Office for Research Development and Education, URL https://freestatistics.org/blog/index.php?v=date/2008/Feb/12/t12028145558nqayy59vv8d5bl.htm/, Retrieved Sun, 12 May 2024 11:46:54 +0000 | ||||||||||||||||||||||||||||||||||||||||
| Statistical Computations at FreeStatistics.org, Office for Research Development and Education, URL https://freestatistics.org/blog/index.php?pk=14666, Retrieved Sun, 12 May 2024 11:46:54 +0000 | |||||||||||||||||||||||||||||||||||||||||
| QR Codes: | |||||||||||||||||||||||||||||||||||||||||
|
| |||||||||||||||||||||||||||||||||||||||||
| Original text written by user: | |||||||||||||||||||||||||||||||||||||||||
| IsPrivate? | No (this computation is public) | ||||||||||||||||||||||||||||||||||||||||
| User-defined keywords | |||||||||||||||||||||||||||||||||||||||||
| Estimated Impact | 269 | ||||||||||||||||||||||||||||||||||||||||
Tree of Dependent Computations | |||||||||||||||||||||||||||||||||||||||||
| Family? (F = Feedback message, R = changed R code, M = changed R Module, P = changed Parameters, D = changed Data) | |||||||||||||||||||||||||||||||||||||||||
| - [Univariate Data Series] [Tijdreeks � Prijs...] [2008-02-12 11:06:27] [57b70cf7dac5655af4bf79fd35e84c41] [Current] | |||||||||||||||||||||||||||||||||||||||||
| Feedback Forum | |||||||||||||||||||||||||||||||||||||||||
Post a new message | |||||||||||||||||||||||||||||||||||||||||
Dataset | |||||||||||||||||||||||||||||||||||||||||
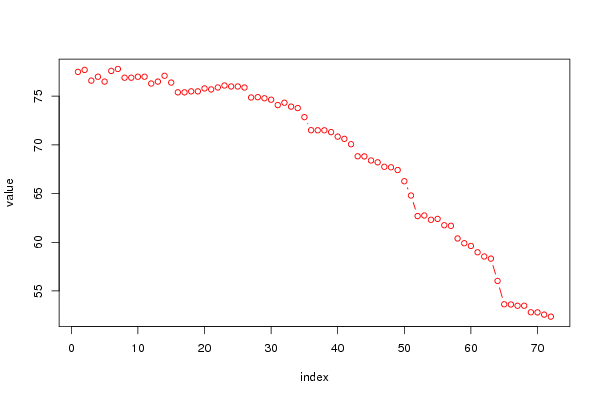
| Dataseries X: | |||||||||||||||||||||||||||||||||||||||||
77.5 77.7 76.6 77 76.5 77.6 77.8 76.9 76.9 77 77 76.3 76.5 77.1 76.4 75.4 75.4 75.5 75.5 75.8 75.7 75.9 76.1 76 76 75.89 74.87 74.9 74.79 74.64 74.09 74.33 73.93 73.78 72.85 71.51 71.5 71.5 71.31 70.85 70.62 70.07 68.83 68.82 68.4 68.21 67.75 67.7 67.42 66.27 64.8 62.69 62.75 62.31 62.4 61.75 61.69 60.39 59.9 59.62 58.97 58.54 58.32 56.03 53.63 53.61 53.48 53.48 52.81 52.8 52.57 52.36 | |||||||||||||||||||||||||||||||||||||||||
Tables (Output of Computation) | |||||||||||||||||||||||||||||||||||||||||
| |||||||||||||||||||||||||||||||||||||||||
Figures (Output of Computation) | |||||||||||||||||||||||||||||||||||||||||
Input Parameters & R Code | |||||||||||||||||||||||||||||||||||||||||
| Parameters (Session): | |||||||||||||||||||||||||||||||||||||||||
| par1 = Start of session ; par2 = Start of session ; par3 = Start of session ; par4 = Start of session ; par5 = Start of session ; par6 = Start of session ; par7 = Start of session ; par8 = Start of session ; par9 = Start of session ; par10 = Start of session ; par11 = Start of session ; par12 = Start of session ; par13 = Start of session ; par14 = Start of session ; par15 = Start of session ; par16 = Start of session ; par17 = Start of session ; par18 = Start of session ; par19 = Start of session ; par20 = Start of session ; | |||||||||||||||||||||||||||||||||||||||||
| Parameters (R input): | |||||||||||||||||||||||||||||||||||||||||
| par1 = Prijsevolutie faxtoestellen ; par2 = http://www.belgostat.be ; par3 = Gegevens van 2000 tot 2005 ; | |||||||||||||||||||||||||||||||||||||||||
| R code (references can be found in the software module): | |||||||||||||||||||||||||||||||||||||||||
bitmap(file='test1.png') | |||||||||||||||||||||||||||||||||||||||||