Free Statistics
of Irreproducible Research!
Description of Statistical Computation | |||||||||||||||||||||||||||||||||||||||||
|---|---|---|---|---|---|---|---|---|---|---|---|---|---|---|---|---|---|---|---|---|---|---|---|---|---|---|---|---|---|---|---|---|---|---|---|---|---|---|---|---|---|
| Author's title | |||||||||||||||||||||||||||||||||||||||||
| Author | *Unverified author* | ||||||||||||||||||||||||||||||||||||||||
| R Software Module | rwasp_univariatedataseries.wasp | ||||||||||||||||||||||||||||||||||||||||
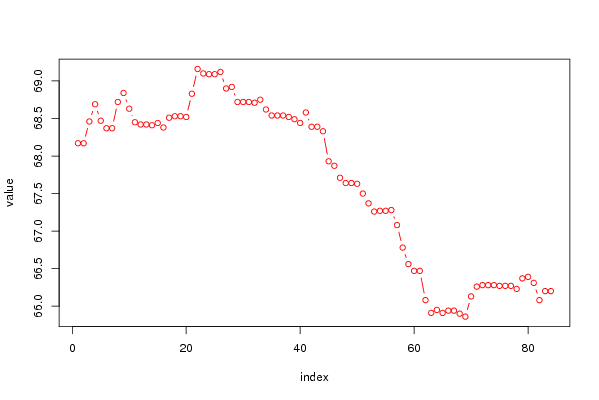
| Title produced by software | Univariate Data Series | ||||||||||||||||||||||||||||||||||||||||
| Date of computation | Tue, 12 Feb 2008 03:58:48 -0700 | ||||||||||||||||||||||||||||||||||||||||
| Cite this page as follows | Statistical Computations at FreeStatistics.org, Office for Research Development and Education, URL https://freestatistics.org/blog/index.php?v=date/2008/Feb/12/t1202814009zp9cojfd5bnbedt.htm/, Retrieved Sat, 11 May 2024 07:28:16 +0000 | ||||||||||||||||||||||||||||||||||||||||
| Statistical Computations at FreeStatistics.org, Office for Research Development and Education, URL https://freestatistics.org/blog/index.php?pk=8105, Retrieved Sat, 11 May 2024 07:28:16 +0000 | |||||||||||||||||||||||||||||||||||||||||
| QR Codes: | |||||||||||||||||||||||||||||||||||||||||
|
| |||||||||||||||||||||||||||||||||||||||||
| Original text written by user: | |||||||||||||||||||||||||||||||||||||||||
| IsPrivate? | No (this computation is public) | ||||||||||||||||||||||||||||||||||||||||
| User-defined keywords | |||||||||||||||||||||||||||||||||||||||||
| Estimated Impact | 264 | ||||||||||||||||||||||||||||||||||||||||
Tree of Dependent Computations | |||||||||||||||||||||||||||||||||||||||||
| Family? (F = Feedback message, R = changed R code, M = changed R Module, P = changed Parameters, D = changed Data) | |||||||||||||||||||||||||||||||||||||||||
| - [Univariate Data Series] [Gemiddelde prijze...] [2008-02-12 10:58:48] [0de5017ea2334b95113159299296029a] [Current] - RMPD [Quartiles] [Kwartielen opgave...] [2008-02-27 17:12:17] [938121352ceb5736f84c4583bccf5678] - RMPD [Notched Boxplots] [Box Plot maximump...] [2008-02-27 17:19:17] [938121352ceb5736f84c4583bccf5678] | |||||||||||||||||||||||||||||||||||||||||
| Feedback Forum | |||||||||||||||||||||||||||||||||||||||||
Post a new message | |||||||||||||||||||||||||||||||||||||||||
Dataset | |||||||||||||||||||||||||||||||||||||||||
| Dataseries X: | |||||||||||||||||||||||||||||||||||||||||
68,17 68,17 68,46 68,69 68,47 68,37 68,37 68,72 68,84 68,63 68,45 68,42 68,42 68,41 68,44 68,38 68,51 68,53 68,53 68,52 68,83 69,16 69,1 69,09 69,09 69,12 68,9 68,92 68,72 68,72 68,72 68,71 68,75 68,62 68,54 68,54 68,54 68,52 68,49 68,44 68,58 68,39 68,39 68,33 67,93 67,87 67,71 67,64 67,64 67,63 67,5 67,37 67,26 67,27 67,27 67,28 67,08 66,78 66,56 66,47 66,47 66,08 65,91 65,95 65,91 65,94 65,94 65,9 65,86 66,13 66,26 66,28 66,28 66,28 66,27 66,27 66,27 66,23 66,37 66,39 66,31 66,08 66,2 66,2 | |||||||||||||||||||||||||||||||||||||||||
Tables (Output of Computation) | |||||||||||||||||||||||||||||||||||||||||
| |||||||||||||||||||||||||||||||||||||||||
Figures (Output of Computation) | |||||||||||||||||||||||||||||||||||||||||
Input Parameters & R Code | |||||||||||||||||||||||||||||||||||||||||
| Parameters (Session): | |||||||||||||||||||||||||||||||||||||||||
| par1 = Gemiddelde consumptieprijzen per product: tennisschoenen ; par2 = http://www.belgostat.be ; par3 = Gemiddelde prijzen van tennisschoenen van 31/01/1999 t.e.m. 31/12/2005 ; | |||||||||||||||||||||||||||||||||||||||||
| Parameters (R input): | |||||||||||||||||||||||||||||||||||||||||
| par1 = Gemiddelde consumptieprijzen per product: tennisschoenen ; par2 = http://www.belgostat.be ; par3 = Gemiddelde prijzen van tennisschoenen van 31/01/1999 t.e.m. 31/12/2005 ; | |||||||||||||||||||||||||||||||||||||||||
| R code (references can be found in the software module): | |||||||||||||||||||||||||||||||||||||||||
bitmap(file='test1.png') | |||||||||||||||||||||||||||||||||||||||||