Free Statistics

of Irreproducible Research!

Author's title

Author*Unverified author*
R Software Modulerwasp_autocorrelation.wasp
Title produced by software(Partial) Autocorrelation Function
Date of computationWed, 24 Dec 2008 07:31:53 -0700
Cite this page as followsStatistical Computations at FreeStatistics.org, Office for Research Development and Education, URL https://freestatistics.org/blog/index.php?v=date/2008/Dec/24/t12301291902zavyeo879v4t47.htm/, Retrieved Fri, 17 May 2024 06:38:43 +0000
Statistical Computations at FreeStatistics.org, Office for Research Development and Education, URL https://freestatistics.org/blog/index.php?pk=36592, Retrieved Fri, 17 May 2024 06:38:43 +0000
QR Codes:

Original text written by user:
IsPrivate?No (this computation is public)
User-defined keywords
Estimated Impact169
Family? (F = Feedback message, R = changed R code, M = changed R Module, P = changed Parameters, D = changed Data)
-       [(Partial) Autocorrelation Function] [] [2008-12-24 14:31:53] [d41d8cd98f00b204e9800998ecf8427e] [Current]
-   P     [(Partial) Autocorrelation Function] [] [2008-12-24 14:35:03] [74be16979710d4c4e7c6647856088456]
-   P       [(Partial) Autocorrelation Function] [] [2008-12-24 14:41:27] [74be16979710d4c4e7c6647856088456]
Feedback Forum

Post a new message
Dataseries X:
555
562
561
555
544
537
543
594
611
613
611
594
595
591
589
584
573
567
569
621
629
628
612
595
597
593
590
580
574
573
573
620
626
620
588
566
557
561
549
532
526
511
499
555
565
542
527
510
514
517
508
493
490
469
478
528
534
518
506
502


Summary of computational transaction
Raw Inputview raw input (R code)
Raw Outputview raw output of R engine
Computing time3 seconds
R Server'Herman Ole Andreas Wold' @ 193.190.124.10:1001

\begin{tabular}{lllllllll}
\hline
Summary of computational transaction \tabularnewline
Raw Input & view raw input (R code)  \tabularnewline
Raw Output & view raw output of R engine  \tabularnewline
Computing time & 3 seconds \tabularnewline
R Server & 'Herman Ole Andreas Wold' @ 193.190.124.10:1001 \tabularnewline
\hline
\end{tabular}
%Source: https://freestatistics.org/blog/index.php?pk=36592&T=0

[TABLE]
[ROW][C]Summary of computational transaction[/C][/ROW]
[ROW][C]Raw Input[/C][C]view raw input (R code) [/C][/ROW]
[ROW][C]Raw Output[/C][C]view raw output of R engine [/C][/ROW]
[ROW][C]Computing time[/C][C]3 seconds[/C][/ROW]
[ROW][C]R Server[/C][C]'Herman Ole Andreas Wold' @ 193.190.124.10:1001[/C][/ROW]
[/TABLE]
Source: https://freestatistics.org/blog/index.php?pk=36592&T=0

Globally Unique Identifier (entire table): ba.freestatistics.org/blog/index.php?pk=36592&T=0

As an alternative you can also use a QR Code:  

The GUIDs for individual cells are displayed in the table below:

Summary of computational transaction
Raw Inputview raw input (R code)
Raw Outputview raw output of R engine
Computing time3 seconds
R Server'Herman Ole Andreas Wold' @ 193.190.124.10:1001


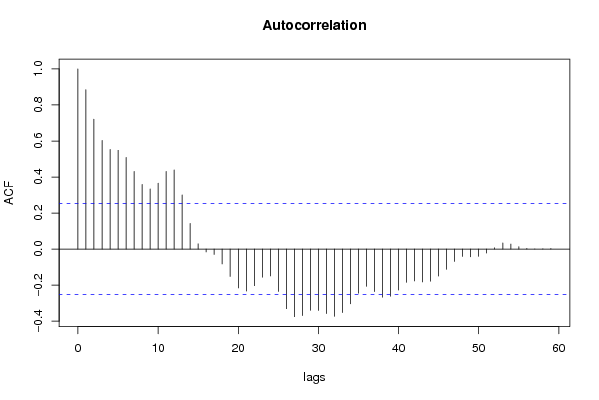
Autocorrelation Function
Time lag kACF(k)T-STATP-value
10.8851946.85670
20.7214475.58830
30.6033464.67359e-06
40.5532374.28543.4e-05
50.5486364.24973.8e-05
60.5087963.94110.000107
70.4314573.3420.000718
80.3592722.78290.003596
90.3343382.58980.006018
100.3660532.83540.003114
110.4309883.33840.000726
120.4393893.40350.000595
130.3008332.33020.011587
140.1427621.10580.136608
150.0296970.230.409425
16-0.0155-0.12010.452417
17-0.029292-0.22690.410637
18-0.082128-0.63620.263546
19-0.151946-1.1770.121929
20-0.215521-1.66940.050122
21-0.232821-1.80340.038172
22-0.203239-1.57430.06034
23-0.155499-1.20450.116566
24-0.148866-1.15310.12672
25-0.234602-1.81720.037089
26-0.330452-2.55970.006507
27-0.374881-2.90380.002576
28-0.368928-2.85770.002929
29-0.339515-2.62990.005418
30-0.340277-2.63580.005335
31-0.357881-2.77210.003703
32-0.373032-2.88950.002681
33-0.352139-2.72770.004177
34-0.303862-2.35370.01094
35-0.244493-1.89380.031536
36-0.206212-1.59730.057725
37-0.235487-1.82410.036561
38-0.266876-2.06720.021518
39-0.26138-2.02460.023681
40-0.227214-1.760.041753
41-0.184447-1.42870.079135
42-0.17643-1.36660.088422
43-0.181898-1.4090.082002
44-0.177937-1.37830.086615
45-0.149749-1.160.125331
46-0.11182-0.86620.194929
47-0.068549-0.5310.298697
48-0.040475-0.31350.377487
49-0.042818-0.33170.370649
50-0.039739-0.30780.379644
51-0.022101-0.17120.432323
520.0075370.05840.476819
530.0340090.26340.396558
540.0280850.21750.414261
550.013320.10320.459083
560.0035040.02710.489218
570.0010480.00810.496776
580.0019640.01520.493957
590.0030910.02390.490487
60NANANA

\begin{tabular}{lllllllll}
\hline
Autocorrelation Function \tabularnewline
Time lag k & ACF(k) & T-STAT & P-value \tabularnewline
1 & 0.885194 & 6.8567 & 0 \tabularnewline
2 & 0.721447 & 5.5883 & 0 \tabularnewline
3 & 0.603346 & 4.6735 & 9e-06 \tabularnewline
4 & 0.553237 & 4.2854 & 3.4e-05 \tabularnewline
5 & 0.548636 & 4.2497 & 3.8e-05 \tabularnewline
6 & 0.508796 & 3.9411 & 0.000107 \tabularnewline
7 & 0.431457 & 3.342 & 0.000718 \tabularnewline
8 & 0.359272 & 2.7829 & 0.003596 \tabularnewline
9 & 0.334338 & 2.5898 & 0.006018 \tabularnewline
10 & 0.366053 & 2.8354 & 0.003114 \tabularnewline
11 & 0.430988 & 3.3384 & 0.000726 \tabularnewline
12 & 0.439389 & 3.4035 & 0.000595 \tabularnewline
13 & 0.300833 & 2.3302 & 0.011587 \tabularnewline
14 & 0.142762 & 1.1058 & 0.136608 \tabularnewline
15 & 0.029697 & 0.23 & 0.409425 \tabularnewline
16 & -0.0155 & -0.1201 & 0.452417 \tabularnewline
17 & -0.029292 & -0.2269 & 0.410637 \tabularnewline
18 & -0.082128 & -0.6362 & 0.263546 \tabularnewline
19 & -0.151946 & -1.177 & 0.121929 \tabularnewline
20 & -0.215521 & -1.6694 & 0.050122 \tabularnewline
21 & -0.232821 & -1.8034 & 0.038172 \tabularnewline
22 & -0.203239 & -1.5743 & 0.06034 \tabularnewline
23 & -0.155499 & -1.2045 & 0.116566 \tabularnewline
24 & -0.148866 & -1.1531 & 0.12672 \tabularnewline
25 & -0.234602 & -1.8172 & 0.037089 \tabularnewline
26 & -0.330452 & -2.5597 & 0.006507 \tabularnewline
27 & -0.374881 & -2.9038 & 0.002576 \tabularnewline
28 & -0.368928 & -2.8577 & 0.002929 \tabularnewline
29 & -0.339515 & -2.6299 & 0.005418 \tabularnewline
30 & -0.340277 & -2.6358 & 0.005335 \tabularnewline
31 & -0.357881 & -2.7721 & 0.003703 \tabularnewline
32 & -0.373032 & -2.8895 & 0.002681 \tabularnewline
33 & -0.352139 & -2.7277 & 0.004177 \tabularnewline
34 & -0.303862 & -2.3537 & 0.01094 \tabularnewline
35 & -0.244493 & -1.8938 & 0.031536 \tabularnewline
36 & -0.206212 & -1.5973 & 0.057725 \tabularnewline
37 & -0.235487 & -1.8241 & 0.036561 \tabularnewline
38 & -0.266876 & -2.0672 & 0.021518 \tabularnewline
39 & -0.26138 & -2.0246 & 0.023681 \tabularnewline
40 & -0.227214 & -1.76 & 0.041753 \tabularnewline
41 & -0.184447 & -1.4287 & 0.079135 \tabularnewline
42 & -0.17643 & -1.3666 & 0.088422 \tabularnewline
43 & -0.181898 & -1.409 & 0.082002 \tabularnewline
44 & -0.177937 & -1.3783 & 0.086615 \tabularnewline
45 & -0.149749 & -1.16 & 0.125331 \tabularnewline
46 & -0.11182 & -0.8662 & 0.194929 \tabularnewline
47 & -0.068549 & -0.531 & 0.298697 \tabularnewline
48 & -0.040475 & -0.3135 & 0.377487 \tabularnewline
49 & -0.042818 & -0.3317 & 0.370649 \tabularnewline
50 & -0.039739 & -0.3078 & 0.379644 \tabularnewline
51 & -0.022101 & -0.1712 & 0.432323 \tabularnewline
52 & 0.007537 & 0.0584 & 0.476819 \tabularnewline
53 & 0.034009 & 0.2634 & 0.396558 \tabularnewline
54 & 0.028085 & 0.2175 & 0.414261 \tabularnewline
55 & 0.01332 & 0.1032 & 0.459083 \tabularnewline
56 & 0.003504 & 0.0271 & 0.489218 \tabularnewline
57 & 0.001048 & 0.0081 & 0.496776 \tabularnewline
58 & 0.001964 & 0.0152 & 0.493957 \tabularnewline
59 & 0.003091 & 0.0239 & 0.490487 \tabularnewline
60 & NA & NA & NA \tabularnewline
\hline
\end{tabular}
%Source: https://freestatistics.org/blog/index.php?pk=36592&T=1

[TABLE]
[ROW][C]Autocorrelation Function[/C][/ROW]
[ROW][C]Time lag k[/C][C]ACF(k)[/C][C]T-STAT[/C][C]P-value[/C][/ROW]
[ROW][C]1[/C][C]0.885194[/C][C]6.8567[/C][C]0[/C][/ROW]
[ROW][C]2[/C][C]0.721447[/C][C]5.5883[/C][C]0[/C][/ROW]
[ROW][C]3[/C][C]0.603346[/C][C]4.6735[/C][C]9e-06[/C][/ROW]
[ROW][C]4[/C][C]0.553237[/C][C]4.2854[/C][C]3.4e-05[/C][/ROW]
[ROW][C]5[/C][C]0.548636[/C][C]4.2497[/C][C]3.8e-05[/C][/ROW]
[ROW][C]6[/C][C]0.508796[/C][C]3.9411[/C][C]0.000107[/C][/ROW]
[ROW][C]7[/C][C]0.431457[/C][C]3.342[/C][C]0.000718[/C][/ROW]
[ROW][C]8[/C][C]0.359272[/C][C]2.7829[/C][C]0.003596[/C][/ROW]
[ROW][C]9[/C][C]0.334338[/C][C]2.5898[/C][C]0.006018[/C][/ROW]
[ROW][C]10[/C][C]0.366053[/C][C]2.8354[/C][C]0.003114[/C][/ROW]
[ROW][C]11[/C][C]0.430988[/C][C]3.3384[/C][C]0.000726[/C][/ROW]
[ROW][C]12[/C][C]0.439389[/C][C]3.4035[/C][C]0.000595[/C][/ROW]
[ROW][C]13[/C][C]0.300833[/C][C]2.3302[/C][C]0.011587[/C][/ROW]
[ROW][C]14[/C][C]0.142762[/C][C]1.1058[/C][C]0.136608[/C][/ROW]
[ROW][C]15[/C][C]0.029697[/C][C]0.23[/C][C]0.409425[/C][/ROW]
[ROW][C]16[/C][C]-0.0155[/C][C]-0.1201[/C][C]0.452417[/C][/ROW]
[ROW][C]17[/C][C]-0.029292[/C][C]-0.2269[/C][C]0.410637[/C][/ROW]
[ROW][C]18[/C][C]-0.082128[/C][C]-0.6362[/C][C]0.263546[/C][/ROW]
[ROW][C]19[/C][C]-0.151946[/C][C]-1.177[/C][C]0.121929[/C][/ROW]
[ROW][C]20[/C][C]-0.215521[/C][C]-1.6694[/C][C]0.050122[/C][/ROW]
[ROW][C]21[/C][C]-0.232821[/C][C]-1.8034[/C][C]0.038172[/C][/ROW]
[ROW][C]22[/C][C]-0.203239[/C][C]-1.5743[/C][C]0.06034[/C][/ROW]
[ROW][C]23[/C][C]-0.155499[/C][C]-1.2045[/C][C]0.116566[/C][/ROW]
[ROW][C]24[/C][C]-0.148866[/C][C]-1.1531[/C][C]0.12672[/C][/ROW]
[ROW][C]25[/C][C]-0.234602[/C][C]-1.8172[/C][C]0.037089[/C][/ROW]
[ROW][C]26[/C][C]-0.330452[/C][C]-2.5597[/C][C]0.006507[/C][/ROW]
[ROW][C]27[/C][C]-0.374881[/C][C]-2.9038[/C][C]0.002576[/C][/ROW]
[ROW][C]28[/C][C]-0.368928[/C][C]-2.8577[/C][C]0.002929[/C][/ROW]
[ROW][C]29[/C][C]-0.339515[/C][C]-2.6299[/C][C]0.005418[/C][/ROW]
[ROW][C]30[/C][C]-0.340277[/C][C]-2.6358[/C][C]0.005335[/C][/ROW]
[ROW][C]31[/C][C]-0.357881[/C][C]-2.7721[/C][C]0.003703[/C][/ROW]
[ROW][C]32[/C][C]-0.373032[/C][C]-2.8895[/C][C]0.002681[/C][/ROW]
[ROW][C]33[/C][C]-0.352139[/C][C]-2.7277[/C][C]0.004177[/C][/ROW]
[ROW][C]34[/C][C]-0.303862[/C][C]-2.3537[/C][C]0.01094[/C][/ROW]
[ROW][C]35[/C][C]-0.244493[/C][C]-1.8938[/C][C]0.031536[/C][/ROW]
[ROW][C]36[/C][C]-0.206212[/C][C]-1.5973[/C][C]0.057725[/C][/ROW]
[ROW][C]37[/C][C]-0.235487[/C][C]-1.8241[/C][C]0.036561[/C][/ROW]
[ROW][C]38[/C][C]-0.266876[/C][C]-2.0672[/C][C]0.021518[/C][/ROW]
[ROW][C]39[/C][C]-0.26138[/C][C]-2.0246[/C][C]0.023681[/C][/ROW]
[ROW][C]40[/C][C]-0.227214[/C][C]-1.76[/C][C]0.041753[/C][/ROW]
[ROW][C]41[/C][C]-0.184447[/C][C]-1.4287[/C][C]0.079135[/C][/ROW]
[ROW][C]42[/C][C]-0.17643[/C][C]-1.3666[/C][C]0.088422[/C][/ROW]
[ROW][C]43[/C][C]-0.181898[/C][C]-1.409[/C][C]0.082002[/C][/ROW]
[ROW][C]44[/C][C]-0.177937[/C][C]-1.3783[/C][C]0.086615[/C][/ROW]
[ROW][C]45[/C][C]-0.149749[/C][C]-1.16[/C][C]0.125331[/C][/ROW]
[ROW][C]46[/C][C]-0.11182[/C][C]-0.8662[/C][C]0.194929[/C][/ROW]
[ROW][C]47[/C][C]-0.068549[/C][C]-0.531[/C][C]0.298697[/C][/ROW]
[ROW][C]48[/C][C]-0.040475[/C][C]-0.3135[/C][C]0.377487[/C][/ROW]
[ROW][C]49[/C][C]-0.042818[/C][C]-0.3317[/C][C]0.370649[/C][/ROW]
[ROW][C]50[/C][C]-0.039739[/C][C]-0.3078[/C][C]0.379644[/C][/ROW]
[ROW][C]51[/C][C]-0.022101[/C][C]-0.1712[/C][C]0.432323[/C][/ROW]
[ROW][C]52[/C][C]0.007537[/C][C]0.0584[/C][C]0.476819[/C][/ROW]
[ROW][C]53[/C][C]0.034009[/C][C]0.2634[/C][C]0.396558[/C][/ROW]
[ROW][C]54[/C][C]0.028085[/C][C]0.2175[/C][C]0.414261[/C][/ROW]
[ROW][C]55[/C][C]0.01332[/C][C]0.1032[/C][C]0.459083[/C][/ROW]
[ROW][C]56[/C][C]0.003504[/C][C]0.0271[/C][C]0.489218[/C][/ROW]
[ROW][C]57[/C][C]0.001048[/C][C]0.0081[/C][C]0.496776[/C][/ROW]
[ROW][C]58[/C][C]0.001964[/C][C]0.0152[/C][C]0.493957[/C][/ROW]
[ROW][C]59[/C][C]0.003091[/C][C]0.0239[/C][C]0.490487[/C][/ROW]
[ROW][C]60[/C][C]NA[/C][C]NA[/C][C]NA[/C][/ROW]
[/TABLE]
Source: https://freestatistics.org/blog/index.php?pk=36592&T=1

Globally Unique Identifier (entire table): ba.freestatistics.org/blog/index.php?pk=36592&T=1

As an alternative you can also use a QR Code:  

The GUIDs for individual cells are displayed in the table below:

Autocorrelation Function
Time lag kACF(k)T-STATP-value
10.8851946.85670
20.7214475.58830
30.6033464.67359e-06
40.5532374.28543.4e-05
50.5486364.24973.8e-05
60.5087963.94110.000107
70.4314573.3420.000718
80.3592722.78290.003596
90.3343382.58980.006018
100.3660532.83540.003114
110.4309883.33840.000726
120.4393893.40350.000595
130.3008332.33020.011587
140.1427621.10580.136608
150.0296970.230.409425
16-0.0155-0.12010.452417
17-0.029292-0.22690.410637
18-0.082128-0.63620.263546
19-0.151946-1.1770.121929
20-0.215521-1.66940.050122
21-0.232821-1.80340.038172
22-0.203239-1.57430.06034
23-0.155499-1.20450.116566
24-0.148866-1.15310.12672
25-0.234602-1.81720.037089
26-0.330452-2.55970.006507
27-0.374881-2.90380.002576
28-0.368928-2.85770.002929
29-0.339515-2.62990.005418
30-0.340277-2.63580.005335
31-0.357881-2.77210.003703
32-0.373032-2.88950.002681
33-0.352139-2.72770.004177
34-0.303862-2.35370.01094
35-0.244493-1.89380.031536
36-0.206212-1.59730.057725
37-0.235487-1.82410.036561
38-0.266876-2.06720.021518
39-0.26138-2.02460.023681
40-0.227214-1.760.041753
41-0.184447-1.42870.079135
42-0.17643-1.36660.088422
43-0.181898-1.4090.082002
44-0.177937-1.37830.086615
45-0.149749-1.160.125331
46-0.11182-0.86620.194929
47-0.068549-0.5310.298697
48-0.040475-0.31350.377487
49-0.042818-0.33170.370649
50-0.039739-0.30780.379644
51-0.022101-0.17120.432323
520.0075370.05840.476819
530.0340090.26340.396558
540.0280850.21750.414261
550.013320.10320.459083
560.0035040.02710.489218
570.0010480.00810.496776
580.0019640.01520.493957
590.0030910.02390.490487
60NANANA


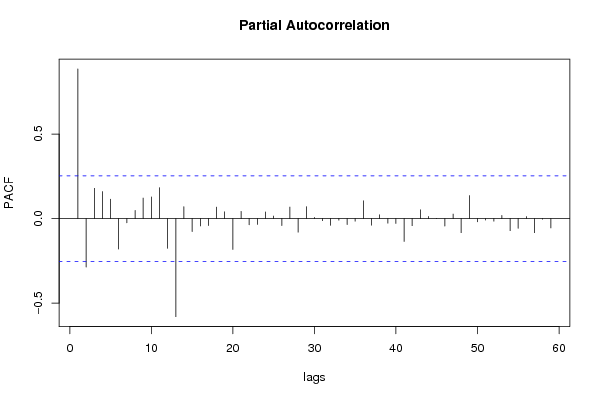
Partial Autocorrelation Function
Time lag kPACF(k)T-STATP-value
10.8851946.85670
2-0.287031-2.22330.014985
30.1787471.38460.085656
40.1595561.23590.110654
50.114250.8850.189852
6-0.18081-1.40050.08325
7-0.025096-0.19440.423262
80.047730.36970.35645
90.1212080.93890.17578
100.1277730.98970.163141
110.1821851.41120.081675
12-0.176188-1.36470.088715
13-0.580726-4.49831.6e-05
140.0699540.54190.294961
15-0.07743-0.59980.275459
16-0.04371-0.33860.368055
17-0.041441-0.3210.374664
180.0674680.52260.301586
190.0396570.30720.379885
20-0.183047-1.41790.0807
210.0423630.32810.371975
22-0.037162-0.28790.387225
23-0.0347-0.26880.39451
240.0387060.29980.382678
250.0148750.11520.454327
26-0.041823-0.3240.373548
270.0681170.52760.299851
28-0.081248-0.62930.265756
290.0697180.540.295586
300.0066670.05160.479494
31-0.013203-0.10230.459441
32-0.040432-0.31320.377614
33-0.009712-0.07520.470141
34-0.035897-0.27810.390962
35-0.01598-0.12380.450951
360.1048380.81210.209981
37-0.039327-0.30460.380852
380.021930.16990.432843
39-0.027579-0.21360.415782
40-0.029402-0.22770.41031
41-0.135298-1.0480.149417
42-0.042733-0.3310.370895
430.0515940.39960.34542
440.0123140.09540.462165
45-0.001267-0.00980.496102
46-0.044714-0.34640.365145
470.0263740.20430.419409
48-0.08404-0.6510.258775
490.1362261.05520.147781
50-0.01953-0.15130.440131
51-0.008948-0.06930.472485
52-0.016053-0.12430.450728
530.0179290.13890.445007
54-0.071917-0.55710.289776
55-0.057656-0.44660.328385
560.011680.09050.464107
57-0.084217-0.65230.258337
58-0.003972-0.03080.487779
59-0.05539-0.42910.334711
60NANANA

\begin{tabular}{lllllllll}
\hline
Partial Autocorrelation Function \tabularnewline
Time lag k & PACF(k) & T-STAT & P-value \tabularnewline
1 & 0.885194 & 6.8567 & 0 \tabularnewline
2 & -0.287031 & -2.2233 & 0.014985 \tabularnewline
3 & 0.178747 & 1.3846 & 0.085656 \tabularnewline
4 & 0.159556 & 1.2359 & 0.110654 \tabularnewline
5 & 0.11425 & 0.885 & 0.189852 \tabularnewline
6 & -0.18081 & -1.4005 & 0.08325 \tabularnewline
7 & -0.025096 & -0.1944 & 0.423262 \tabularnewline
8 & 0.04773 & 0.3697 & 0.35645 \tabularnewline
9 & 0.121208 & 0.9389 & 0.17578 \tabularnewline
10 & 0.127773 & 0.9897 & 0.163141 \tabularnewline
11 & 0.182185 & 1.4112 & 0.081675 \tabularnewline
12 & -0.176188 & -1.3647 & 0.088715 \tabularnewline
13 & -0.580726 & -4.4983 & 1.6e-05 \tabularnewline
14 & 0.069954 & 0.5419 & 0.294961 \tabularnewline
15 & -0.07743 & -0.5998 & 0.275459 \tabularnewline
16 & -0.04371 & -0.3386 & 0.368055 \tabularnewline
17 & -0.041441 & -0.321 & 0.374664 \tabularnewline
18 & 0.067468 & 0.5226 & 0.301586 \tabularnewline
19 & 0.039657 & 0.3072 & 0.379885 \tabularnewline
20 & -0.183047 & -1.4179 & 0.0807 \tabularnewline
21 & 0.042363 & 0.3281 & 0.371975 \tabularnewline
22 & -0.037162 & -0.2879 & 0.387225 \tabularnewline
23 & -0.0347 & -0.2688 & 0.39451 \tabularnewline
24 & 0.038706 & 0.2998 & 0.382678 \tabularnewline
25 & 0.014875 & 0.1152 & 0.454327 \tabularnewline
26 & -0.041823 & -0.324 & 0.373548 \tabularnewline
27 & 0.068117 & 0.5276 & 0.299851 \tabularnewline
28 & -0.081248 & -0.6293 & 0.265756 \tabularnewline
29 & 0.069718 & 0.54 & 0.295586 \tabularnewline
30 & 0.006667 & 0.0516 & 0.479494 \tabularnewline
31 & -0.013203 & -0.1023 & 0.459441 \tabularnewline
32 & -0.040432 & -0.3132 & 0.377614 \tabularnewline
33 & -0.009712 & -0.0752 & 0.470141 \tabularnewline
34 & -0.035897 & -0.2781 & 0.390962 \tabularnewline
35 & -0.01598 & -0.1238 & 0.450951 \tabularnewline
36 & 0.104838 & 0.8121 & 0.209981 \tabularnewline
37 & -0.039327 & -0.3046 & 0.380852 \tabularnewline
38 & 0.02193 & 0.1699 & 0.432843 \tabularnewline
39 & -0.027579 & -0.2136 & 0.415782 \tabularnewline
40 & -0.029402 & -0.2277 & 0.41031 \tabularnewline
41 & -0.135298 & -1.048 & 0.149417 \tabularnewline
42 & -0.042733 & -0.331 & 0.370895 \tabularnewline
43 & 0.051594 & 0.3996 & 0.34542 \tabularnewline
44 & 0.012314 & 0.0954 & 0.462165 \tabularnewline
45 & -0.001267 & -0.0098 & 0.496102 \tabularnewline
46 & -0.044714 & -0.3464 & 0.365145 \tabularnewline
47 & 0.026374 & 0.2043 & 0.419409 \tabularnewline
48 & -0.08404 & -0.651 & 0.258775 \tabularnewline
49 & 0.136226 & 1.0552 & 0.147781 \tabularnewline
50 & -0.01953 & -0.1513 & 0.440131 \tabularnewline
51 & -0.008948 & -0.0693 & 0.472485 \tabularnewline
52 & -0.016053 & -0.1243 & 0.450728 \tabularnewline
53 & 0.017929 & 0.1389 & 0.445007 \tabularnewline
54 & -0.071917 & -0.5571 & 0.289776 \tabularnewline
55 & -0.057656 & -0.4466 & 0.328385 \tabularnewline
56 & 0.01168 & 0.0905 & 0.464107 \tabularnewline
57 & -0.084217 & -0.6523 & 0.258337 \tabularnewline
58 & -0.003972 & -0.0308 & 0.487779 \tabularnewline
59 & -0.05539 & -0.4291 & 0.334711 \tabularnewline
60 & NA & NA & NA \tabularnewline
\hline
\end{tabular}
%Source: https://freestatistics.org/blog/index.php?pk=36592&T=2

[TABLE]
[ROW][C]Partial Autocorrelation Function[/C][/ROW]
[ROW][C]Time lag k[/C][C]PACF(k)[/C][C]T-STAT[/C][C]P-value[/C][/ROW]
[ROW][C]1[/C][C]0.885194[/C][C]6.8567[/C][C]0[/C][/ROW]
[ROW][C]2[/C][C]-0.287031[/C][C]-2.2233[/C][C]0.014985[/C][/ROW]
[ROW][C]3[/C][C]0.178747[/C][C]1.3846[/C][C]0.085656[/C][/ROW]
[ROW][C]4[/C][C]0.159556[/C][C]1.2359[/C][C]0.110654[/C][/ROW]
[ROW][C]5[/C][C]0.11425[/C][C]0.885[/C][C]0.189852[/C][/ROW]
[ROW][C]6[/C][C]-0.18081[/C][C]-1.4005[/C][C]0.08325[/C][/ROW]
[ROW][C]7[/C][C]-0.025096[/C][C]-0.1944[/C][C]0.423262[/C][/ROW]
[ROW][C]8[/C][C]0.04773[/C][C]0.3697[/C][C]0.35645[/C][/ROW]
[ROW][C]9[/C][C]0.121208[/C][C]0.9389[/C][C]0.17578[/C][/ROW]
[ROW][C]10[/C][C]0.127773[/C][C]0.9897[/C][C]0.163141[/C][/ROW]
[ROW][C]11[/C][C]0.182185[/C][C]1.4112[/C][C]0.081675[/C][/ROW]
[ROW][C]12[/C][C]-0.176188[/C][C]-1.3647[/C][C]0.088715[/C][/ROW]
[ROW][C]13[/C][C]-0.580726[/C][C]-4.4983[/C][C]1.6e-05[/C][/ROW]
[ROW][C]14[/C][C]0.069954[/C][C]0.5419[/C][C]0.294961[/C][/ROW]
[ROW][C]15[/C][C]-0.07743[/C][C]-0.5998[/C][C]0.275459[/C][/ROW]
[ROW][C]16[/C][C]-0.04371[/C][C]-0.3386[/C][C]0.368055[/C][/ROW]
[ROW][C]17[/C][C]-0.041441[/C][C]-0.321[/C][C]0.374664[/C][/ROW]
[ROW][C]18[/C][C]0.067468[/C][C]0.5226[/C][C]0.301586[/C][/ROW]
[ROW][C]19[/C][C]0.039657[/C][C]0.3072[/C][C]0.379885[/C][/ROW]
[ROW][C]20[/C][C]-0.183047[/C][C]-1.4179[/C][C]0.0807[/C][/ROW]
[ROW][C]21[/C][C]0.042363[/C][C]0.3281[/C][C]0.371975[/C][/ROW]
[ROW][C]22[/C][C]-0.037162[/C][C]-0.2879[/C][C]0.387225[/C][/ROW]
[ROW][C]23[/C][C]-0.0347[/C][C]-0.2688[/C][C]0.39451[/C][/ROW]
[ROW][C]24[/C][C]0.038706[/C][C]0.2998[/C][C]0.382678[/C][/ROW]
[ROW][C]25[/C][C]0.014875[/C][C]0.1152[/C][C]0.454327[/C][/ROW]
[ROW][C]26[/C][C]-0.041823[/C][C]-0.324[/C][C]0.373548[/C][/ROW]
[ROW][C]27[/C][C]0.068117[/C][C]0.5276[/C][C]0.299851[/C][/ROW]
[ROW][C]28[/C][C]-0.081248[/C][C]-0.6293[/C][C]0.265756[/C][/ROW]
[ROW][C]29[/C][C]0.069718[/C][C]0.54[/C][C]0.295586[/C][/ROW]
[ROW][C]30[/C][C]0.006667[/C][C]0.0516[/C][C]0.479494[/C][/ROW]
[ROW][C]31[/C][C]-0.013203[/C][C]-0.1023[/C][C]0.459441[/C][/ROW]
[ROW][C]32[/C][C]-0.040432[/C][C]-0.3132[/C][C]0.377614[/C][/ROW]
[ROW][C]33[/C][C]-0.009712[/C][C]-0.0752[/C][C]0.470141[/C][/ROW]
[ROW][C]34[/C][C]-0.035897[/C][C]-0.2781[/C][C]0.390962[/C][/ROW]
[ROW][C]35[/C][C]-0.01598[/C][C]-0.1238[/C][C]0.450951[/C][/ROW]
[ROW][C]36[/C][C]0.104838[/C][C]0.8121[/C][C]0.209981[/C][/ROW]
[ROW][C]37[/C][C]-0.039327[/C][C]-0.3046[/C][C]0.380852[/C][/ROW]
[ROW][C]38[/C][C]0.02193[/C][C]0.1699[/C][C]0.432843[/C][/ROW]
[ROW][C]39[/C][C]-0.027579[/C][C]-0.2136[/C][C]0.415782[/C][/ROW]
[ROW][C]40[/C][C]-0.029402[/C][C]-0.2277[/C][C]0.41031[/C][/ROW]
[ROW][C]41[/C][C]-0.135298[/C][C]-1.048[/C][C]0.149417[/C][/ROW]
[ROW][C]42[/C][C]-0.042733[/C][C]-0.331[/C][C]0.370895[/C][/ROW]
[ROW][C]43[/C][C]0.051594[/C][C]0.3996[/C][C]0.34542[/C][/ROW]
[ROW][C]44[/C][C]0.012314[/C][C]0.0954[/C][C]0.462165[/C][/ROW]
[ROW][C]45[/C][C]-0.001267[/C][C]-0.0098[/C][C]0.496102[/C][/ROW]
[ROW][C]46[/C][C]-0.044714[/C][C]-0.3464[/C][C]0.365145[/C][/ROW]
[ROW][C]47[/C][C]0.026374[/C][C]0.2043[/C][C]0.419409[/C][/ROW]
[ROW][C]48[/C][C]-0.08404[/C][C]-0.651[/C][C]0.258775[/C][/ROW]
[ROW][C]49[/C][C]0.136226[/C][C]1.0552[/C][C]0.147781[/C][/ROW]
[ROW][C]50[/C][C]-0.01953[/C][C]-0.1513[/C][C]0.440131[/C][/ROW]
[ROW][C]51[/C][C]-0.008948[/C][C]-0.0693[/C][C]0.472485[/C][/ROW]
[ROW][C]52[/C][C]-0.016053[/C][C]-0.1243[/C][C]0.450728[/C][/ROW]
[ROW][C]53[/C][C]0.017929[/C][C]0.1389[/C][C]0.445007[/C][/ROW]
[ROW][C]54[/C][C]-0.071917[/C][C]-0.5571[/C][C]0.289776[/C][/ROW]
[ROW][C]55[/C][C]-0.057656[/C][C]-0.4466[/C][C]0.328385[/C][/ROW]
[ROW][C]56[/C][C]0.01168[/C][C]0.0905[/C][C]0.464107[/C][/ROW]
[ROW][C]57[/C][C]-0.084217[/C][C]-0.6523[/C][C]0.258337[/C][/ROW]
[ROW][C]58[/C][C]-0.003972[/C][C]-0.0308[/C][C]0.487779[/C][/ROW]
[ROW][C]59[/C][C]-0.05539[/C][C]-0.4291[/C][C]0.334711[/C][/ROW]
[ROW][C]60[/C][C]NA[/C][C]NA[/C][C]NA[/C][/ROW]
[/TABLE]
Source: https://freestatistics.org/blog/index.php?pk=36592&T=2

Globally Unique Identifier (entire table): ba.freestatistics.org/blog/index.php?pk=36592&T=2

As an alternative you can also use a QR Code:  

The GUIDs for individual cells are displayed in the table below:

Partial Autocorrelation Function
Time lag kPACF(k)T-STATP-value
10.8851946.85670
2-0.287031-2.22330.014985
30.1787471.38460.085656
40.1595561.23590.110654
50.114250.8850.189852
6-0.18081-1.40050.08325
7-0.025096-0.19440.423262
80.047730.36970.35645
90.1212080.93890.17578
100.1277730.98970.163141
110.1821851.41120.081675
12-0.176188-1.36470.088715
13-0.580726-4.49831.6e-05
140.0699540.54190.294961
15-0.07743-0.59980.275459
16-0.04371-0.33860.368055
17-0.041441-0.3210.374664
180.0674680.52260.301586
190.0396570.30720.379885
20-0.183047-1.41790.0807
210.0423630.32810.371975
22-0.037162-0.28790.387225
23-0.0347-0.26880.39451
240.0387060.29980.382678
250.0148750.11520.454327
26-0.041823-0.3240.373548
270.0681170.52760.299851
28-0.081248-0.62930.265756
290.0697180.540.295586
300.0066670.05160.479494
31-0.013203-0.10230.459441
32-0.040432-0.31320.377614
33-0.009712-0.07520.470141
34-0.035897-0.27810.390962
35-0.01598-0.12380.450951
360.1048380.81210.209981
37-0.039327-0.30460.380852
380.021930.16990.432843
39-0.027579-0.21360.415782
40-0.029402-0.22770.41031
41-0.135298-1.0480.149417
42-0.042733-0.3310.370895
430.0515940.39960.34542
440.0123140.09540.462165
45-0.001267-0.00980.496102
46-0.044714-0.34640.365145
470.0263740.20430.419409
48-0.08404-0.6510.258775
490.1362261.05520.147781
50-0.01953-0.15130.440131
51-0.008948-0.06930.472485
52-0.016053-0.12430.450728
530.0179290.13890.445007
54-0.071917-0.55710.289776
55-0.057656-0.44660.328385
560.011680.09050.464107
57-0.084217-0.65230.258337
58-0.003972-0.03080.487779
59-0.05539-0.42910.334711
60NANANA


Parameters (Session):
par1 = 60 ; par2 = 1 ; par3 = 0 ; par4 = 0 ; par5 = 12 ;
Parameters (R input):
par1 = 60 ; par2 = 1 ; par3 = 0 ; par4 = 0 ; par5 = 12 ;
R code (references can be found in the software module):
if (par1 == 'Default') {
par1 = 10*log10(length(x))
} else {
par1 <- as.numeric(par1)
}
par2 <- as.numeric(par2)
par3 <- as.numeric(par3)
par4 <- as.numeric(par4)
par5 <- as.numeric(par5)
if (par2 == 0) {
x <- log(x)
} else {
x <- (x ^ par2 - 1) / par2
}
if (par3 > 0) x <- diff(x,lag=1,difference=par3)
if (par4 > 0) x <- diff(x,lag=par5,difference=par4)
bitmap(file='pic1.png')
racf <- acf(x,par1,main='Autocorrelation',xlab='lags',ylab='ACF')
dev.off()
bitmap(file='pic2.png')
rpacf <- pacf(x,par1,main='Partial Autocorrelation',xlab='lags',ylab='PACF')
dev.off()
(myacf <- c(racf$acf))
(mypacf <- c(rpacf$acf))
lengthx <- length(x)
sqrtn <- sqrt(lengthx)
load(file='createtable')
a<-table.start()
a<-table.row.start(a)
a<-table.element(a,'Autocorrelation Function',4,TRUE)
a<-table.row.end(a)
a<-table.row.start(a)
a<-table.element(a,'Time lag k',header=TRUE)
a<-table.element(a,hyperlink('basics.htm','ACF(k)','click here for more information about the Autocorrelation Function'),header=TRUE)
a<-table.element(a,'T-STAT',header=TRUE)
a<-table.element(a,'P-value',header=TRUE)
a<-table.row.end(a)
for (i in 2:(par1+1)) {
a<-table.row.start(a)
a<-table.element(a,i-1,header=TRUE)
a<-table.element(a,round(myacf[i],6))
mytstat <- myacf[i]*sqrtn
a<-table.element(a,round(mytstat,4))
a<-table.element(a,round(1-pt(abs(mytstat),lengthx),6))
a<-table.row.end(a)
}
a<-table.end(a)
table.save(a,file='mytable.tab')
a<-table.start()
a<-table.row.start(a)
a<-table.element(a,'Partial Autocorrelation Function',4,TRUE)
a<-table.row.end(a)
a<-table.row.start(a)
a<-table.element(a,'Time lag k',header=TRUE)
a<-table.element(a,hyperlink('basics.htm','PACF(k)','click here for more information about the Partial Autocorrelation Function'),header=TRUE)
a<-table.element(a,'T-STAT',header=TRUE)
a<-table.element(a,'P-value',header=TRUE)
a<-table.row.end(a)
for (i in 1:par1) {
a<-table.row.start(a)
a<-table.element(a,i,header=TRUE)
a<-table.element(a,round(mypacf[i],6))
mytstat <- mypacf[i]*sqrtn
a<-table.element(a,round(mytstat,4))
a<-table.element(a,round(1-pt(abs(mytstat),lengthx),6))
a<-table.row.end(a)
}
a<-table.end(a)
table.save(a,file='mytable1.tab')