Free Statistics

of Irreproducible Research!

Author's title

Author*Unverified author*
R Software Modulerwasp_multipleregression.wasp
Title produced by softwareMultiple Regression
Date of computationWed, 24 Dec 2008 06:29:11 -0700
Cite this page as followsStatistical Computations at FreeStatistics.org, Office for Research Development and Education, URL https://freestatistics.org/blog/index.php?v=date/2008/Dec/24/t1230125408lhwukil2kbj9q4o.htm/, Retrieved Fri, 17 May 2024 06:38:13 +0000
Statistical Computations at FreeStatistics.org, Office for Research Development and Education, URL https://freestatistics.org/blog/index.php?pk=36559, Retrieved Fri, 17 May 2024 06:38:13 +0000
QR Codes:

Original text written by user:
IsPrivate?No (this computation is public)
User-defined keywords
Estimated Impact156
Family? (F = Feedback message, R = changed R code, M = changed R Module, P = changed Parameters, D = changed Data)
F     [Multiple Regression] [Question1] [2008-11-27 19:48:16] [74be16979710d4c4e7c6647856088456]
-    D  [Multiple Regression] [] [2008-12-24 13:18:29] [f44d2eedff7a2c7a251294ef24b6c872]
-   P       [Multiple Regression] [] [2008-12-24 13:29:11] [00d8a67dacc57b43a0eea87363e750e0] [Current]
Feedback Forum

Post a new message
Dataseries X:
555	0
562	0
561	0
555	0
544	0
537	0
543	0
594	0
611	0
613	0
611	0
594	0
595	0
591	0
589	0
584	0
573	0
567	0
569	0
621	0
629	0
628	0
612	0
595	0
597	0
593	0
590	0
580	0
574	0
573	0
573	0
620	0
626	0
620	0
588	1
566	1
557	1
561	1
549	1
532	1
526	1
511	1
499	1
555	1
565	1
542	1
527	1
510	1
514	1
517	1
508	1
493	1
490	1
469	1
478	1
528	1
534	1
518	1
506	1
502	1


Summary of computational transaction
Raw Inputview raw input (R code)
Raw Outputview raw output of R engine
Computing time3 seconds
R Server'Gwilym Jenkins' @ 72.249.127.135

\begin{tabular}{lllllllll}
\hline
Summary of computational transaction \tabularnewline
Raw Input & view raw input (R code)  \tabularnewline
Raw Output & view raw output of R engine  \tabularnewline
Computing time & 3 seconds \tabularnewline
R Server & 'Gwilym Jenkins' @ 72.249.127.135 \tabularnewline
\hline
\end{tabular}
%Source: https://freestatistics.org/blog/index.php?pk=36559&T=0

[TABLE]
[ROW][C]Summary of computational transaction[/C][/ROW]
[ROW][C]Raw Input[/C][C]view raw input (R code) [/C][/ROW]
[ROW][C]Raw Output[/C][C]view raw output of R engine [/C][/ROW]
[ROW][C]Computing time[/C][C]3 seconds[/C][/ROW]
[ROW][C]R Server[/C][C]'Gwilym Jenkins' @ 72.249.127.135[/C][/ROW]
[/TABLE]
Source: https://freestatistics.org/blog/index.php?pk=36559&T=0

Globally Unique Identifier (entire table): ba.freestatistics.org/blog/index.php?pk=36559&T=0

As an alternative you can also use a QR Code:  

The GUIDs for individual cells are displayed in the table below:

Summary of computational transaction
Raw Inputview raw input (R code)
Raw Outputview raw output of R engine
Computing time3 seconds
R Server'Gwilym Jenkins' @ 72.249.127.135


Multiple Linear Regression - Estimated Regression Equation
Totale_werkloosheid[t] = + 592.016666666667 -64.3611111111111Dummyvariabele[t] -2.67222222222214M1[t] -1.47222222222219M2[t] -6.87222222222217M3[t] -17.4722222222222M4[t] -24.8722222222221M5[t] -34.8722222222222M6[t] -33.8722222222222M7[t] + 17.3277777777778M8[t] + 26.7277777777778M9[t] + 17.9277777777778M10[t] + 15.4M11[t] + e[t]

\begin{tabular}{lllllllll}
\hline
Multiple Linear Regression - Estimated Regression Equation \tabularnewline
Totale_werkloosheid[t] =  +  592.016666666667 -64.3611111111111Dummyvariabele[t] -2.67222222222214M1[t] -1.47222222222219M2[t] -6.87222222222217M3[t] -17.4722222222222M4[t] -24.8722222222221M5[t] -34.8722222222222M6[t] -33.8722222222222M7[t] +  17.3277777777778M8[t] +  26.7277777777778M9[t] +  17.9277777777778M10[t] +  15.4M11[t]  + e[t] \tabularnewline
\hline
\end{tabular}
%Source: https://freestatistics.org/blog/index.php?pk=36559&T=1

[TABLE]
[ROW][C]Multiple Linear Regression - Estimated Regression Equation[/C][/ROW]
[ROW][C]Totale_werkloosheid[t] =  +  592.016666666667 -64.3611111111111Dummyvariabele[t] -2.67222222222214M1[t] -1.47222222222219M2[t] -6.87222222222217M3[t] -17.4722222222222M4[t] -24.8722222222221M5[t] -34.8722222222222M6[t] -33.8722222222222M7[t] +  17.3277777777778M8[t] +  26.7277777777778M9[t] +  17.9277777777778M10[t] +  15.4M11[t]  + e[t][/C][/ROW]
[/TABLE]
Source: https://freestatistics.org/blog/index.php?pk=36559&T=1

Globally Unique Identifier (entire table): ba.freestatistics.org/blog/index.php?pk=36559&T=1

As an alternative you can also use a QR Code:  

The GUIDs for individual cells are displayed in the table below:

Multiple Linear Regression - Estimated Regression Equation
Totale_werkloosheid[t] = + 592.016666666667 -64.3611111111111Dummyvariabele[t] -2.67222222222214M1[t] -1.47222222222219M2[t] -6.87222222222217M3[t] -17.4722222222222M4[t] -24.8722222222221M5[t] -34.8722222222222M6[t] -33.8722222222222M7[t] + 17.3277777777778M8[t] + 26.7277777777778M9[t] + 17.9277777777778M10[t] + 15.4M11[t] + e[t]


Multiple Linear Regression - Ordinary Least Squares
VariableParameterS.D.T-STATH0: parameter = 02-tail p-value1-tail p-value
(Intercept)592.0166666666679.82635160.247900
Dummyvariabele-64.36111111111115.459084-11.789700
M1-2.6722222222221413.147215-0.20330.8398140.419907
M2-1.4722222222221913.147215-0.1120.9113160.455658
M3-6.8722222222221713.147215-0.52270.6036290.301815
M4-17.472222222222213.147215-1.3290.1902750.095137
M5-24.872222222222113.147215-1.89180.0646850.032342
M6-34.872222222222213.147215-2.65240.0108630.005431
M7-33.872222222222213.147215-2.57640.0131860.006593
M817.327777777777813.1472151.3180.1938980.096949
M926.727777777777813.1472152.0330.0477260.023863
M1017.927777777777813.1472151.36360.1791840.089592
M1115.413.1018021.17540.2457510.122875

\begin{tabular}{lllllllll}
\hline
Multiple Linear Regression - Ordinary Least Squares \tabularnewline
Variable & Parameter & S.D. & T-STATH0: parameter = 0 & 2-tail p-value & 1-tail p-value \tabularnewline
(Intercept) & 592.016666666667 & 9.826351 & 60.2479 & 0 & 0 \tabularnewline
Dummyvariabele & -64.3611111111111 & 5.459084 & -11.7897 & 0 & 0 \tabularnewline
M1 & -2.67222222222214 & 13.147215 & -0.2033 & 0.839814 & 0.419907 \tabularnewline
M2 & -1.47222222222219 & 13.147215 & -0.112 & 0.911316 & 0.455658 \tabularnewline
M3 & -6.87222222222217 & 13.147215 & -0.5227 & 0.603629 & 0.301815 \tabularnewline
M4 & -17.4722222222222 & 13.147215 & -1.329 & 0.190275 & 0.095137 \tabularnewline
M5 & -24.8722222222221 & 13.147215 & -1.8918 & 0.064685 & 0.032342 \tabularnewline
M6 & -34.8722222222222 & 13.147215 & -2.6524 & 0.010863 & 0.005431 \tabularnewline
M7 & -33.8722222222222 & 13.147215 & -2.5764 & 0.013186 & 0.006593 \tabularnewline
M8 & 17.3277777777778 & 13.147215 & 1.318 & 0.193898 & 0.096949 \tabularnewline
M9 & 26.7277777777778 & 13.147215 & 2.033 & 0.047726 & 0.023863 \tabularnewline
M10 & 17.9277777777778 & 13.147215 & 1.3636 & 0.179184 & 0.089592 \tabularnewline
M11 & 15.4 & 13.101802 & 1.1754 & 0.245751 & 0.122875 \tabularnewline
\hline
\end{tabular}
%Source: https://freestatistics.org/blog/index.php?pk=36559&T=2

[TABLE]
[ROW][C]Multiple Linear Regression - Ordinary Least Squares[/C][/ROW]
[ROW][C]Variable[/C][C]Parameter[/C][C]S.D.[/C][C]T-STATH0: parameter = 0[/C][C]2-tail p-value[/C][C]1-tail p-value[/C][/ROW]
[ROW][C](Intercept)[/C][C]592.016666666667[/C][C]9.826351[/C][C]60.2479[/C][C]0[/C][C]0[/C][/ROW]
[ROW][C]Dummyvariabele[/C][C]-64.3611111111111[/C][C]5.459084[/C][C]-11.7897[/C][C]0[/C][C]0[/C][/ROW]
[ROW][C]M1[/C][C]-2.67222222222214[/C][C]13.147215[/C][C]-0.2033[/C][C]0.839814[/C][C]0.419907[/C][/ROW]
[ROW][C]M2[/C][C]-1.47222222222219[/C][C]13.147215[/C][C]-0.112[/C][C]0.911316[/C][C]0.455658[/C][/ROW]
[ROW][C]M3[/C][C]-6.87222222222217[/C][C]13.147215[/C][C]-0.5227[/C][C]0.603629[/C][C]0.301815[/C][/ROW]
[ROW][C]M4[/C][C]-17.4722222222222[/C][C]13.147215[/C][C]-1.329[/C][C]0.190275[/C][C]0.095137[/C][/ROW]
[ROW][C]M5[/C][C]-24.8722222222221[/C][C]13.147215[/C][C]-1.8918[/C][C]0.064685[/C][C]0.032342[/C][/ROW]
[ROW][C]M6[/C][C]-34.8722222222222[/C][C]13.147215[/C][C]-2.6524[/C][C]0.010863[/C][C]0.005431[/C][/ROW]
[ROW][C]M7[/C][C]-33.8722222222222[/C][C]13.147215[/C][C]-2.5764[/C][C]0.013186[/C][C]0.006593[/C][/ROW]
[ROW][C]M8[/C][C]17.3277777777778[/C][C]13.147215[/C][C]1.318[/C][C]0.193898[/C][C]0.096949[/C][/ROW]
[ROW][C]M9[/C][C]26.7277777777778[/C][C]13.147215[/C][C]2.033[/C][C]0.047726[/C][C]0.023863[/C][/ROW]
[ROW][C]M10[/C][C]17.9277777777778[/C][C]13.147215[/C][C]1.3636[/C][C]0.179184[/C][C]0.089592[/C][/ROW]
[ROW][C]M11[/C][C]15.4[/C][C]13.101802[/C][C]1.1754[/C][C]0.245751[/C][C]0.122875[/C][/ROW]
[/TABLE]
Source: https://freestatistics.org/blog/index.php?pk=36559&T=2

Globally Unique Identifier (entire table): ba.freestatistics.org/blog/index.php?pk=36559&T=2

As an alternative you can also use a QR Code:  

The GUIDs for individual cells are displayed in the table below:

Multiple Linear Regression - Ordinary Least Squares
VariableParameterS.D.T-STATH0: parameter = 02-tail p-value1-tail p-value
(Intercept)592.0166666666679.82635160.247900
Dummyvariabele-64.36111111111115.459084-11.789700
M1-2.6722222222221413.147215-0.20330.8398140.419907
M2-1.4722222222221913.147215-0.1120.9113160.455658
M3-6.8722222222221713.147215-0.52270.6036290.301815
M4-17.472222222222213.147215-1.3290.1902750.095137
M5-24.872222222222113.147215-1.89180.0646850.032342
M6-34.872222222222213.147215-2.65240.0108630.005431
M7-33.872222222222213.147215-2.57640.0131860.006593
M817.327777777777813.1472151.3180.1938980.096949
M926.727777777777813.1472152.0330.0477260.023863
M1017.927777777777813.1472151.36360.1791840.089592
M1115.413.1018021.17540.2457510.122875


Multiple Linear Regression - Regression Statistics
Multiple R0.89569960655592
R-squared0.80227778518443
Adjusted R-squared0.751795517571944
F-TEST (value)15.8922691695014
F-TEST (DF numerator)12
F-TEST (DF denominator)47
p-value1.08402176124400e-12
Multiple Linear Regression - Residual Statistics
Residual Standard Deviation20.7157675697698
Sum Squared Residuals20169.7222222222

\begin{tabular}{lllllllll}
\hline
Multiple Linear Regression - Regression Statistics \tabularnewline
Multiple R & 0.89569960655592 \tabularnewline
R-squared & 0.80227778518443 \tabularnewline
Adjusted R-squared & 0.751795517571944 \tabularnewline
F-TEST (value) & 15.8922691695014 \tabularnewline
F-TEST (DF numerator) & 12 \tabularnewline
F-TEST (DF denominator) & 47 \tabularnewline
p-value & 1.08402176124400e-12 \tabularnewline
Multiple Linear Regression - Residual Statistics \tabularnewline
Residual Standard Deviation & 20.7157675697698 \tabularnewline
Sum Squared Residuals & 20169.7222222222 \tabularnewline
\hline
\end{tabular}
%Source: https://freestatistics.org/blog/index.php?pk=36559&T=3

[TABLE]
[ROW][C]Multiple Linear Regression - Regression Statistics[/C][/ROW]
[ROW][C]Multiple R[/C][C]0.89569960655592[/C][/ROW]
[ROW][C]R-squared[/C][C]0.80227778518443[/C][/ROW]
[ROW][C]Adjusted R-squared[/C][C]0.751795517571944[/C][/ROW]
[ROW][C]F-TEST (value)[/C][C]15.8922691695014[/C][/ROW]
[ROW][C]F-TEST (DF numerator)[/C][C]12[/C][/ROW]
[ROW][C]F-TEST (DF denominator)[/C][C]47[/C][/ROW]
[ROW][C]p-value[/C][C]1.08402176124400e-12[/C][/ROW]
[ROW][C]Multiple Linear Regression - Residual Statistics[/C][/ROW]
[ROW][C]Residual Standard Deviation[/C][C]20.7157675697698[/C][/ROW]
[ROW][C]Sum Squared Residuals[/C][C]20169.7222222222[/C][/ROW]
[/TABLE]
Source: https://freestatistics.org/blog/index.php?pk=36559&T=3

Globally Unique Identifier (entire table): ba.freestatistics.org/blog/index.php?pk=36559&T=3

As an alternative you can also use a QR Code:  

The GUIDs for individual cells are displayed in the table below:

Multiple Linear Regression - Regression Statistics
Multiple R0.89569960655592
R-squared0.80227778518443
Adjusted R-squared0.751795517571944
F-TEST (value)15.8922691695014
F-TEST (DF numerator)12
F-TEST (DF denominator)47
p-value1.08402176124400e-12
Multiple Linear Regression - Residual Statistics
Residual Standard Deviation20.7157675697698
Sum Squared Residuals20169.7222222222


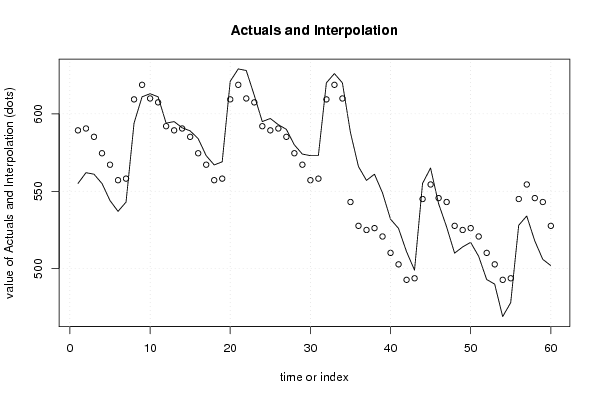
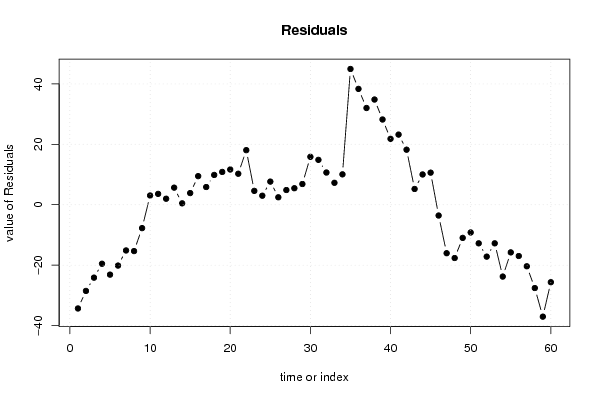
Multiple Linear Regression - Actuals, Interpolation, and Residuals
Time or IndexActualsInterpolationForecastResidualsPrediction Error
1555589.344444444444-34.3444444444442
2562590.544444444444-28.5444444444445
3561585.144444444444-24.1444444444444
4555574.544444444444-19.5444444444445
5544567.144444444445-23.1444444444445
6537557.144444444444-20.1444444444444
7543558.144444444445-15.1444444444445
8594609.344444444444-15.3444444444444
9611618.744444444444-7.74444444444445
10613609.9444444444443.05555555555555
11611607.4166666666673.58333333333333
12594592.0166666666671.98333333333337
13595589.3444444444455.65555555555548
14591590.5444444444440.455555555555553
15589585.1444444444453.85555555555554
16584574.5444444444449.45555555555556
17573567.1444444444455.85555555555555
18567557.1444444444459.85555555555555
19569558.14444444444410.8555555555556
20621609.34444444444411.6555555555556
21629618.74444444444410.2555555555556
22628609.94444444444418.0555555555556
23612607.4166666666674.58333333333333
24595592.0166666666672.98333333333336
25597589.3444444444457.6555555555555
26593590.5444444444442.45555555555555
27590585.1444444444454.85555555555554
28580574.5444444444445.45555555555556
29574567.1444444444446.85555555555555
30573557.14444444444415.8555555555556
31573558.14444444444414.8555555555556
32620609.34444444444410.6555555555556
33626618.7444444444447.25555555555556
34620609.94444444444410.0555555555556
35588543.05555555555644.9444444444444
36566527.65555555555638.3444444444445
37557524.98333333333332.0166666666666
38561526.18333333333334.8166666666667
39549520.78333333333328.2166666666667
40532510.18333333333321.8166666666667
41526502.78333333333323.2166666666667
42511492.78333333333318.2166666666667
43499493.7833333333335.21666666666669
44555544.98333333333310.0166666666667
45565554.38333333333310.6166666666667
46542545.583333333333-3.58333333333333
47527543.055555555556-16.0555555555556
48510527.655555555556-17.6555555555555
49514524.983333333333-10.9833333333334
50517526.183333333333-9.18333333333334
51508520.783333333333-12.7833333333333
52493510.183333333333-17.1833333333333
53490502.783333333333-12.7833333333333
54469492.783333333333-23.7833333333333
55478493.783333333333-15.7833333333333
56528544.983333333333-16.9833333333333
57534554.383333333333-20.3833333333333
58518545.583333333333-27.5833333333333
59506543.055555555556-37.0555555555556
60502527.655555555556-25.6555555555555

\begin{tabular}{lllllllll}
\hline
Multiple Linear Regression - Actuals, Interpolation, and Residuals \tabularnewline
Time or Index & Actuals & InterpolationForecast & ResidualsPrediction Error \tabularnewline
1 & 555 & 589.344444444444 & -34.3444444444442 \tabularnewline
2 & 562 & 590.544444444444 & -28.5444444444445 \tabularnewline
3 & 561 & 585.144444444444 & -24.1444444444444 \tabularnewline
4 & 555 & 574.544444444444 & -19.5444444444445 \tabularnewline
5 & 544 & 567.144444444445 & -23.1444444444445 \tabularnewline
6 & 537 & 557.144444444444 & -20.1444444444444 \tabularnewline
7 & 543 & 558.144444444445 & -15.1444444444445 \tabularnewline
8 & 594 & 609.344444444444 & -15.3444444444444 \tabularnewline
9 & 611 & 618.744444444444 & -7.74444444444445 \tabularnewline
10 & 613 & 609.944444444444 & 3.05555555555555 \tabularnewline
11 & 611 & 607.416666666667 & 3.58333333333333 \tabularnewline
12 & 594 & 592.016666666667 & 1.98333333333337 \tabularnewline
13 & 595 & 589.344444444445 & 5.65555555555548 \tabularnewline
14 & 591 & 590.544444444444 & 0.455555555555553 \tabularnewline
15 & 589 & 585.144444444445 & 3.85555555555554 \tabularnewline
16 & 584 & 574.544444444444 & 9.45555555555556 \tabularnewline
17 & 573 & 567.144444444445 & 5.85555555555555 \tabularnewline
18 & 567 & 557.144444444445 & 9.85555555555555 \tabularnewline
19 & 569 & 558.144444444444 & 10.8555555555556 \tabularnewline
20 & 621 & 609.344444444444 & 11.6555555555556 \tabularnewline
21 & 629 & 618.744444444444 & 10.2555555555556 \tabularnewline
22 & 628 & 609.944444444444 & 18.0555555555556 \tabularnewline
23 & 612 & 607.416666666667 & 4.58333333333333 \tabularnewline
24 & 595 & 592.016666666667 & 2.98333333333336 \tabularnewline
25 & 597 & 589.344444444445 & 7.6555555555555 \tabularnewline
26 & 593 & 590.544444444444 & 2.45555555555555 \tabularnewline
27 & 590 & 585.144444444445 & 4.85555555555554 \tabularnewline
28 & 580 & 574.544444444444 & 5.45555555555556 \tabularnewline
29 & 574 & 567.144444444444 & 6.85555555555555 \tabularnewline
30 & 573 & 557.144444444444 & 15.8555555555556 \tabularnewline
31 & 573 & 558.144444444444 & 14.8555555555556 \tabularnewline
32 & 620 & 609.344444444444 & 10.6555555555556 \tabularnewline
33 & 626 & 618.744444444444 & 7.25555555555556 \tabularnewline
34 & 620 & 609.944444444444 & 10.0555555555556 \tabularnewline
35 & 588 & 543.055555555556 & 44.9444444444444 \tabularnewline
36 & 566 & 527.655555555556 & 38.3444444444445 \tabularnewline
37 & 557 & 524.983333333333 & 32.0166666666666 \tabularnewline
38 & 561 & 526.183333333333 & 34.8166666666667 \tabularnewline
39 & 549 & 520.783333333333 & 28.2166666666667 \tabularnewline
40 & 532 & 510.183333333333 & 21.8166666666667 \tabularnewline
41 & 526 & 502.783333333333 & 23.2166666666667 \tabularnewline
42 & 511 & 492.783333333333 & 18.2166666666667 \tabularnewline
43 & 499 & 493.783333333333 & 5.21666666666669 \tabularnewline
44 & 555 & 544.983333333333 & 10.0166666666667 \tabularnewline
45 & 565 & 554.383333333333 & 10.6166666666667 \tabularnewline
46 & 542 & 545.583333333333 & -3.58333333333333 \tabularnewline
47 & 527 & 543.055555555556 & -16.0555555555556 \tabularnewline
48 & 510 & 527.655555555556 & -17.6555555555555 \tabularnewline
49 & 514 & 524.983333333333 & -10.9833333333334 \tabularnewline
50 & 517 & 526.183333333333 & -9.18333333333334 \tabularnewline
51 & 508 & 520.783333333333 & -12.7833333333333 \tabularnewline
52 & 493 & 510.183333333333 & -17.1833333333333 \tabularnewline
53 & 490 & 502.783333333333 & -12.7833333333333 \tabularnewline
54 & 469 & 492.783333333333 & -23.7833333333333 \tabularnewline
55 & 478 & 493.783333333333 & -15.7833333333333 \tabularnewline
56 & 528 & 544.983333333333 & -16.9833333333333 \tabularnewline
57 & 534 & 554.383333333333 & -20.3833333333333 \tabularnewline
58 & 518 & 545.583333333333 & -27.5833333333333 \tabularnewline
59 & 506 & 543.055555555556 & -37.0555555555556 \tabularnewline
60 & 502 & 527.655555555556 & -25.6555555555555 \tabularnewline
\hline
\end{tabular}
%Source: https://freestatistics.org/blog/index.php?pk=36559&T=4

[TABLE]
[ROW][C]Multiple Linear Regression - Actuals, Interpolation, and Residuals[/C][/ROW]
[ROW][C]Time or Index[/C][C]Actuals[/C][C]InterpolationForecast[/C][C]ResidualsPrediction Error[/C][/ROW]
[ROW][C]1[/C][C]555[/C][C]589.344444444444[/C][C]-34.3444444444442[/C][/ROW]
[ROW][C]2[/C][C]562[/C][C]590.544444444444[/C][C]-28.5444444444445[/C][/ROW]
[ROW][C]3[/C][C]561[/C][C]585.144444444444[/C][C]-24.1444444444444[/C][/ROW]
[ROW][C]4[/C][C]555[/C][C]574.544444444444[/C][C]-19.5444444444445[/C][/ROW]
[ROW][C]5[/C][C]544[/C][C]567.144444444445[/C][C]-23.1444444444445[/C][/ROW]
[ROW][C]6[/C][C]537[/C][C]557.144444444444[/C][C]-20.1444444444444[/C][/ROW]
[ROW][C]7[/C][C]543[/C][C]558.144444444445[/C][C]-15.1444444444445[/C][/ROW]
[ROW][C]8[/C][C]594[/C][C]609.344444444444[/C][C]-15.3444444444444[/C][/ROW]
[ROW][C]9[/C][C]611[/C][C]618.744444444444[/C][C]-7.74444444444445[/C][/ROW]
[ROW][C]10[/C][C]613[/C][C]609.944444444444[/C][C]3.05555555555555[/C][/ROW]
[ROW][C]11[/C][C]611[/C][C]607.416666666667[/C][C]3.58333333333333[/C][/ROW]
[ROW][C]12[/C][C]594[/C][C]592.016666666667[/C][C]1.98333333333337[/C][/ROW]
[ROW][C]13[/C][C]595[/C][C]589.344444444445[/C][C]5.65555555555548[/C][/ROW]
[ROW][C]14[/C][C]591[/C][C]590.544444444444[/C][C]0.455555555555553[/C][/ROW]
[ROW][C]15[/C][C]589[/C][C]585.144444444445[/C][C]3.85555555555554[/C][/ROW]
[ROW][C]16[/C][C]584[/C][C]574.544444444444[/C][C]9.45555555555556[/C][/ROW]
[ROW][C]17[/C][C]573[/C][C]567.144444444445[/C][C]5.85555555555555[/C][/ROW]
[ROW][C]18[/C][C]567[/C][C]557.144444444445[/C][C]9.85555555555555[/C][/ROW]
[ROW][C]19[/C][C]569[/C][C]558.144444444444[/C][C]10.8555555555556[/C][/ROW]
[ROW][C]20[/C][C]621[/C][C]609.344444444444[/C][C]11.6555555555556[/C][/ROW]
[ROW][C]21[/C][C]629[/C][C]618.744444444444[/C][C]10.2555555555556[/C][/ROW]
[ROW][C]22[/C][C]628[/C][C]609.944444444444[/C][C]18.0555555555556[/C][/ROW]
[ROW][C]23[/C][C]612[/C][C]607.416666666667[/C][C]4.58333333333333[/C][/ROW]
[ROW][C]24[/C][C]595[/C][C]592.016666666667[/C][C]2.98333333333336[/C][/ROW]
[ROW][C]25[/C][C]597[/C][C]589.344444444445[/C][C]7.6555555555555[/C][/ROW]
[ROW][C]26[/C][C]593[/C][C]590.544444444444[/C][C]2.45555555555555[/C][/ROW]
[ROW][C]27[/C][C]590[/C][C]585.144444444445[/C][C]4.85555555555554[/C][/ROW]
[ROW][C]28[/C][C]580[/C][C]574.544444444444[/C][C]5.45555555555556[/C][/ROW]
[ROW][C]29[/C][C]574[/C][C]567.144444444444[/C][C]6.85555555555555[/C][/ROW]
[ROW][C]30[/C][C]573[/C][C]557.144444444444[/C][C]15.8555555555556[/C][/ROW]
[ROW][C]31[/C][C]573[/C][C]558.144444444444[/C][C]14.8555555555556[/C][/ROW]
[ROW][C]32[/C][C]620[/C][C]609.344444444444[/C][C]10.6555555555556[/C][/ROW]
[ROW][C]33[/C][C]626[/C][C]618.744444444444[/C][C]7.25555555555556[/C][/ROW]
[ROW][C]34[/C][C]620[/C][C]609.944444444444[/C][C]10.0555555555556[/C][/ROW]
[ROW][C]35[/C][C]588[/C][C]543.055555555556[/C][C]44.9444444444444[/C][/ROW]
[ROW][C]36[/C][C]566[/C][C]527.655555555556[/C][C]38.3444444444445[/C][/ROW]
[ROW][C]37[/C][C]557[/C][C]524.983333333333[/C][C]32.0166666666666[/C][/ROW]
[ROW][C]38[/C][C]561[/C][C]526.183333333333[/C][C]34.8166666666667[/C][/ROW]
[ROW][C]39[/C][C]549[/C][C]520.783333333333[/C][C]28.2166666666667[/C][/ROW]
[ROW][C]40[/C][C]532[/C][C]510.183333333333[/C][C]21.8166666666667[/C][/ROW]
[ROW][C]41[/C][C]526[/C][C]502.783333333333[/C][C]23.2166666666667[/C][/ROW]
[ROW][C]42[/C][C]511[/C][C]492.783333333333[/C][C]18.2166666666667[/C][/ROW]
[ROW][C]43[/C][C]499[/C][C]493.783333333333[/C][C]5.21666666666669[/C][/ROW]
[ROW][C]44[/C][C]555[/C][C]544.983333333333[/C][C]10.0166666666667[/C][/ROW]
[ROW][C]45[/C][C]565[/C][C]554.383333333333[/C][C]10.6166666666667[/C][/ROW]
[ROW][C]46[/C][C]542[/C][C]545.583333333333[/C][C]-3.58333333333333[/C][/ROW]
[ROW][C]47[/C][C]527[/C][C]543.055555555556[/C][C]-16.0555555555556[/C][/ROW]
[ROW][C]48[/C][C]510[/C][C]527.655555555556[/C][C]-17.6555555555555[/C][/ROW]
[ROW][C]49[/C][C]514[/C][C]524.983333333333[/C][C]-10.9833333333334[/C][/ROW]
[ROW][C]50[/C][C]517[/C][C]526.183333333333[/C][C]-9.18333333333334[/C][/ROW]
[ROW][C]51[/C][C]508[/C][C]520.783333333333[/C][C]-12.7833333333333[/C][/ROW]
[ROW][C]52[/C][C]493[/C][C]510.183333333333[/C][C]-17.1833333333333[/C][/ROW]
[ROW][C]53[/C][C]490[/C][C]502.783333333333[/C][C]-12.7833333333333[/C][/ROW]
[ROW][C]54[/C][C]469[/C][C]492.783333333333[/C][C]-23.7833333333333[/C][/ROW]
[ROW][C]55[/C][C]478[/C][C]493.783333333333[/C][C]-15.7833333333333[/C][/ROW]
[ROW][C]56[/C][C]528[/C][C]544.983333333333[/C][C]-16.9833333333333[/C][/ROW]
[ROW][C]57[/C][C]534[/C][C]554.383333333333[/C][C]-20.3833333333333[/C][/ROW]
[ROW][C]58[/C][C]518[/C][C]545.583333333333[/C][C]-27.5833333333333[/C][/ROW]
[ROW][C]59[/C][C]506[/C][C]543.055555555556[/C][C]-37.0555555555556[/C][/ROW]
[ROW][C]60[/C][C]502[/C][C]527.655555555556[/C][C]-25.6555555555555[/C][/ROW]
[/TABLE]
Source: https://freestatistics.org/blog/index.php?pk=36559&T=4

Globally Unique Identifier (entire table): ba.freestatistics.org/blog/index.php?pk=36559&T=4

As an alternative you can also use a QR Code:  

The GUIDs for individual cells are displayed in the table below:

Multiple Linear Regression - Actuals, Interpolation, and Residuals
Time or IndexActualsInterpolationForecastResidualsPrediction Error
1555589.344444444444-34.3444444444442
2562590.544444444444-28.5444444444445
3561585.144444444444-24.1444444444444
4555574.544444444444-19.5444444444445
5544567.144444444445-23.1444444444445
6537557.144444444444-20.1444444444444
7543558.144444444445-15.1444444444445
8594609.344444444444-15.3444444444444
9611618.744444444444-7.74444444444445
10613609.9444444444443.05555555555555
11611607.4166666666673.58333333333333
12594592.0166666666671.98333333333337
13595589.3444444444455.65555555555548
14591590.5444444444440.455555555555553
15589585.1444444444453.85555555555554
16584574.5444444444449.45555555555556
17573567.1444444444455.85555555555555
18567557.1444444444459.85555555555555
19569558.14444444444410.8555555555556
20621609.34444444444411.6555555555556
21629618.74444444444410.2555555555556
22628609.94444444444418.0555555555556
23612607.4166666666674.58333333333333
24595592.0166666666672.98333333333336
25597589.3444444444457.6555555555555
26593590.5444444444442.45555555555555
27590585.1444444444454.85555555555554
28580574.5444444444445.45555555555556
29574567.1444444444446.85555555555555
30573557.14444444444415.8555555555556
31573558.14444444444414.8555555555556
32620609.34444444444410.6555555555556
33626618.7444444444447.25555555555556
34620609.94444444444410.0555555555556
35588543.05555555555644.9444444444444
36566527.65555555555638.3444444444445
37557524.98333333333332.0166666666666
38561526.18333333333334.8166666666667
39549520.78333333333328.2166666666667
40532510.18333333333321.8166666666667
41526502.78333333333323.2166666666667
42511492.78333333333318.2166666666667
43499493.7833333333335.21666666666669
44555544.98333333333310.0166666666667
45565554.38333333333310.6166666666667
46542545.583333333333-3.58333333333333
47527543.055555555556-16.0555555555556
48510527.655555555556-17.6555555555555
49514524.983333333333-10.9833333333334
50517526.183333333333-9.18333333333334
51508520.783333333333-12.7833333333333
52493510.183333333333-17.1833333333333
53490502.783333333333-12.7833333333333
54469492.783333333333-23.7833333333333
55478493.783333333333-15.7833333333333
56528544.983333333333-16.9833333333333
57534554.383333333333-20.3833333333333
58518545.583333333333-27.5833333333333
59506543.055555555556-37.0555555555556
60502527.655555555556-25.6555555555555


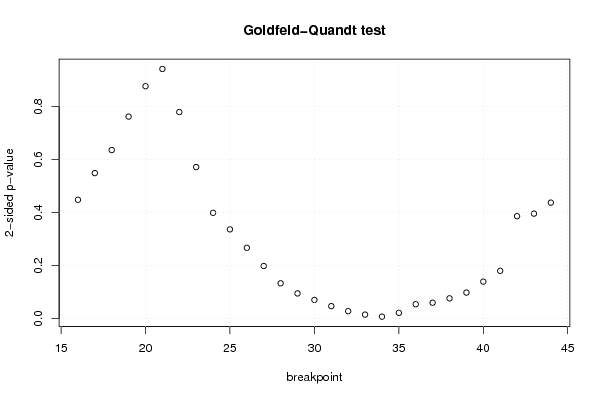
Goldfeld-Quandt test for Heteroskedasticity
p-valuesAlternative Hypothesis
breakpoint indexgreater2-sidedless
160.7760751296362420.4478497407275170.223924870363758
170.7258073406476540.5483853187046930.274192659352346
180.6823707581469920.6352584837060160.317629241853008
190.6192217481061340.7615565037877310.380778251893866
200.5620062834802170.8759874330395660.437993716519783
210.4705541014265910.9411082028531810.529445898573409
220.3893355994644010.7786711989288020.610664400535599
230.2855885263453710.5711770526907420.71441147365463
240.1993610595311740.3987221190623480.800638940468826
250.1682154340582650.3364308681165290.831784565941735
260.1334470761240720.2668941522481450.866552923875928
270.09912642569700060.1982528513940010.900873574303
280.06653552806883480.1330710561376700.933464471931165
290.04745830538297230.09491661076594450.952541694617028
300.03527582886411350.0705516577282270.964724171135886
310.02345485109235760.04690970218471510.976545148907642
320.01396340961486390.02792681922972780.986036590385136
330.007529885032580680.01505977006516140.99247011496742
340.00365650029440220.00731300058880440.996343499705598
350.01083033153351950.0216606630670390.98916966846648
360.02710310295372850.0542062059074570.972896897046271
370.02991488098888960.05982976197777920.97008511901111
380.03819001047804810.07638002095609620.961809989521952
390.0490284261737130.0980568523474260.950971573826287
400.06969841256968490.1393968251393700.930301587430315
410.09005005368029280.1801001073605860.909949946319707
420.1930083563874870.3860167127749740.806991643612513
430.1978666523369220.3957333046738440.802133347663078
440.2185731669722280.4371463339444560.781426833027772

\begin{tabular}{lllllllll}
\hline
Goldfeld-Quandt test for Heteroskedasticity \tabularnewline
p-values & Alternative Hypothesis \tabularnewline
breakpoint index & greater & 2-sided & less \tabularnewline
16 & 0.776075129636242 & 0.447849740727517 & 0.223924870363758 \tabularnewline
17 & 0.725807340647654 & 0.548385318704693 & 0.274192659352346 \tabularnewline
18 & 0.682370758146992 & 0.635258483706016 & 0.317629241853008 \tabularnewline
19 & 0.619221748106134 & 0.761556503787731 & 0.380778251893866 \tabularnewline
20 & 0.562006283480217 & 0.875987433039566 & 0.437993716519783 \tabularnewline
21 & 0.470554101426591 & 0.941108202853181 & 0.529445898573409 \tabularnewline
22 & 0.389335599464401 & 0.778671198928802 & 0.610664400535599 \tabularnewline
23 & 0.285588526345371 & 0.571177052690742 & 0.71441147365463 \tabularnewline
24 & 0.199361059531174 & 0.398722119062348 & 0.800638940468826 \tabularnewline
25 & 0.168215434058265 & 0.336430868116529 & 0.831784565941735 \tabularnewline
26 & 0.133447076124072 & 0.266894152248145 & 0.866552923875928 \tabularnewline
27 & 0.0991264256970006 & 0.198252851394001 & 0.900873574303 \tabularnewline
28 & 0.0665355280688348 & 0.133071056137670 & 0.933464471931165 \tabularnewline
29 & 0.0474583053829723 & 0.0949166107659445 & 0.952541694617028 \tabularnewline
30 & 0.0352758288641135 & 0.070551657728227 & 0.964724171135886 \tabularnewline
31 & 0.0234548510923576 & 0.0469097021847151 & 0.976545148907642 \tabularnewline
32 & 0.0139634096148639 & 0.0279268192297278 & 0.986036590385136 \tabularnewline
33 & 0.00752988503258068 & 0.0150597700651614 & 0.99247011496742 \tabularnewline
34 & 0.0036565002944022 & 0.0073130005888044 & 0.996343499705598 \tabularnewline
35 & 0.0108303315335195 & 0.021660663067039 & 0.98916966846648 \tabularnewline
36 & 0.0271031029537285 & 0.054206205907457 & 0.972896897046271 \tabularnewline
37 & 0.0299148809888896 & 0.0598297619777792 & 0.97008511901111 \tabularnewline
38 & 0.0381900104780481 & 0.0763800209560962 & 0.961809989521952 \tabularnewline
39 & 0.049028426173713 & 0.098056852347426 & 0.950971573826287 \tabularnewline
40 & 0.0696984125696849 & 0.139396825139370 & 0.930301587430315 \tabularnewline
41 & 0.0900500536802928 & 0.180100107360586 & 0.909949946319707 \tabularnewline
42 & 0.193008356387487 & 0.386016712774974 & 0.806991643612513 \tabularnewline
43 & 0.197866652336922 & 0.395733304673844 & 0.802133347663078 \tabularnewline
44 & 0.218573166972228 & 0.437146333944456 & 0.781426833027772 \tabularnewline
\hline
\end{tabular}
%Source: https://freestatistics.org/blog/index.php?pk=36559&T=5

[TABLE]
[ROW][C]Goldfeld-Quandt test for Heteroskedasticity[/C][/ROW]
[ROW][C]p-values[/C][C]Alternative Hypothesis[/C][/ROW]
[ROW][C]breakpoint index[/C][C]greater[/C][C]2-sided[/C][C]less[/C][/ROW]
[ROW][C]16[/C][C]0.776075129636242[/C][C]0.447849740727517[/C][C]0.223924870363758[/C][/ROW]
[ROW][C]17[/C][C]0.725807340647654[/C][C]0.548385318704693[/C][C]0.274192659352346[/C][/ROW]
[ROW][C]18[/C][C]0.682370758146992[/C][C]0.635258483706016[/C][C]0.317629241853008[/C][/ROW]
[ROW][C]19[/C][C]0.619221748106134[/C][C]0.761556503787731[/C][C]0.380778251893866[/C][/ROW]
[ROW][C]20[/C][C]0.562006283480217[/C][C]0.875987433039566[/C][C]0.437993716519783[/C][/ROW]
[ROW][C]21[/C][C]0.470554101426591[/C][C]0.941108202853181[/C][C]0.529445898573409[/C][/ROW]
[ROW][C]22[/C][C]0.389335599464401[/C][C]0.778671198928802[/C][C]0.610664400535599[/C][/ROW]
[ROW][C]23[/C][C]0.285588526345371[/C][C]0.571177052690742[/C][C]0.71441147365463[/C][/ROW]
[ROW][C]24[/C][C]0.199361059531174[/C][C]0.398722119062348[/C][C]0.800638940468826[/C][/ROW]
[ROW][C]25[/C][C]0.168215434058265[/C][C]0.336430868116529[/C][C]0.831784565941735[/C][/ROW]
[ROW][C]26[/C][C]0.133447076124072[/C][C]0.266894152248145[/C][C]0.866552923875928[/C][/ROW]
[ROW][C]27[/C][C]0.0991264256970006[/C][C]0.198252851394001[/C][C]0.900873574303[/C][/ROW]
[ROW][C]28[/C][C]0.0665355280688348[/C][C]0.133071056137670[/C][C]0.933464471931165[/C][/ROW]
[ROW][C]29[/C][C]0.0474583053829723[/C][C]0.0949166107659445[/C][C]0.952541694617028[/C][/ROW]
[ROW][C]30[/C][C]0.0352758288641135[/C][C]0.070551657728227[/C][C]0.964724171135886[/C][/ROW]
[ROW][C]31[/C][C]0.0234548510923576[/C][C]0.0469097021847151[/C][C]0.976545148907642[/C][/ROW]
[ROW][C]32[/C][C]0.0139634096148639[/C][C]0.0279268192297278[/C][C]0.986036590385136[/C][/ROW]
[ROW][C]33[/C][C]0.00752988503258068[/C][C]0.0150597700651614[/C][C]0.99247011496742[/C][/ROW]
[ROW][C]34[/C][C]0.0036565002944022[/C][C]0.0073130005888044[/C][C]0.996343499705598[/C][/ROW]
[ROW][C]35[/C][C]0.0108303315335195[/C][C]0.021660663067039[/C][C]0.98916966846648[/C][/ROW]
[ROW][C]36[/C][C]0.0271031029537285[/C][C]0.054206205907457[/C][C]0.972896897046271[/C][/ROW]
[ROW][C]37[/C][C]0.0299148809888896[/C][C]0.0598297619777792[/C][C]0.97008511901111[/C][/ROW]
[ROW][C]38[/C][C]0.0381900104780481[/C][C]0.0763800209560962[/C][C]0.961809989521952[/C][/ROW]
[ROW][C]39[/C][C]0.049028426173713[/C][C]0.098056852347426[/C][C]0.950971573826287[/C][/ROW]
[ROW][C]40[/C][C]0.0696984125696849[/C][C]0.139396825139370[/C][C]0.930301587430315[/C][/ROW]
[ROW][C]41[/C][C]0.0900500536802928[/C][C]0.180100107360586[/C][C]0.909949946319707[/C][/ROW]
[ROW][C]42[/C][C]0.193008356387487[/C][C]0.386016712774974[/C][C]0.806991643612513[/C][/ROW]
[ROW][C]43[/C][C]0.197866652336922[/C][C]0.395733304673844[/C][C]0.802133347663078[/C][/ROW]
[ROW][C]44[/C][C]0.218573166972228[/C][C]0.437146333944456[/C][C]0.781426833027772[/C][/ROW]
[/TABLE]
Source: https://freestatistics.org/blog/index.php?pk=36559&T=5

Globally Unique Identifier (entire table): ba.freestatistics.org/blog/index.php?pk=36559&T=5

As an alternative you can also use a QR Code:  

The GUIDs for individual cells are displayed in the table below:

Goldfeld-Quandt test for Heteroskedasticity
p-valuesAlternative Hypothesis
breakpoint indexgreater2-sidedless
160.7760751296362420.4478497407275170.223924870363758
170.7258073406476540.5483853187046930.274192659352346
180.6823707581469920.6352584837060160.317629241853008
190.6192217481061340.7615565037877310.380778251893866
200.5620062834802170.8759874330395660.437993716519783
210.4705541014265910.9411082028531810.529445898573409
220.3893355994644010.7786711989288020.610664400535599
230.2855885263453710.5711770526907420.71441147365463
240.1993610595311740.3987221190623480.800638940468826
250.1682154340582650.3364308681165290.831784565941735
260.1334470761240720.2668941522481450.866552923875928
270.09912642569700060.1982528513940010.900873574303
280.06653552806883480.1330710561376700.933464471931165
290.04745830538297230.09491661076594450.952541694617028
300.03527582886411350.0705516577282270.964724171135886
310.02345485109235760.04690970218471510.976545148907642
320.01396340961486390.02792681922972780.986036590385136
330.007529885032580680.01505977006516140.99247011496742
340.00365650029440220.00731300058880440.996343499705598
350.01083033153351950.0216606630670390.98916966846648
360.02710310295372850.0542062059074570.972896897046271
370.02991488098888960.05982976197777920.97008511901111
380.03819001047804810.07638002095609620.961809989521952
390.0490284261737130.0980568523474260.950971573826287
400.06969841256968490.1393968251393700.930301587430315
410.09005005368029280.1801001073605860.909949946319707
420.1930083563874870.3860167127749740.806991643612513
430.1978666523369220.3957333046738440.802133347663078
440.2185731669722280.4371463339444560.781426833027772


Meta Analysis of Goldfeld-Quandt test for Heteroskedasticity
Description# significant tests% significant testsOK/NOK
1% type I error level10.0344827586206897NOK
5% type I error level50.172413793103448NOK
10% type I error level110.379310344827586NOK

\begin{tabular}{lllllllll}
\hline
Meta Analysis of Goldfeld-Quandt test for Heteroskedasticity \tabularnewline
Description & # significant tests & % significant tests & OK/NOK \tabularnewline
1% type I error level & 1 & 0.0344827586206897 & NOK \tabularnewline
5% type I error level & 5 & 0.172413793103448 & NOK \tabularnewline
10% type I error level & 11 & 0.379310344827586 & NOK \tabularnewline
\hline
\end{tabular}
%Source: https://freestatistics.org/blog/index.php?pk=36559&T=6

[TABLE]
[ROW][C]Meta Analysis of Goldfeld-Quandt test for Heteroskedasticity[/C][/ROW]
[ROW][C]Description[/C][C]# significant tests[/C][C]% significant tests[/C][C]OK/NOK[/C][/ROW]
[ROW][C]1% type I error level[/C][C]1[/C][C]0.0344827586206897[/C][C]NOK[/C][/ROW]
[ROW][C]5% type I error level[/C][C]5[/C][C]0.172413793103448[/C][C]NOK[/C][/ROW]
[ROW][C]10% type I error level[/C][C]11[/C][C]0.379310344827586[/C][C]NOK[/C][/ROW]
[/TABLE]
Source: https://freestatistics.org/blog/index.php?pk=36559&T=6

Globally Unique Identifier (entire table): ba.freestatistics.org/blog/index.php?pk=36559&T=6

As an alternative you can also use a QR Code:  

The GUIDs for individual cells are displayed in the table below:

Meta Analysis of Goldfeld-Quandt test for Heteroskedasticity
Description# significant tests% significant testsOK/NOK
1% type I error level10.0344827586206897NOK
5% type I error level50.172413793103448NOK
10% type I error level110.379310344827586NOK


Parameters (Session):
par1 = 1 ; par2 = Include Monthly Dummies ; par3 = No Linear Trend ;
Parameters (R input):
par1 = 1 ; par2 = Include Monthly Dummies ; par3 = No Linear Trend ;
R code (references can be found in the software module):
library(lattice)
library(lmtest)
n25 <- 25 #minimum number of obs. for Goldfeld-Quandt test
par1 <- as.numeric(par1)
x <- t(y)
k <- length(x[1,])
n <- length(x[,1])
x1 <- cbind(x[,par1], x[,1:k!=par1])
mycolnames <- c(colnames(x)[par1], colnames(x)[1:k!=par1])
colnames(x1) <- mycolnames #colnames(x)[par1]
x <- x1
if (par3 == 'First Differences'){
x2 <- array(0, dim=c(n-1,k), dimnames=list(1:(n-1), paste('(1-B)',colnames(x),sep='')))
for (i in 1:n-1) {
for (j in 1:k) {
x2[i,j] <- x[i+1,j] - x[i,j]
}
}
x <- x2
}
if (par2 == 'Include Monthly Dummies'){
x2 <- array(0, dim=c(n,11), dimnames=list(1:n, paste('M', seq(1:11), sep ='')))
for (i in 1:11){
x2[seq(i,n,12),i] <- 1
}
x <- cbind(x, x2)
}
if (par2 == 'Include Quarterly Dummies'){
x2 <- array(0, dim=c(n,3), dimnames=list(1:n, paste('Q', seq(1:3), sep ='')))
for (i in 1:3){
x2[seq(i,n,4),i] <- 1
}
x <- cbind(x, x2)
}
k <- length(x[1,])
if (par3 == 'Linear Trend'){
x <- cbind(x, c(1:n))
colnames(x)[k+1] <- 't'
}
x
k <- length(x[1,])
df <- as.data.frame(x)
(mylm <- lm(df))
(mysum <- summary(mylm))
if (n > n25) {
kp3 <- k + 3
nmkm3 <- n - k - 3
gqarr <- array(NA, dim=c(nmkm3-kp3+1,3))
numgqtests <- 0
numsignificant1 <- 0
numsignificant5 <- 0
numsignificant10 <- 0
for (mypoint in kp3:nmkm3) {
j <- 0
numgqtests <- numgqtests + 1
for (myalt in c('greater', 'two.sided', 'less')) {
j <- j + 1
gqarr[mypoint-kp3+1,j] <- gqtest(mylm, point=mypoint, alternative=myalt)$p.value
}
if (gqarr[mypoint-kp3+1,2] < 0.01) numsignificant1 <- numsignificant1 + 1
if (gqarr[mypoint-kp3+1,2] < 0.05) numsignificant5 <- numsignificant5 + 1
if (gqarr[mypoint-kp3+1,2] < 0.10) numsignificant10 <- numsignificant10 + 1
}
gqarr
}
bitmap(file='test0.png')
plot(x[,1], type='l', main='Actuals and Interpolation', ylab='value of Actuals and Interpolation (dots)', xlab='time or index')
points(x[,1]-mysum$resid)
grid()
dev.off()
bitmap(file='test1.png')
plot(mysum$resid, type='b', pch=19, main='Residuals', ylab='value of Residuals', xlab='time or index')
grid()
dev.off()
bitmap(file='test2.png')
hist(mysum$resid, main='Residual Histogram', xlab='values of Residuals')
grid()
dev.off()
bitmap(file='test3.png')
densityplot(~mysum$resid,col='black',main='Residual Density Plot', xlab='values of Residuals')
dev.off()
bitmap(file='test4.png')
qqnorm(mysum$resid, main='Residual Normal Q-Q Plot')
qqline(mysum$resid)
grid()
dev.off()
(myerror <- as.ts(mysum$resid))
bitmap(file='test5.png')
dum <- cbind(lag(myerror,k=1),myerror)
dum
dum1 <- dum[2:length(myerror),]
dum1
z <- as.data.frame(dum1)
z
plot(z,main=paste('Residual Lag plot, lowess, and regression line'), ylab='values of Residuals', xlab='lagged values of Residuals')
lines(lowess(z))
abline(lm(z))
grid()
dev.off()
bitmap(file='test6.png')
acf(mysum$resid, lag.max=length(mysum$resid)/2, main='Residual Autocorrelation Function')
grid()
dev.off()
bitmap(file='test7.png')
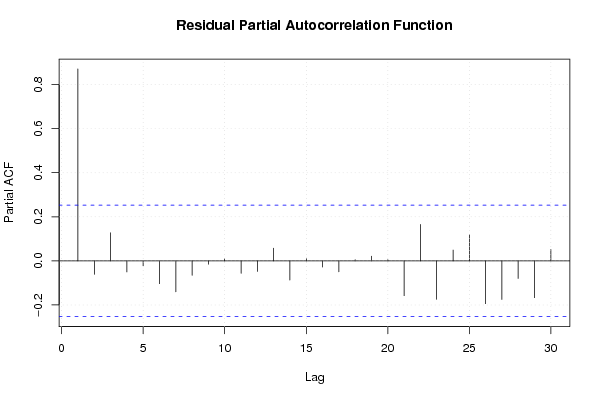
pacf(mysum$resid, lag.max=length(mysum$resid)/2, main='Residual Partial Autocorrelation Function')
grid()
dev.off()
bitmap(file='test8.png')
opar <- par(mfrow = c(2,2), oma = c(0, 0, 1.1, 0))
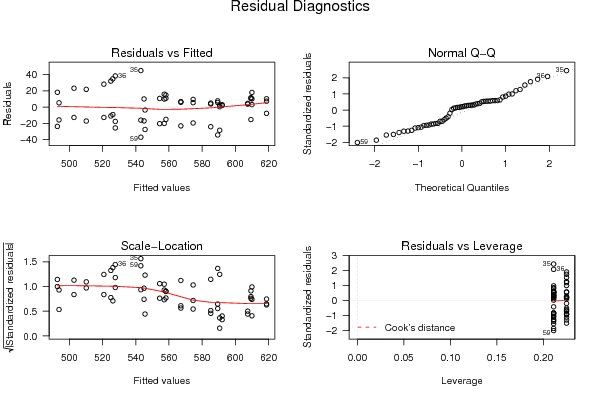
plot(mylm, las = 1, sub='Residual Diagnostics')
par(opar)
dev.off()
if (n > n25) {
bitmap(file='test9.png')
plot(kp3:nmkm3,gqarr[,2], main='Goldfeld-Quandt test',ylab='2-sided p-value',xlab='breakpoint')
grid()
dev.off()
}
load(file='createtable')
a<-table.start()
a<-table.row.start(a)
a<-table.element(a, 'Multiple Linear Regression - Estimated Regression Equation', 1, TRUE)
a<-table.row.end(a)
myeq <- colnames(x)[1]
myeq <- paste(myeq, '[t] = ', sep='')
for (i in 1:k){
if (mysum$coefficients[i,1] > 0) myeq <- paste(myeq, '+', '')
myeq <- paste(myeq, mysum$coefficients[i,1], sep=' ')
if (rownames(mysum$coefficients)[i] != '(Intercept)') {
myeq <- paste(myeq, rownames(mysum$coefficients)[i], sep='')
if (rownames(mysum$coefficients)[i] != 't') myeq <- paste(myeq, '[t]', sep='')
}
}
myeq <- paste(myeq, ' + e[t]')
a<-table.row.start(a)
a<-table.element(a, myeq)
a<-table.row.end(a)
a<-table.end(a)
table.save(a,file='mytable1.tab')
a<-table.start()
a<-table.row.start(a)
a<-table.element(a,hyperlink('ols1.htm','Multiple Linear Regression - Ordinary Least Squares',''), 6, TRUE)
a<-table.row.end(a)
a<-table.row.start(a)
a<-table.element(a,'Variable',header=TRUE)
a<-table.element(a,'Parameter',header=TRUE)
a<-table.element(a,'S.D.',header=TRUE)
a<-table.element(a,'T-STAT
H0: parameter = 0',header=TRUE)
a<-table.element(a,'2-tail p-value',header=TRUE)
a<-table.element(a,'1-tail p-value',header=TRUE)
a<-table.row.end(a)
for (i in 1:k){
a<-table.row.start(a)
a<-table.element(a,rownames(mysum$coefficients)[i],header=TRUE)
a<-table.element(a,mysum$coefficients[i,1])
a<-table.element(a, round(mysum$coefficients[i,2],6))
a<-table.element(a, round(mysum$coefficients[i,3],4))
a<-table.element(a, round(mysum$coefficients[i,4],6))
a<-table.element(a, round(mysum$coefficients[i,4]/2,6))
a<-table.row.end(a)
}
a<-table.end(a)
table.save(a,file='mytable2.tab')
a<-table.start()
a<-table.row.start(a)
a<-table.element(a, 'Multiple Linear Regression - Regression Statistics', 2, TRUE)
a<-table.row.end(a)
a<-table.row.start(a)
a<-table.element(a, 'Multiple R',1,TRUE)
a<-table.element(a, sqrt(mysum$r.squared))
a<-table.row.end(a)
a<-table.row.start(a)
a<-table.element(a, 'R-squared',1,TRUE)
a<-table.element(a, mysum$r.squared)
a<-table.row.end(a)
a<-table.row.start(a)
a<-table.element(a, 'Adjusted R-squared',1,TRUE)
a<-table.element(a, mysum$adj.r.squared)
a<-table.row.end(a)
a<-table.row.start(a)
a<-table.element(a, 'F-TEST (value)',1,TRUE)
a<-table.element(a, mysum$fstatistic[1])
a<-table.row.end(a)
a<-table.row.start(a)
a<-table.element(a, 'F-TEST (DF numerator)',1,TRUE)
a<-table.element(a, mysum$fstatistic[2])
a<-table.row.end(a)
a<-table.row.start(a)
a<-table.element(a, 'F-TEST (DF denominator)',1,TRUE)
a<-table.element(a, mysum$fstatistic[3])
a<-table.row.end(a)
a<-table.row.start(a)
a<-table.element(a, 'p-value',1,TRUE)
a<-table.element(a, 1-pf(mysum$fstatistic[1],mysum$fstatistic[2],mysum$fstatistic[3]))
a<-table.row.end(a)
a<-table.row.start(a)
a<-table.element(a, 'Multiple Linear Regression - Residual Statistics', 2, TRUE)
a<-table.row.end(a)
a<-table.row.start(a)
a<-table.element(a, 'Residual Standard Deviation',1,TRUE)
a<-table.element(a, mysum$sigma)
a<-table.row.end(a)
a<-table.row.start(a)
a<-table.element(a, 'Sum Squared Residuals',1,TRUE)
a<-table.element(a, sum(myerror*myerror))
a<-table.row.end(a)
a<-table.end(a)
table.save(a,file='mytable3.tab')
a<-table.start()
a<-table.row.start(a)
a<-table.element(a, 'Multiple Linear Regression - Actuals, Interpolation, and Residuals', 4, TRUE)
a<-table.row.end(a)
a<-table.row.start(a)
a<-table.element(a, 'Time or Index', 1, TRUE)
a<-table.element(a, 'Actuals', 1, TRUE)
a<-table.element(a, 'Interpolation
Forecast', 1, TRUE)
a<-table.element(a, 'Residuals
Prediction Error', 1, TRUE)
a<-table.row.end(a)
for (i in 1:n) {
a<-table.row.start(a)
a<-table.element(a,i, 1, TRUE)
a<-table.element(a,x[i])
a<-table.element(a,x[i]-mysum$resid[i])
a<-table.element(a,mysum$resid[i])
a<-table.row.end(a)
}
a<-table.end(a)
table.save(a,file='mytable4.tab')
if (n > n25) {
a<-table.start()
a<-table.row.start(a)
a<-table.element(a,'Goldfeld-Quandt test for Heteroskedasticity',4,TRUE)
a<-table.row.end(a)
a<-table.row.start(a)
a<-table.element(a,'p-values',header=TRUE)
a<-table.element(a,'Alternative Hypothesis',3,header=TRUE)
a<-table.row.end(a)
a<-table.row.start(a)
a<-table.element(a,'breakpoint index',header=TRUE)
a<-table.element(a,'greater',header=TRUE)
a<-table.element(a,'2-sided',header=TRUE)
a<-table.element(a,'less',header=TRUE)
a<-table.row.end(a)
for (mypoint in kp3:nmkm3) {
a<-table.row.start(a)
a<-table.element(a,mypoint,header=TRUE)
a<-table.element(a,gqarr[mypoint-kp3+1,1])
a<-table.element(a,gqarr[mypoint-kp3+1,2])
a<-table.element(a,gqarr[mypoint-kp3+1,3])
a<-table.row.end(a)
}
a<-table.end(a)
table.save(a,file='mytable5.tab')
a<-table.start()
a<-table.row.start(a)
a<-table.element(a,'Meta Analysis of Goldfeld-Quandt test for Heteroskedasticity',4,TRUE)
a<-table.row.end(a)
a<-table.row.start(a)
a<-table.element(a,'Description',header=TRUE)
a<-table.element(a,'# significant tests',header=TRUE)
a<-table.element(a,'% significant tests',header=TRUE)
a<-table.element(a,'OK/NOK',header=TRUE)
a<-table.row.end(a)
a<-table.row.start(a)
a<-table.element(a,'1% type I error level',header=TRUE)
a<-table.element(a,numsignificant1)
a<-table.element(a,numsignificant1/numgqtests)
if (numsignificant1/numgqtests < 0.01) dum <- 'OK' else dum <- 'NOK'
a<-table.element(a,dum)
a<-table.row.end(a)
a<-table.row.start(a)
a<-table.element(a,'5% type I error level',header=TRUE)
a<-table.element(a,numsignificant5)
a<-table.element(a,numsignificant5/numgqtests)
if (numsignificant5/numgqtests < 0.05) dum <- 'OK' else dum <- 'NOK'
a<-table.element(a,dum)
a<-table.row.end(a)
a<-table.row.start(a)
a<-table.element(a,'10% type I error level',header=TRUE)
a<-table.element(a,numsignificant10)
a<-table.element(a,numsignificant10/numgqtests)
if (numsignificant10/numgqtests < 0.1) dum <- 'OK' else dum <- 'NOK'
a<-table.element(a,dum)
a<-table.row.end(a)
a<-table.end(a)
table.save(a,file='mytable6.tab')
}