Free Statistics

of Irreproducible Research!

Author's title

Author*The author of this computation has been verified*
R Software Modulerwasp_autocorrelation.wasp
Title produced by software(Partial) Autocorrelation Function
Date of computationTue, 23 Dec 2008 08:59:09 -0700
Cite this page as followsStatistical Computations at FreeStatistics.org, Office for Research Development and Education, URL https://freestatistics.org/blog/index.php?v=date/2008/Dec/23/t1230047983a9xvealmtgzt9dr.htm/, Retrieved Fri, 17 May 2024 02:39:07 +0000
Statistical Computations at FreeStatistics.org, Office for Research Development and Education, URL https://freestatistics.org/blog/index.php?pk=36335, Retrieved Fri, 17 May 2024 02:39:07 +0000
QR Codes:

Original text written by user:
IsPrivate?No (this computation is public)
User-defined keywords
Estimated Impact187
Family? (F = Feedback message, R = changed R code, M = changed R Module, P = changed Parameters, D = changed Data)
-     [(Partial) Autocorrelation Function] [VAC (Partiële) au...] [2008-12-14 13:47:12] [379d6c32f73e3218fd773d79e4063d07]
-    D  [(Partial) Autocorrelation Function] [VAC (Partiële) au...] [2008-12-14 14:18:58] [379d6c32f73e3218fd773d79e4063d07]
-   P     [(Partial) Autocorrelation Function] [VAC (Partiële) au...] [2008-12-17 11:25:15] [379d6c32f73e3218fd773d79e4063d07]
-   P         [(Partial) Autocorrelation Function] [VAC (Partiële) au...] [2008-12-23 15:59:09] [490fee4f334e2e025c95681783e3fd0b] [Current]
Feedback Forum

Post a new message
Dataseries X:
124.1
124.4
115.7
108.3
102.3
104.6
104
103.5
96
96.6
95.4
92.1
93
90.4
93.3
97.1
111
114.1
113.3
111
107.2
118.3
134.1
139
116.7
112.5
122.8
130
125.6
123.8
135.8
136.4
135.3
149.5
159.6
161.4
175.2
199.5
245
257.8


Summary of computational transaction
Raw Inputview raw input (R code)
Raw Outputview raw output of R engine
Computing time2 seconds
R Server'Sir Ronald Aylmer Fisher' @ 193.190.124.24

\begin{tabular}{lllllllll}
\hline
Summary of computational transaction \tabularnewline
Raw Input & view raw input (R code)  \tabularnewline
Raw Output & view raw output of R engine  \tabularnewline
Computing time & 2 seconds \tabularnewline
R Server & 'Sir Ronald Aylmer Fisher' @ 193.190.124.24 \tabularnewline
\hline
\end{tabular}
%Source: https://freestatistics.org/blog/index.php?pk=36335&T=0

[TABLE]
[ROW][C]Summary of computational transaction[/C][/ROW]
[ROW][C]Raw Input[/C][C]view raw input (R code) [/C][/ROW]
[ROW][C]Raw Output[/C][C]view raw output of R engine [/C][/ROW]
[ROW][C]Computing time[/C][C]2 seconds[/C][/ROW]
[ROW][C]R Server[/C][C]'Sir Ronald Aylmer Fisher' @ 193.190.124.24[/C][/ROW]
[/TABLE]
Source: https://freestatistics.org/blog/index.php?pk=36335&T=0

Globally Unique Identifier (entire table): ba.freestatistics.org/blog/index.php?pk=36335&T=0

As an alternative you can also use a QR Code:  

The GUIDs for individual cells are displayed in the table below:

Summary of computational transaction
Raw Inputview raw input (R code)
Raw Outputview raw output of R engine
Computing time2 seconds
R Server'Sir Ronald Aylmer Fisher' @ 193.190.124.24


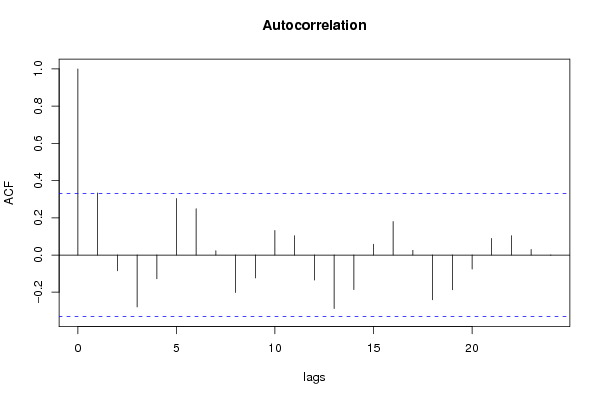
Autocorrelation Function
Time lag kACF(k)T-STATP-value
10.3335341.97320.028205
2-0.08502-0.5030.309062
3-0.278888-1.64990.053953
4-0.127885-0.75660.227183
50.3039811.79840.040374
60.2490341.47330.074803
70.0230850.13660.446076
8-0.201684-1.19320.120412
9-0.123-0.72770.235825
100.1322950.78270.219542
110.1040050.61530.271168
12-0.134185-0.79380.216317
13-0.287815-1.70270.048742
14-0.185825-1.09940.139559
150.0578470.34220.367114
160.1797351.06330.147457
170.0249750.14780.441692
18-0.241096-1.42630.081314
19-0.187184-1.10740.137838
20-0.075248-0.44520.329469
210.0887080.52480.301513
220.1041460.61610.270896
230.0294450.17420.431356
24-0.001533-0.00910.496408

\begin{tabular}{lllllllll}
\hline
Autocorrelation Function \tabularnewline
Time lag k & ACF(k) & T-STAT & P-value \tabularnewline
1 & 0.333534 & 1.9732 & 0.028205 \tabularnewline
2 & -0.08502 & -0.503 & 0.309062 \tabularnewline
3 & -0.278888 & -1.6499 & 0.053953 \tabularnewline
4 & -0.127885 & -0.7566 & 0.227183 \tabularnewline
5 & 0.303981 & 1.7984 & 0.040374 \tabularnewline
6 & 0.249034 & 1.4733 & 0.074803 \tabularnewline
7 & 0.023085 & 0.1366 & 0.446076 \tabularnewline
8 & -0.201684 & -1.1932 & 0.120412 \tabularnewline
9 & -0.123 & -0.7277 & 0.235825 \tabularnewline
10 & 0.132295 & 0.7827 & 0.219542 \tabularnewline
11 & 0.104005 & 0.6153 & 0.271168 \tabularnewline
12 & -0.134185 & -0.7938 & 0.216317 \tabularnewline
13 & -0.287815 & -1.7027 & 0.048742 \tabularnewline
14 & -0.185825 & -1.0994 & 0.139559 \tabularnewline
15 & 0.057847 & 0.3422 & 0.367114 \tabularnewline
16 & 0.179735 & 1.0633 & 0.147457 \tabularnewline
17 & 0.024975 & 0.1478 & 0.441692 \tabularnewline
18 & -0.241096 & -1.4263 & 0.081314 \tabularnewline
19 & -0.187184 & -1.1074 & 0.137838 \tabularnewline
20 & -0.075248 & -0.4452 & 0.329469 \tabularnewline
21 & 0.088708 & 0.5248 & 0.301513 \tabularnewline
22 & 0.104146 & 0.6161 & 0.270896 \tabularnewline
23 & 0.029445 & 0.1742 & 0.431356 \tabularnewline
24 & -0.001533 & -0.0091 & 0.496408 \tabularnewline
\hline
\end{tabular}
%Source: https://freestatistics.org/blog/index.php?pk=36335&T=1

[TABLE]
[ROW][C]Autocorrelation Function[/C][/ROW]
[ROW][C]Time lag k[/C][C]ACF(k)[/C][C]T-STAT[/C][C]P-value[/C][/ROW]
[ROW][C]1[/C][C]0.333534[/C][C]1.9732[/C][C]0.028205[/C][/ROW]
[ROW][C]2[/C][C]-0.08502[/C][C]-0.503[/C][C]0.309062[/C][/ROW]
[ROW][C]3[/C][C]-0.278888[/C][C]-1.6499[/C][C]0.053953[/C][/ROW]
[ROW][C]4[/C][C]-0.127885[/C][C]-0.7566[/C][C]0.227183[/C][/ROW]
[ROW][C]5[/C][C]0.303981[/C][C]1.7984[/C][C]0.040374[/C][/ROW]
[ROW][C]6[/C][C]0.249034[/C][C]1.4733[/C][C]0.074803[/C][/ROW]
[ROW][C]7[/C][C]0.023085[/C][C]0.1366[/C][C]0.446076[/C][/ROW]
[ROW][C]8[/C][C]-0.201684[/C][C]-1.1932[/C][C]0.120412[/C][/ROW]
[ROW][C]9[/C][C]-0.123[/C][C]-0.7277[/C][C]0.235825[/C][/ROW]
[ROW][C]10[/C][C]0.132295[/C][C]0.7827[/C][C]0.219542[/C][/ROW]
[ROW][C]11[/C][C]0.104005[/C][C]0.6153[/C][C]0.271168[/C][/ROW]
[ROW][C]12[/C][C]-0.134185[/C][C]-0.7938[/C][C]0.216317[/C][/ROW]
[ROW][C]13[/C][C]-0.287815[/C][C]-1.7027[/C][C]0.048742[/C][/ROW]
[ROW][C]14[/C][C]-0.185825[/C][C]-1.0994[/C][C]0.139559[/C][/ROW]
[ROW][C]15[/C][C]0.057847[/C][C]0.3422[/C][C]0.367114[/C][/ROW]
[ROW][C]16[/C][C]0.179735[/C][C]1.0633[/C][C]0.147457[/C][/ROW]
[ROW][C]17[/C][C]0.024975[/C][C]0.1478[/C][C]0.441692[/C][/ROW]
[ROW][C]18[/C][C]-0.241096[/C][C]-1.4263[/C][C]0.081314[/C][/ROW]
[ROW][C]19[/C][C]-0.187184[/C][C]-1.1074[/C][C]0.137838[/C][/ROW]
[ROW][C]20[/C][C]-0.075248[/C][C]-0.4452[/C][C]0.329469[/C][/ROW]
[ROW][C]21[/C][C]0.088708[/C][C]0.5248[/C][C]0.301513[/C][/ROW]
[ROW][C]22[/C][C]0.104146[/C][C]0.6161[/C][C]0.270896[/C][/ROW]
[ROW][C]23[/C][C]0.029445[/C][C]0.1742[/C][C]0.431356[/C][/ROW]
[ROW][C]24[/C][C]-0.001533[/C][C]-0.0091[/C][C]0.496408[/C][/ROW]
[/TABLE]
Source: https://freestatistics.org/blog/index.php?pk=36335&T=1

Globally Unique Identifier (entire table): ba.freestatistics.org/blog/index.php?pk=36335&T=1

As an alternative you can also use a QR Code:  

The GUIDs for individual cells are displayed in the table below:

Autocorrelation Function
Time lag kACF(k)T-STATP-value
10.3335341.97320.028205
2-0.08502-0.5030.309062
3-0.278888-1.64990.053953
4-0.127885-0.75660.227183
50.3039811.79840.040374
60.2490341.47330.074803
70.0230850.13660.446076
8-0.201684-1.19320.120412
9-0.123-0.72770.235825
100.1322950.78270.219542
110.1040050.61530.271168
12-0.134185-0.79380.216317
13-0.287815-1.70270.048742
14-0.185825-1.09940.139559
150.0578470.34220.367114
160.1797351.06330.147457
170.0249750.14780.441692
18-0.241096-1.42630.081314
19-0.187184-1.10740.137838
20-0.075248-0.44520.329469
210.0887080.52480.301513
220.1041460.61610.270896
230.0294450.17420.431356
24-0.001533-0.00910.496408


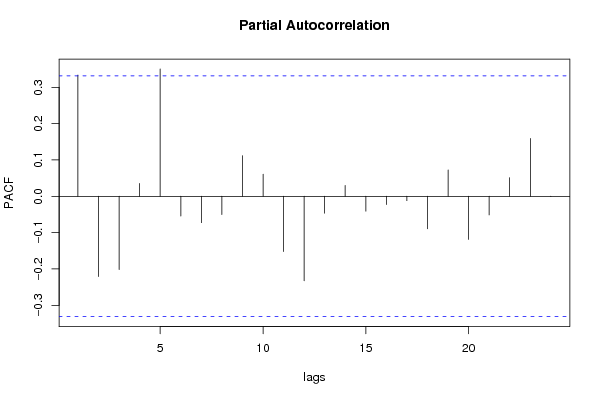
Partial Autocorrelation Function
Time lag kPACF(k)T-STATP-value
10.3335341.97320.028205
2-0.220831-1.30650.099959
3-0.201812-1.19390.120267
40.0354740.20990.417495
50.3504972.07360.022771
6-0.054579-0.32290.374347
7-0.07262-0.42960.33505
8-0.050344-0.29780.383794
90.1114640.65940.256969
100.060520.3580.361232
11-0.152035-0.89940.18728
12-0.232758-1.3770.088626
13-0.046393-0.27450.39267
140.0297780.17620.430589
15-0.040899-0.2420.405112
16-0.022485-0.1330.44747
17-0.012056-0.07130.471772
18-0.089581-0.530.29974
190.0723330.42790.335664
20-0.118733-0.70240.243528
21-0.051231-0.30310.381808
220.0509620.30150.382411
230.1592740.94230.176255
24-0.000811-0.00480.4981

\begin{tabular}{lllllllll}
\hline
Partial Autocorrelation Function \tabularnewline
Time lag k & PACF(k) & T-STAT & P-value \tabularnewline
1 & 0.333534 & 1.9732 & 0.028205 \tabularnewline
2 & -0.220831 & -1.3065 & 0.099959 \tabularnewline
3 & -0.201812 & -1.1939 & 0.120267 \tabularnewline
4 & 0.035474 & 0.2099 & 0.417495 \tabularnewline
5 & 0.350497 & 2.0736 & 0.022771 \tabularnewline
6 & -0.054579 & -0.3229 & 0.374347 \tabularnewline
7 & -0.07262 & -0.4296 & 0.33505 \tabularnewline
8 & -0.050344 & -0.2978 & 0.383794 \tabularnewline
9 & 0.111464 & 0.6594 & 0.256969 \tabularnewline
10 & 0.06052 & 0.358 & 0.361232 \tabularnewline
11 & -0.152035 & -0.8994 & 0.18728 \tabularnewline
12 & -0.232758 & -1.377 & 0.088626 \tabularnewline
13 & -0.046393 & -0.2745 & 0.39267 \tabularnewline
14 & 0.029778 & 0.1762 & 0.430589 \tabularnewline
15 & -0.040899 & -0.242 & 0.405112 \tabularnewline
16 & -0.022485 & -0.133 & 0.44747 \tabularnewline
17 & -0.012056 & -0.0713 & 0.471772 \tabularnewline
18 & -0.089581 & -0.53 & 0.29974 \tabularnewline
19 & 0.072333 & 0.4279 & 0.335664 \tabularnewline
20 & -0.118733 & -0.7024 & 0.243528 \tabularnewline
21 & -0.051231 & -0.3031 & 0.381808 \tabularnewline
22 & 0.050962 & 0.3015 & 0.382411 \tabularnewline
23 & 0.159274 & 0.9423 & 0.176255 \tabularnewline
24 & -0.000811 & -0.0048 & 0.4981 \tabularnewline
\hline
\end{tabular}
%Source: https://freestatistics.org/blog/index.php?pk=36335&T=2

[TABLE]
[ROW][C]Partial Autocorrelation Function[/C][/ROW]
[ROW][C]Time lag k[/C][C]PACF(k)[/C][C]T-STAT[/C][C]P-value[/C][/ROW]
[ROW][C]1[/C][C]0.333534[/C][C]1.9732[/C][C]0.028205[/C][/ROW]
[ROW][C]2[/C][C]-0.220831[/C][C]-1.3065[/C][C]0.099959[/C][/ROW]
[ROW][C]3[/C][C]-0.201812[/C][C]-1.1939[/C][C]0.120267[/C][/ROW]
[ROW][C]4[/C][C]0.035474[/C][C]0.2099[/C][C]0.417495[/C][/ROW]
[ROW][C]5[/C][C]0.350497[/C][C]2.0736[/C][C]0.022771[/C][/ROW]
[ROW][C]6[/C][C]-0.054579[/C][C]-0.3229[/C][C]0.374347[/C][/ROW]
[ROW][C]7[/C][C]-0.07262[/C][C]-0.4296[/C][C]0.33505[/C][/ROW]
[ROW][C]8[/C][C]-0.050344[/C][C]-0.2978[/C][C]0.383794[/C][/ROW]
[ROW][C]9[/C][C]0.111464[/C][C]0.6594[/C][C]0.256969[/C][/ROW]
[ROW][C]10[/C][C]0.06052[/C][C]0.358[/C][C]0.361232[/C][/ROW]
[ROW][C]11[/C][C]-0.152035[/C][C]-0.8994[/C][C]0.18728[/C][/ROW]
[ROW][C]12[/C][C]-0.232758[/C][C]-1.377[/C][C]0.088626[/C][/ROW]
[ROW][C]13[/C][C]-0.046393[/C][C]-0.2745[/C][C]0.39267[/C][/ROW]
[ROW][C]14[/C][C]0.029778[/C][C]0.1762[/C][C]0.430589[/C][/ROW]
[ROW][C]15[/C][C]-0.040899[/C][C]-0.242[/C][C]0.405112[/C][/ROW]
[ROW][C]16[/C][C]-0.022485[/C][C]-0.133[/C][C]0.44747[/C][/ROW]
[ROW][C]17[/C][C]-0.012056[/C][C]-0.0713[/C][C]0.471772[/C][/ROW]
[ROW][C]18[/C][C]-0.089581[/C][C]-0.53[/C][C]0.29974[/C][/ROW]
[ROW][C]19[/C][C]0.072333[/C][C]0.4279[/C][C]0.335664[/C][/ROW]
[ROW][C]20[/C][C]-0.118733[/C][C]-0.7024[/C][C]0.243528[/C][/ROW]
[ROW][C]21[/C][C]-0.051231[/C][C]-0.3031[/C][C]0.381808[/C][/ROW]
[ROW][C]22[/C][C]0.050962[/C][C]0.3015[/C][C]0.382411[/C][/ROW]
[ROW][C]23[/C][C]0.159274[/C][C]0.9423[/C][C]0.176255[/C][/ROW]
[ROW][C]24[/C][C]-0.000811[/C][C]-0.0048[/C][C]0.4981[/C][/ROW]
[/TABLE]
Source: https://freestatistics.org/blog/index.php?pk=36335&T=2

Globally Unique Identifier (entire table): ba.freestatistics.org/blog/index.php?pk=36335&T=2

As an alternative you can also use a QR Code:  

The GUIDs for individual cells are displayed in the table below:

Partial Autocorrelation Function
Time lag kPACF(k)T-STATP-value
10.3335341.97320.028205
2-0.220831-1.30650.099959
3-0.201812-1.19390.120267
40.0354740.20990.417495
50.3504972.07360.022771
6-0.054579-0.32290.374347
7-0.07262-0.42960.33505
8-0.050344-0.29780.383794
90.1114640.65940.256969
100.060520.3580.361232
11-0.152035-0.89940.18728
12-0.232758-1.3770.088626
13-0.046393-0.27450.39267
140.0297780.17620.430589
15-0.040899-0.2420.405112
16-0.022485-0.1330.44747
17-0.012056-0.07130.471772
18-0.089581-0.530.29974
190.0723330.42790.335664
20-0.118733-0.70240.243528
21-0.051231-0.30310.381808
220.0509620.30150.382411
230.1592740.94230.176255
24-0.000811-0.00480.4981


Parameters (Session):
par1 = FALSE ; par2 = 1.1 ; par3 = 1 ; par4 = 1 ; par5 = 4 ; par6 = 1 ; par7 = 1 ; par8 = 2 ; par9 = 1 ;
Parameters (R input):
par1 = 24 ; par2 = 1 ; par3 = 1 ; par4 = 1 ; par5 = 4 ;
R code (references can be found in the software module):
if (par1 == 'Default') {
par1 = 10*log10(length(x))
} else {
par1 <- as.numeric(par1)
}
par2 <- as.numeric(par2)
par3 <- as.numeric(par3)
par4 <- as.numeric(par4)
par5 <- as.numeric(par5)
if (par2 == 0) {
x <- log(x)
} else {
x <- (x ^ par2 - 1) / par2
}
if (par3 > 0) x <- diff(x,lag=1,difference=par3)
if (par4 > 0) x <- diff(x,lag=par5,difference=par4)
bitmap(file='pic1.png')
racf <- acf(x,par1,main='Autocorrelation',xlab='lags',ylab='ACF')
dev.off()
bitmap(file='pic2.png')
rpacf <- pacf(x,par1,main='Partial Autocorrelation',xlab='lags',ylab='PACF')
dev.off()
(myacf <- c(racf$acf))
(mypacf <- c(rpacf$acf))
lengthx <- length(x)
sqrtn <- sqrt(lengthx)
load(file='createtable')
a<-table.start()
a<-table.row.start(a)
a<-table.element(a,'Autocorrelation Function',4,TRUE)
a<-table.row.end(a)
a<-table.row.start(a)
a<-table.element(a,'Time lag k',header=TRUE)
a<-table.element(a,hyperlink('basics.htm','ACF(k)','click here for more information about the Autocorrelation Function'),header=TRUE)
a<-table.element(a,'T-STAT',header=TRUE)
a<-table.element(a,'P-value',header=TRUE)
a<-table.row.end(a)
for (i in 2:(par1+1)) {
a<-table.row.start(a)
a<-table.element(a,i-1,header=TRUE)
a<-table.element(a,round(myacf[i],6))
mytstat <- myacf[i]*sqrtn
a<-table.element(a,round(mytstat,4))
a<-table.element(a,round(1-pt(abs(mytstat),lengthx),6))
a<-table.row.end(a)
}
a<-table.end(a)
table.save(a,file='mytable.tab')
a<-table.start()
a<-table.row.start(a)
a<-table.element(a,'Partial Autocorrelation Function',4,TRUE)
a<-table.row.end(a)
a<-table.row.start(a)
a<-table.element(a,'Time lag k',header=TRUE)
a<-table.element(a,hyperlink('basics.htm','PACF(k)','click here for more information about the Partial Autocorrelation Function'),header=TRUE)
a<-table.element(a,'T-STAT',header=TRUE)
a<-table.element(a,'P-value',header=TRUE)
a<-table.row.end(a)
for (i in 1:par1) {
a<-table.row.start(a)
a<-table.element(a,i,header=TRUE)
a<-table.element(a,round(mypacf[i],6))
mytstat <- mypacf[i]*sqrtn
a<-table.element(a,round(mytstat,4))
a<-table.element(a,round(1-pt(abs(mytstat),lengthx),6))
a<-table.row.end(a)
}
a<-table.end(a)
table.save(a,file='mytable1.tab')