Free Statistics

of Irreproducible Research!

Author's title

Author*The author of this computation has been verified*
R Software Modulerwasp_cross.wasp
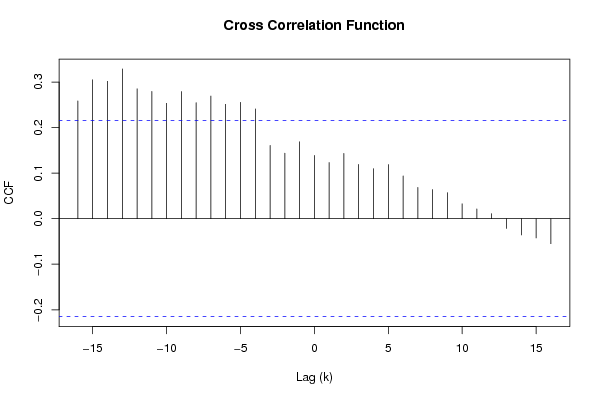
Title produced by softwareCross Correlation Function
Date of computationSun, 21 Dec 2008 13:28:19 -0700
Cite this page as followsStatistical Computations at FreeStatistics.org, Office for Research Development and Education, URL https://freestatistics.org/blog/index.php?v=date/2008/Dec/21/t1229891362npczcl3rs1hh243.htm/, Retrieved Fri, 17 May 2024 04:08:49 +0000
Statistical Computations at FreeStatistics.org, Office for Research Development and Education, URL https://freestatistics.org/blog/index.php?pk=35815, Retrieved Fri, 17 May 2024 04:08:49 +0000
QR Codes:

Original text written by user:
IsPrivate?No (this computation is public)
User-defined keywords
Estimated Impact168
Family? (F = Feedback message, R = changed R code, M = changed R Module, P = changed Parameters, D = changed Data)
-     [Multiple Regression] [Multiple..] [2008-12-09 17:33:14] [f77c9ab3b413812d7baee6b7ec69a15d]
- RMPD    [Cross Correlation Function] [CC] [2008-12-21 20:28:19] [d300b7a0882cee7d84584ad37a3d4ede] [Current]
Feedback Forum

Post a new message
Dataseries X:
101.02
100.67
100.47
100.38
100.33
100.34
100.37
100.39
100.21
100.21
100.22
100.28
100.25
100.25
100.21
100.16
100.18
100.1
99.96
99.88
99.88
99.86
99.84
99.8
99.82
99.81
99.92
100.03
99.99
100.02
100.01
100.13
100.33
100.13
99.96
100.05
99.83
99.8
100.01
100.1
100.13
100.16
100.41
101.34
101.65
101.85
102.07
102.12
102.14
102.21
102.28
102.19
102.33
102.54
102.44
102.78
102.9
103.08
102.77
102.65
102.71
103.29
102.86
103.45
103.72
103.65
103.83
104.45
105.14
105.07
105.31
105.19
105.3
105.02
105.17
105.28
105.45
105.38
105.8
105.96
105.08
105.11
105.61
105.5
Dataseries Y:
101.73
101.63
101.43
101.34
101.01
100.89
100.93
100.77
100.3
99.86
99.71
99.93
99.88
99.92
99.87
99.63
100.05
99.88
100.11
100.05
100.07
100.2
100.21
99.76
99.41
99.24
99.65
99.7
99.79
99.84
101
101.62
101.98
101.46
102.28
102.14
102.02
102.21
101.61
102.38
102.19
102.04
101.76
101.9
102.01
102.37
103.04
103.42
103.76
104.41
104.75
104.28
103.89
104.09
103.8
105.03
105.86
106.04
106.03
106.13
107.21
107.66
108.08
108.76
108.26
108.71
108.65
108.61
108.86
109.54
108.22
108.77
109.9
110.13
109.6
110.42
110.6
109.73
110.72
111.08
111.14
111.01
110.56
111.57


Summary of computational transaction
Raw Inputview raw input (R code)
Raw Outputview raw output of R engine
Computing time1 seconds
R Server'Gwilym Jenkins' @ 72.249.127.135

\begin{tabular}{lllllllll}
\hline
Summary of computational transaction \tabularnewline
Raw Input & view raw input (R code)  \tabularnewline
Raw Output & view raw output of R engine  \tabularnewline
Computing time & 1 seconds \tabularnewline
R Server & 'Gwilym Jenkins' @ 72.249.127.135 \tabularnewline
\hline
\end{tabular}
%Source: https://freestatistics.org/blog/index.php?pk=35815&T=0

[TABLE]
[ROW][C]Summary of computational transaction[/C][/ROW]
[ROW][C]Raw Input[/C][C]view raw input (R code) [/C][/ROW]
[ROW][C]Raw Output[/C][C]view raw output of R engine [/C][/ROW]
[ROW][C]Computing time[/C][C]1 seconds[/C][/ROW]
[ROW][C]R Server[/C][C]'Gwilym Jenkins' @ 72.249.127.135[/C][/ROW]
[/TABLE]
Source: https://freestatistics.org/blog/index.php?pk=35815&T=0

Globally Unique Identifier (entire table): ba.freestatistics.org/blog/index.php?pk=35815&T=0

As an alternative you can also use a QR Code:  

The GUIDs for individual cells are displayed in the table below:

Summary of computational transaction
Raw Inputview raw input (R code)
Raw Outputview raw output of R engine
Computing time1 seconds
R Server'Gwilym Jenkins' @ 72.249.127.135


Cross Correlation Function
ParameterValue
Box-Cox transformation parameter (lambda) of X series1
Degree of non-seasonal differencing (d) of X series1
Degree of seasonal differencing (D) of X series0
Seasonal Period (s)12
Box-Cox transformation parameter (lambda) of Y series1
Degree of non-seasonal differencing (d) of Y series0
Degree of seasonal differencing (D) of Y series0
krho(Y[t],X[t+k])
-160.258608728652453
-150.304965613829231
-140.301754362667245
-130.328868886258268
-120.285225563821785
-110.279473952885857
-100.253384930056631
-90.279067746626902
-80.254852044673999
-70.269351681542425
-60.251293414386336
-50.255478138100494
-40.240972414499529
-30.160821776720094
-20.143821111163152
-10.168943204696077
00.138829796799157
10.123187722427570
20.143205031820615
30.119253802001625
40.10984352551637
50.118930865267670
60.0939227361082311
70.0685659507717416
80.0640240063777169
90.0570540636014244
100.0326825472181912
110.0215075556909041
120.0109500938230297
13-0.0214406214978112
14-0.0356564237203083
15-0.0423009153895707
16-0.054999335030163

\begin{tabular}{lllllllll}
\hline
Cross Correlation Function \tabularnewline
Parameter & Value \tabularnewline
Box-Cox transformation parameter (lambda) of X series & 1 \tabularnewline
Degree of non-seasonal differencing (d) of X series & 1 \tabularnewline
Degree of seasonal differencing (D) of X series & 0 \tabularnewline
Seasonal Period (s) & 12 \tabularnewline
Box-Cox transformation parameter (lambda) of Y series & 1 \tabularnewline
Degree of non-seasonal differencing (d) of Y series & 0 \tabularnewline
Degree of seasonal differencing (D) of Y series & 0 \tabularnewline
k & rho(Y[t],X[t+k]) \tabularnewline
-16 & 0.258608728652453 \tabularnewline
-15 & 0.304965613829231 \tabularnewline
-14 & 0.301754362667245 \tabularnewline
-13 & 0.328868886258268 \tabularnewline
-12 & 0.285225563821785 \tabularnewline
-11 & 0.279473952885857 \tabularnewline
-10 & 0.253384930056631 \tabularnewline
-9 & 0.279067746626902 \tabularnewline
-8 & 0.254852044673999 \tabularnewline
-7 & 0.269351681542425 \tabularnewline
-6 & 0.251293414386336 \tabularnewline
-5 & 0.255478138100494 \tabularnewline
-4 & 0.240972414499529 \tabularnewline
-3 & 0.160821776720094 \tabularnewline
-2 & 0.143821111163152 \tabularnewline
-1 & 0.168943204696077 \tabularnewline
0 & 0.138829796799157 \tabularnewline
1 & 0.123187722427570 \tabularnewline
2 & 0.143205031820615 \tabularnewline
3 & 0.119253802001625 \tabularnewline
4 & 0.10984352551637 \tabularnewline
5 & 0.118930865267670 \tabularnewline
6 & 0.0939227361082311 \tabularnewline
7 & 0.0685659507717416 \tabularnewline
8 & 0.0640240063777169 \tabularnewline
9 & 0.0570540636014244 \tabularnewline
10 & 0.0326825472181912 \tabularnewline
11 & 0.0215075556909041 \tabularnewline
12 & 0.0109500938230297 \tabularnewline
13 & -0.0214406214978112 \tabularnewline
14 & -0.0356564237203083 \tabularnewline
15 & -0.0423009153895707 \tabularnewline
16 & -0.054999335030163 \tabularnewline
\hline
\end{tabular}
%Source: https://freestatistics.org/blog/index.php?pk=35815&T=1

[TABLE]
[ROW][C]Cross Correlation Function[/C][/ROW]
[ROW][C]Parameter[/C][C]Value[/C][/ROW]
[ROW][C]Box-Cox transformation parameter (lambda) of X series[/C][C]1[/C][/ROW]
[ROW][C]Degree of non-seasonal differencing (d) of X series[/C][C]1[/C][/ROW]
[ROW][C]Degree of seasonal differencing (D) of X series[/C][C]0[/C][/ROW]
[ROW][C]Seasonal Period (s)[/C][C]12[/C][/ROW]
[ROW][C]Box-Cox transformation parameter (lambda) of Y series[/C][C]1[/C][/ROW]
[ROW][C]Degree of non-seasonal differencing (d) of Y series[/C][C]0[/C][/ROW]
[ROW][C]Degree of seasonal differencing (D) of Y series[/C][C]0[/C][/ROW]
[ROW][C]k[/C][C]rho(Y[t],X[t+k])[/C][/ROW]
[ROW][C]-16[/C][C]0.258608728652453[/C][/ROW]
[ROW][C]-15[/C][C]0.304965613829231[/C][/ROW]
[ROW][C]-14[/C][C]0.301754362667245[/C][/ROW]
[ROW][C]-13[/C][C]0.328868886258268[/C][/ROW]
[ROW][C]-12[/C][C]0.285225563821785[/C][/ROW]
[ROW][C]-11[/C][C]0.279473952885857[/C][/ROW]
[ROW][C]-10[/C][C]0.253384930056631[/C][/ROW]
[ROW][C]-9[/C][C]0.279067746626902[/C][/ROW]
[ROW][C]-8[/C][C]0.254852044673999[/C][/ROW]
[ROW][C]-7[/C][C]0.269351681542425[/C][/ROW]
[ROW][C]-6[/C][C]0.251293414386336[/C][/ROW]
[ROW][C]-5[/C][C]0.255478138100494[/C][/ROW]
[ROW][C]-4[/C][C]0.240972414499529[/C][/ROW]
[ROW][C]-3[/C][C]0.160821776720094[/C][/ROW]
[ROW][C]-2[/C][C]0.143821111163152[/C][/ROW]
[ROW][C]-1[/C][C]0.168943204696077[/C][/ROW]
[ROW][C]0[/C][C]0.138829796799157[/C][/ROW]
[ROW][C]1[/C][C]0.123187722427570[/C][/ROW]
[ROW][C]2[/C][C]0.143205031820615[/C][/ROW]
[ROW][C]3[/C][C]0.119253802001625[/C][/ROW]
[ROW][C]4[/C][C]0.10984352551637[/C][/ROW]
[ROW][C]5[/C][C]0.118930865267670[/C][/ROW]
[ROW][C]6[/C][C]0.0939227361082311[/C][/ROW]
[ROW][C]7[/C][C]0.0685659507717416[/C][/ROW]
[ROW][C]8[/C][C]0.0640240063777169[/C][/ROW]
[ROW][C]9[/C][C]0.0570540636014244[/C][/ROW]
[ROW][C]10[/C][C]0.0326825472181912[/C][/ROW]
[ROW][C]11[/C][C]0.0215075556909041[/C][/ROW]
[ROW][C]12[/C][C]0.0109500938230297[/C][/ROW]
[ROW][C]13[/C][C]-0.0214406214978112[/C][/ROW]
[ROW][C]14[/C][C]-0.0356564237203083[/C][/ROW]
[ROW][C]15[/C][C]-0.0423009153895707[/C][/ROW]
[ROW][C]16[/C][C]-0.054999335030163[/C][/ROW]
[/TABLE]
Source: https://freestatistics.org/blog/index.php?pk=35815&T=1

Globally Unique Identifier (entire table): ba.freestatistics.org/blog/index.php?pk=35815&T=1

As an alternative you can also use a QR Code:  

The GUIDs for individual cells are displayed in the table below:

Cross Correlation Function
ParameterValue
Box-Cox transformation parameter (lambda) of X series1
Degree of non-seasonal differencing (d) of X series1
Degree of seasonal differencing (D) of X series0
Seasonal Period (s)12
Box-Cox transformation parameter (lambda) of Y series1
Degree of non-seasonal differencing (d) of Y series0
Degree of seasonal differencing (D) of Y series0
krho(Y[t],X[t+k])
-160.258608728652453
-150.304965613829231
-140.301754362667245
-130.328868886258268
-120.285225563821785
-110.279473952885857
-100.253384930056631
-90.279067746626902
-80.254852044673999
-70.269351681542425
-60.251293414386336
-50.255478138100494
-40.240972414499529
-30.160821776720094
-20.143821111163152
-10.168943204696077
00.138829796799157
10.123187722427570
20.143205031820615
30.119253802001625
40.10984352551637
50.118930865267670
60.0939227361082311
70.0685659507717416
80.0640240063777169
90.0570540636014244
100.0326825472181912
110.0215075556909041
120.0109500938230297
13-0.0214406214978112
14-0.0356564237203083
15-0.0423009153895707
16-0.054999335030163


Parameters (Session):
par1 = 1 ; par2 = 1 ; par3 = 0 ; par4 = 12 ; par5 = 1 ; par6 = 0 ; par7 = 0 ;
Parameters (R input):
par1 = 1 ; par2 = 1 ; par3 = 0 ; par4 = 12 ; par5 = 1 ; par6 = 0 ; par7 = 0 ;
R code (references can be found in the software module):
par1 <- as.numeric(par1)
par2 <- as.numeric(par2)
par3 <- as.numeric(par3)
par4 <- as.numeric(par4)
par5 <- as.numeric(par5)
par6 <- as.numeric(par6)
par7 <- as.numeric(par7)
if (par1 == 0) {
x <- log(x)
} else {
x <- (x ^ par1 - 1) / par1
}
if (par5 == 0) {
y <- log(y)
} else {
y <- (y ^ par5 - 1) / par5
}
if (par2 > 0) x <- diff(x,lag=1,difference=par2)
if (par6 > 0) y <- diff(y,lag=1,difference=par6)
if (par3 > 0) x <- diff(x,lag=par4,difference=par3)
if (par7 > 0) y <- diff(y,lag=par4,difference=par7)
x
y
bitmap(file='test1.png')
(r <- ccf(x,y,main='Cross Correlation Function',ylab='CCF',xlab='Lag (k)'))
dev.off()
load(file='createtable')
a<-table.start()
a<-table.row.start(a)
a<-table.element(a,'Cross Correlation Function',2,TRUE)
a<-table.row.end(a)
a<-table.row.start(a)
a<-table.element(a,'Parameter',header=TRUE)
a<-table.element(a,'Value',header=TRUE)
a<-table.row.end(a)
a<-table.row.start(a)
a<-table.element(a,'Box-Cox transformation parameter (lambda) of X series',header=TRUE)
a<-table.element(a,par1)
a<-table.row.end(a)
a<-table.row.start(a)
a<-table.element(a,'Degree of non-seasonal differencing (d) of X series',header=TRUE)
a<-table.element(a,par2)
a<-table.row.end(a)
a<-table.row.start(a)
a<-table.element(a,'Degree of seasonal differencing (D) of X series',header=TRUE)
a<-table.element(a,par3)
a<-table.row.end(a)
a<-table.row.start(a)
a<-table.element(a,'Seasonal Period (s)',header=TRUE)
a<-table.element(a,par4)
a<-table.row.end(a)
a<-table.row.start(a)
a<-table.element(a,'Box-Cox transformation parameter (lambda) of Y series',header=TRUE)
a<-table.element(a,par5)
a<-table.row.end(a)
a<-table.row.start(a)
a<-table.element(a,'Degree of non-seasonal differencing (d) of Y series',header=TRUE)
a<-table.element(a,par6)
a<-table.row.end(a)
a<-table.row.start(a)
a<-table.element(a,'Degree of seasonal differencing (D) of Y series',header=TRUE)
a<-table.element(a,par7)
a<-table.row.end(a)
a<-table.row.start(a)
a<-table.element(a,'k',header=TRUE)
a<-table.element(a,'rho(Y[t],X[t+k])',header=TRUE)
a<-table.row.end(a)
mylength <- length(r$acf)
myhalf <- floor((mylength-1)/2)
for (i in 1:mylength) {
a<-table.row.start(a)
a<-table.element(a,i-myhalf-1,header=TRUE)
a<-table.element(a,r$acf[i])
a<-table.row.end(a)
}
a<-table.end(a)
table.save(a,file='mytable.tab')