Free Statistics

of Irreproducible Research!

Author's title

Author*Unverified author*
R Software Modulerwasp_autocorrelation.wasp
Title produced by software(Partial) Autocorrelation Function
Date of computationSun, 21 Dec 2008 12:23:41 -0700
Cite this page as followsStatistical Computations at FreeStatistics.org, Office for Research Development and Education, URL https://freestatistics.org/blog/index.php?v=date/2008/Dec/21/t1229887440osk28i6zdivg87w.htm/, Retrieved Fri, 17 May 2024 07:01:35 +0000
Statistical Computations at FreeStatistics.org, Office for Research Development and Education, URL https://freestatistics.org/blog/index.php?pk=35780, Retrieved Fri, 17 May 2024 07:01:35 +0000
QR Codes:

Original text written by user:
IsPrivate?No (this computation is public)
User-defined keywords
Estimated Impact155
Family? (F = Feedback message, R = changed R code, M = changed R Module, P = changed Parameters, D = changed Data)
-     [Standard Deviation-Mean Plot] [TAAK] [2008-12-16 21:20:43] [f3161d5a04a14312cd010aa8f92941cc]
- RMPD    [(Partial) Autocorrelation Function] [htfhfg] [2008-12-21 19:23:41] [7a2afff08a618fdf6611a1bb6e1c3da4] [Current]
Feedback Forum

Post a new message
Dataseries X:
485
464
460
467
460
448
443
436
431
484
510
513
503
471
471
476
475
470
461
455
456
517
525
523
519
509
512
519
517
510
509
501
507
569
580
578
565
547
555
562
561
555
544
537
543
594
611
613
611
594
595
591
589
584
573
567
569
621
629
628
612
595
597
593
590
580
574
573
573
620
626
620
588
566
557
561
549
532
526
511
499
555
565
542
527
510
514
517
508
493
490
469
478
528


Summary of computational transaction
Raw Inputview raw input (R code)
Raw Outputview raw output of R engine
Computing time1 seconds
R Server'George Udny Yule' @ 72.249.76.132

\begin{tabular}{lllllllll}
\hline
Summary of computational transaction \tabularnewline
Raw Input & view raw input (R code)  \tabularnewline
Raw Output & view raw output of R engine  \tabularnewline
Computing time & 1 seconds \tabularnewline
R Server & 'George Udny Yule' @ 72.249.76.132 \tabularnewline
\hline
\end{tabular}
%Source: https://freestatistics.org/blog/index.php?pk=35780&T=0

[TABLE]
[ROW][C]Summary of computational transaction[/C][/ROW]
[ROW][C]Raw Input[/C][C]view raw input (R code) [/C][/ROW]
[ROW][C]Raw Output[/C][C]view raw output of R engine [/C][/ROW]
[ROW][C]Computing time[/C][C]1 seconds[/C][/ROW]
[ROW][C]R Server[/C][C]'George Udny Yule' @ 72.249.76.132[/C][/ROW]
[/TABLE]
Source: https://freestatistics.org/blog/index.php?pk=35780&T=0

Globally Unique Identifier (entire table): ba.freestatistics.org/blog/index.php?pk=35780&T=0

As an alternative you can also use a QR Code:  

The GUIDs for individual cells are displayed in the table below:

Summary of computational transaction
Raw Inputview raw input (R code)
Raw Outputview raw output of R engine
Computing time1 seconds
R Server'George Udny Yule' @ 72.249.76.132


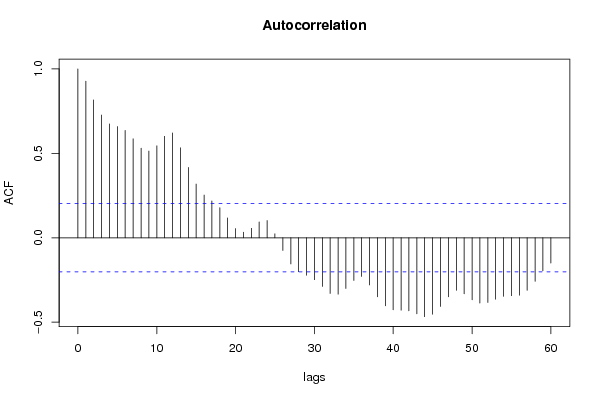
Autocorrelation Function
Time lag kACF(k)T-STATP-value
10.9278618.99590
20.8167467.91860
30.7266677.04530
40.6745166.53970
50.658886.38810
60.6358196.16450
70.5865445.68680
80.5305065.14341e-06
90.513994.98331e-06
100.5446935.2810
110.6007525.82450
120.6212466.02320
130.532995.16751e-06
140.4164614.03775.5e-05
150.3181533.08460.001338
160.2529952.45290.008008
170.2184892.11830.018392
180.1783811.72950.043504
190.1177131.14130.128329
200.0548570.53190.298039
210.0329640.31960.374989
220.0558150.54110.294842
230.0937250.90870.182918
240.1018380.98740.163
250.0235960.22880.40977
26-0.075038-0.72750.234359
27-0.154546-1.49840.068693
28-0.201004-1.94880.02715
29-0.221647-2.14890.017104
30-0.248242-2.40680.009024
31-0.288398-2.79610.003136
32-0.32969-3.19650.000948
33-0.334209-3.24030.000826
34-0.299889-2.90750.002272
35-0.252342-2.44650.008141
36-0.228524-2.21560.014566
37-0.279163-2.70660.004037
38-0.349523-3.38870.000514
39-0.402827-3.90568.8e-05
40-0.426254-4.13273.9e-05
41-0.428391-4.15343.6e-05
42-0.43278-4.1963.1e-05
43-0.449864-4.36161.7e-05
44-0.467013-4.52799e-06
45-0.452086-4.38311.5e-05
46-0.406912-3.94527.7e-05
47-0.349493-3.38850.000514
48-0.310817-3.01350.00166
49-0.331603-3.2150.000894
50-0.367244-3.56060.000291
51-0.386689-3.74910.000153
52-0.383229-3.71550.000172
53-0.363965-3.52880.000324
54-0.346314-3.35760.000568
55-0.342944-3.3250.000631
56-0.339562-3.29220.000701
57-0.310759-3.01290.001662
58-0.258031-2.50170.007044
59-0.195735-1.89770.030401
60-0.149727-1.45170.074963

\begin{tabular}{lllllllll}
\hline
Autocorrelation Function \tabularnewline
Time lag k & ACF(k) & T-STAT & P-value \tabularnewline
1 & 0.927861 & 8.9959 & 0 \tabularnewline
2 & 0.816746 & 7.9186 & 0 \tabularnewline
3 & 0.726667 & 7.0453 & 0 \tabularnewline
4 & 0.674516 & 6.5397 & 0 \tabularnewline
5 & 0.65888 & 6.3881 & 0 \tabularnewline
6 & 0.635819 & 6.1645 & 0 \tabularnewline
7 & 0.586544 & 5.6868 & 0 \tabularnewline
8 & 0.530506 & 5.1434 & 1e-06 \tabularnewline
9 & 0.51399 & 4.9833 & 1e-06 \tabularnewline
10 & 0.544693 & 5.281 & 0 \tabularnewline
11 & 0.600752 & 5.8245 & 0 \tabularnewline
12 & 0.621246 & 6.0232 & 0 \tabularnewline
13 & 0.53299 & 5.1675 & 1e-06 \tabularnewline
14 & 0.416461 & 4.0377 & 5.5e-05 \tabularnewline
15 & 0.318153 & 3.0846 & 0.001338 \tabularnewline
16 & 0.252995 & 2.4529 & 0.008008 \tabularnewline
17 & 0.218489 & 2.1183 & 0.018392 \tabularnewline
18 & 0.178381 & 1.7295 & 0.043504 \tabularnewline
19 & 0.117713 & 1.1413 & 0.128329 \tabularnewline
20 & 0.054857 & 0.5319 & 0.298039 \tabularnewline
21 & 0.032964 & 0.3196 & 0.374989 \tabularnewline
22 & 0.055815 & 0.5411 & 0.294842 \tabularnewline
23 & 0.093725 & 0.9087 & 0.182918 \tabularnewline
24 & 0.101838 & 0.9874 & 0.163 \tabularnewline
25 & 0.023596 & 0.2288 & 0.40977 \tabularnewline
26 & -0.075038 & -0.7275 & 0.234359 \tabularnewline
27 & -0.154546 & -1.4984 & 0.068693 \tabularnewline
28 & -0.201004 & -1.9488 & 0.02715 \tabularnewline
29 & -0.221647 & -2.1489 & 0.017104 \tabularnewline
30 & -0.248242 & -2.4068 & 0.009024 \tabularnewline
31 & -0.288398 & -2.7961 & 0.003136 \tabularnewline
32 & -0.32969 & -3.1965 & 0.000948 \tabularnewline
33 & -0.334209 & -3.2403 & 0.000826 \tabularnewline
34 & -0.299889 & -2.9075 & 0.002272 \tabularnewline
35 & -0.252342 & -2.4465 & 0.008141 \tabularnewline
36 & -0.228524 & -2.2156 & 0.014566 \tabularnewline
37 & -0.279163 & -2.7066 & 0.004037 \tabularnewline
38 & -0.349523 & -3.3887 & 0.000514 \tabularnewline
39 & -0.402827 & -3.9056 & 8.8e-05 \tabularnewline
40 & -0.426254 & -4.1327 & 3.9e-05 \tabularnewline
41 & -0.428391 & -4.1534 & 3.6e-05 \tabularnewline
42 & -0.43278 & -4.196 & 3.1e-05 \tabularnewline
43 & -0.449864 & -4.3616 & 1.7e-05 \tabularnewline
44 & -0.467013 & -4.5279 & 9e-06 \tabularnewline
45 & -0.452086 & -4.3831 & 1.5e-05 \tabularnewline
46 & -0.406912 & -3.9452 & 7.7e-05 \tabularnewline
47 & -0.349493 & -3.3885 & 0.000514 \tabularnewline
48 & -0.310817 & -3.0135 & 0.00166 \tabularnewline
49 & -0.331603 & -3.215 & 0.000894 \tabularnewline
50 & -0.367244 & -3.5606 & 0.000291 \tabularnewline
51 & -0.386689 & -3.7491 & 0.000153 \tabularnewline
52 & -0.383229 & -3.7155 & 0.000172 \tabularnewline
53 & -0.363965 & -3.5288 & 0.000324 \tabularnewline
54 & -0.346314 & -3.3576 & 0.000568 \tabularnewline
55 & -0.342944 & -3.325 & 0.000631 \tabularnewline
56 & -0.339562 & -3.2922 & 0.000701 \tabularnewline
57 & -0.310759 & -3.0129 & 0.001662 \tabularnewline
58 & -0.258031 & -2.5017 & 0.007044 \tabularnewline
59 & -0.195735 & -1.8977 & 0.030401 \tabularnewline
60 & -0.149727 & -1.4517 & 0.074963 \tabularnewline
\hline
\end{tabular}
%Source: https://freestatistics.org/blog/index.php?pk=35780&T=1

[TABLE]
[ROW][C]Autocorrelation Function[/C][/ROW]
[ROW][C]Time lag k[/C][C]ACF(k)[/C][C]T-STAT[/C][C]P-value[/C][/ROW]
[ROW][C]1[/C][C]0.927861[/C][C]8.9959[/C][C]0[/C][/ROW]
[ROW][C]2[/C][C]0.816746[/C][C]7.9186[/C][C]0[/C][/ROW]
[ROW][C]3[/C][C]0.726667[/C][C]7.0453[/C][C]0[/C][/ROW]
[ROW][C]4[/C][C]0.674516[/C][C]6.5397[/C][C]0[/C][/ROW]
[ROW][C]5[/C][C]0.65888[/C][C]6.3881[/C][C]0[/C][/ROW]
[ROW][C]6[/C][C]0.635819[/C][C]6.1645[/C][C]0[/C][/ROW]
[ROW][C]7[/C][C]0.586544[/C][C]5.6868[/C][C]0[/C][/ROW]
[ROW][C]8[/C][C]0.530506[/C][C]5.1434[/C][C]1e-06[/C][/ROW]
[ROW][C]9[/C][C]0.51399[/C][C]4.9833[/C][C]1e-06[/C][/ROW]
[ROW][C]10[/C][C]0.544693[/C][C]5.281[/C][C]0[/C][/ROW]
[ROW][C]11[/C][C]0.600752[/C][C]5.8245[/C][C]0[/C][/ROW]
[ROW][C]12[/C][C]0.621246[/C][C]6.0232[/C][C]0[/C][/ROW]
[ROW][C]13[/C][C]0.53299[/C][C]5.1675[/C][C]1e-06[/C][/ROW]
[ROW][C]14[/C][C]0.416461[/C][C]4.0377[/C][C]5.5e-05[/C][/ROW]
[ROW][C]15[/C][C]0.318153[/C][C]3.0846[/C][C]0.001338[/C][/ROW]
[ROW][C]16[/C][C]0.252995[/C][C]2.4529[/C][C]0.008008[/C][/ROW]
[ROW][C]17[/C][C]0.218489[/C][C]2.1183[/C][C]0.018392[/C][/ROW]
[ROW][C]18[/C][C]0.178381[/C][C]1.7295[/C][C]0.043504[/C][/ROW]
[ROW][C]19[/C][C]0.117713[/C][C]1.1413[/C][C]0.128329[/C][/ROW]
[ROW][C]20[/C][C]0.054857[/C][C]0.5319[/C][C]0.298039[/C][/ROW]
[ROW][C]21[/C][C]0.032964[/C][C]0.3196[/C][C]0.374989[/C][/ROW]
[ROW][C]22[/C][C]0.055815[/C][C]0.5411[/C][C]0.294842[/C][/ROW]
[ROW][C]23[/C][C]0.093725[/C][C]0.9087[/C][C]0.182918[/C][/ROW]
[ROW][C]24[/C][C]0.101838[/C][C]0.9874[/C][C]0.163[/C][/ROW]
[ROW][C]25[/C][C]0.023596[/C][C]0.2288[/C][C]0.40977[/C][/ROW]
[ROW][C]26[/C][C]-0.075038[/C][C]-0.7275[/C][C]0.234359[/C][/ROW]
[ROW][C]27[/C][C]-0.154546[/C][C]-1.4984[/C][C]0.068693[/C][/ROW]
[ROW][C]28[/C][C]-0.201004[/C][C]-1.9488[/C][C]0.02715[/C][/ROW]
[ROW][C]29[/C][C]-0.221647[/C][C]-2.1489[/C][C]0.017104[/C][/ROW]
[ROW][C]30[/C][C]-0.248242[/C][C]-2.4068[/C][C]0.009024[/C][/ROW]
[ROW][C]31[/C][C]-0.288398[/C][C]-2.7961[/C][C]0.003136[/C][/ROW]
[ROW][C]32[/C][C]-0.32969[/C][C]-3.1965[/C][C]0.000948[/C][/ROW]
[ROW][C]33[/C][C]-0.334209[/C][C]-3.2403[/C][C]0.000826[/C][/ROW]
[ROW][C]34[/C][C]-0.299889[/C][C]-2.9075[/C][C]0.002272[/C][/ROW]
[ROW][C]35[/C][C]-0.252342[/C][C]-2.4465[/C][C]0.008141[/C][/ROW]
[ROW][C]36[/C][C]-0.228524[/C][C]-2.2156[/C][C]0.014566[/C][/ROW]
[ROW][C]37[/C][C]-0.279163[/C][C]-2.7066[/C][C]0.004037[/C][/ROW]
[ROW][C]38[/C][C]-0.349523[/C][C]-3.3887[/C][C]0.000514[/C][/ROW]
[ROW][C]39[/C][C]-0.402827[/C][C]-3.9056[/C][C]8.8e-05[/C][/ROW]
[ROW][C]40[/C][C]-0.426254[/C][C]-4.1327[/C][C]3.9e-05[/C][/ROW]
[ROW][C]41[/C][C]-0.428391[/C][C]-4.1534[/C][C]3.6e-05[/C][/ROW]
[ROW][C]42[/C][C]-0.43278[/C][C]-4.196[/C][C]3.1e-05[/C][/ROW]
[ROW][C]43[/C][C]-0.449864[/C][C]-4.3616[/C][C]1.7e-05[/C][/ROW]
[ROW][C]44[/C][C]-0.467013[/C][C]-4.5279[/C][C]9e-06[/C][/ROW]
[ROW][C]45[/C][C]-0.452086[/C][C]-4.3831[/C][C]1.5e-05[/C][/ROW]
[ROW][C]46[/C][C]-0.406912[/C][C]-3.9452[/C][C]7.7e-05[/C][/ROW]
[ROW][C]47[/C][C]-0.349493[/C][C]-3.3885[/C][C]0.000514[/C][/ROW]
[ROW][C]48[/C][C]-0.310817[/C][C]-3.0135[/C][C]0.00166[/C][/ROW]
[ROW][C]49[/C][C]-0.331603[/C][C]-3.215[/C][C]0.000894[/C][/ROW]
[ROW][C]50[/C][C]-0.367244[/C][C]-3.5606[/C][C]0.000291[/C][/ROW]
[ROW][C]51[/C][C]-0.386689[/C][C]-3.7491[/C][C]0.000153[/C][/ROW]
[ROW][C]52[/C][C]-0.383229[/C][C]-3.7155[/C][C]0.000172[/C][/ROW]
[ROW][C]53[/C][C]-0.363965[/C][C]-3.5288[/C][C]0.000324[/C][/ROW]
[ROW][C]54[/C][C]-0.346314[/C][C]-3.3576[/C][C]0.000568[/C][/ROW]
[ROW][C]55[/C][C]-0.342944[/C][C]-3.325[/C][C]0.000631[/C][/ROW]
[ROW][C]56[/C][C]-0.339562[/C][C]-3.2922[/C][C]0.000701[/C][/ROW]
[ROW][C]57[/C][C]-0.310759[/C][C]-3.0129[/C][C]0.001662[/C][/ROW]
[ROW][C]58[/C][C]-0.258031[/C][C]-2.5017[/C][C]0.007044[/C][/ROW]
[ROW][C]59[/C][C]-0.195735[/C][C]-1.8977[/C][C]0.030401[/C][/ROW]
[ROW][C]60[/C][C]-0.149727[/C][C]-1.4517[/C][C]0.074963[/C][/ROW]
[/TABLE]
Source: https://freestatistics.org/blog/index.php?pk=35780&T=1

Globally Unique Identifier (entire table): ba.freestatistics.org/blog/index.php?pk=35780&T=1

As an alternative you can also use a QR Code:  

The GUIDs for individual cells are displayed in the table below:

Autocorrelation Function
Time lag kACF(k)T-STATP-value
10.9278618.99590
20.8167467.91860
30.7266677.04530
40.6745166.53970
50.658886.38810
60.6358196.16450
70.5865445.68680
80.5305065.14341e-06
90.513994.98331e-06
100.5446935.2810
110.6007525.82450
120.6212466.02320
130.532995.16751e-06
140.4164614.03775.5e-05
150.3181533.08460.001338
160.2529952.45290.008008
170.2184892.11830.018392
180.1783811.72950.043504
190.1177131.14130.128329
200.0548570.53190.298039
210.0329640.31960.374989
220.0558150.54110.294842
230.0937250.90870.182918
240.1018380.98740.163
250.0235960.22880.40977
26-0.075038-0.72750.234359
27-0.154546-1.49840.068693
28-0.201004-1.94880.02715
29-0.221647-2.14890.017104
30-0.248242-2.40680.009024
31-0.288398-2.79610.003136
32-0.32969-3.19650.000948
33-0.334209-3.24030.000826
34-0.299889-2.90750.002272
35-0.252342-2.44650.008141
36-0.228524-2.21560.014566
37-0.279163-2.70660.004037
38-0.349523-3.38870.000514
39-0.402827-3.90568.8e-05
40-0.426254-4.13273.9e-05
41-0.428391-4.15343.6e-05
42-0.43278-4.1963.1e-05
43-0.449864-4.36161.7e-05
44-0.467013-4.52799e-06
45-0.452086-4.38311.5e-05
46-0.406912-3.94527.7e-05
47-0.349493-3.38850.000514
48-0.310817-3.01350.00166
49-0.331603-3.2150.000894
50-0.367244-3.56060.000291
51-0.386689-3.74910.000153
52-0.383229-3.71550.000172
53-0.363965-3.52880.000324
54-0.346314-3.35760.000568
55-0.342944-3.3250.000631
56-0.339562-3.29220.000701
57-0.310759-3.01290.001662
58-0.258031-2.50170.007044
59-0.195735-1.89770.030401
60-0.149727-1.45170.074963


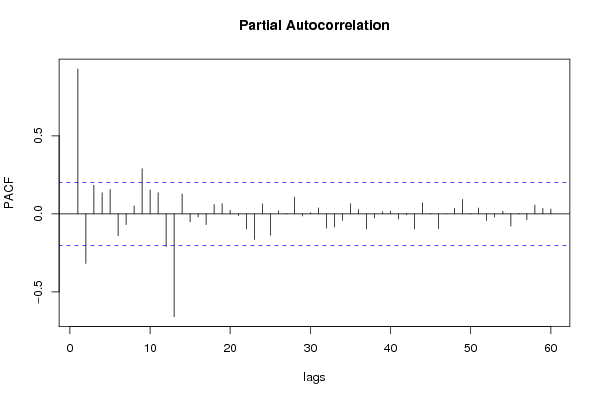
Partial Autocorrelation Function
Time lag kPACF(k)T-STATP-value
10.9278618.99590
2-0.317673-3.080.001357
30.1827851.77220.039803
40.1345971.3050.097545
50.1563261.51560.066483
6-0.14089-1.3660.087603
7-0.068573-0.66480.253891
80.0505610.49020.312564
90.2889692.80170.003087
100.1533751.4870.070177
110.1354281.3130.096185
12-0.210045-2.03650.022259
13-0.658564-6.3850
140.1266341.22780.111301
15-0.050843-0.49290.311601
16-0.020221-0.19610.422495
17-0.06889-0.66790.252914
180.0593650.57560.283142
190.0648720.6290.265453
200.0236480.22930.409575
21-0.010886-0.10550.458085
22-0.097223-0.94260.174147
23-0.164112-1.59110.057469
240.063090.61170.271113
25-0.137865-1.33670.092281
260.0181580.1760.430319
27-0.000849-0.00820.496726
280.1076461.04370.149657
29-0.013165-0.12760.449353
300.0065420.06340.47478
310.0374960.36350.358512
32-0.090989-0.88220.189967
33-0.085099-0.82510.205712
34-0.041593-0.40330.343835
350.0640.62050.268213
360.0282530.27390.392371
37-0.096916-0.93960.174907
38-0.026546-0.25740.398725
390.0136730.13260.447409
400.0164620.15960.436765
41-0.033678-0.32650.372378
42-0.006702-0.0650.474164
43-0.096436-0.9350.176096
440.0706560.6850.247504
45-0.00187-0.01810.492787
46-0.095297-0.92390.178941
47-9.7e-05-9e-040.499627
480.0351550.34080.366992
490.0922550.89440.186683
500.0028630.02780.488956
510.0370790.35950.360018
52-0.043392-0.42070.337468
53-0.02022-0.1960.422502
540.0171370.16610.4342
55-0.078077-0.7570.225476
560.003160.03060.487813
57-0.038656-0.37480.354334
580.05590.5420.294562
590.0346940.33640.36867
600.0307020.29770.383306

\begin{tabular}{lllllllll}
\hline
Partial Autocorrelation Function \tabularnewline
Time lag k & PACF(k) & T-STAT & P-value \tabularnewline
1 & 0.927861 & 8.9959 & 0 \tabularnewline
2 & -0.317673 & -3.08 & 0.001357 \tabularnewline
3 & 0.182785 & 1.7722 & 0.039803 \tabularnewline
4 & 0.134597 & 1.305 & 0.097545 \tabularnewline
5 & 0.156326 & 1.5156 & 0.066483 \tabularnewline
6 & -0.14089 & -1.366 & 0.087603 \tabularnewline
7 & -0.068573 & -0.6648 & 0.253891 \tabularnewline
8 & 0.050561 & 0.4902 & 0.312564 \tabularnewline
9 & 0.288969 & 2.8017 & 0.003087 \tabularnewline
10 & 0.153375 & 1.487 & 0.070177 \tabularnewline
11 & 0.135428 & 1.313 & 0.096185 \tabularnewline
12 & -0.210045 & -2.0365 & 0.022259 \tabularnewline
13 & -0.658564 & -6.385 & 0 \tabularnewline
14 & 0.126634 & 1.2278 & 0.111301 \tabularnewline
15 & -0.050843 & -0.4929 & 0.311601 \tabularnewline
16 & -0.020221 & -0.1961 & 0.422495 \tabularnewline
17 & -0.06889 & -0.6679 & 0.252914 \tabularnewline
18 & 0.059365 & 0.5756 & 0.283142 \tabularnewline
19 & 0.064872 & 0.629 & 0.265453 \tabularnewline
20 & 0.023648 & 0.2293 & 0.409575 \tabularnewline
21 & -0.010886 & -0.1055 & 0.458085 \tabularnewline
22 & -0.097223 & -0.9426 & 0.174147 \tabularnewline
23 & -0.164112 & -1.5911 & 0.057469 \tabularnewline
24 & 0.06309 & 0.6117 & 0.271113 \tabularnewline
25 & -0.137865 & -1.3367 & 0.092281 \tabularnewline
26 & 0.018158 & 0.176 & 0.430319 \tabularnewline
27 & -0.000849 & -0.0082 & 0.496726 \tabularnewline
28 & 0.107646 & 1.0437 & 0.149657 \tabularnewline
29 & -0.013165 & -0.1276 & 0.449353 \tabularnewline
30 & 0.006542 & 0.0634 & 0.47478 \tabularnewline
31 & 0.037496 & 0.3635 & 0.358512 \tabularnewline
32 & -0.090989 & -0.8822 & 0.189967 \tabularnewline
33 & -0.085099 & -0.8251 & 0.205712 \tabularnewline
34 & -0.041593 & -0.4033 & 0.343835 \tabularnewline
35 & 0.064 & 0.6205 & 0.268213 \tabularnewline
36 & 0.028253 & 0.2739 & 0.392371 \tabularnewline
37 & -0.096916 & -0.9396 & 0.174907 \tabularnewline
38 & -0.026546 & -0.2574 & 0.398725 \tabularnewline
39 & 0.013673 & 0.1326 & 0.447409 \tabularnewline
40 & 0.016462 & 0.1596 & 0.436765 \tabularnewline
41 & -0.033678 & -0.3265 & 0.372378 \tabularnewline
42 & -0.006702 & -0.065 & 0.474164 \tabularnewline
43 & -0.096436 & -0.935 & 0.176096 \tabularnewline
44 & 0.070656 & 0.685 & 0.247504 \tabularnewline
45 & -0.00187 & -0.0181 & 0.492787 \tabularnewline
46 & -0.095297 & -0.9239 & 0.178941 \tabularnewline
47 & -9.7e-05 & -9e-04 & 0.499627 \tabularnewline
48 & 0.035155 & 0.3408 & 0.366992 \tabularnewline
49 & 0.092255 & 0.8944 & 0.186683 \tabularnewline
50 & 0.002863 & 0.0278 & 0.488956 \tabularnewline
51 & 0.037079 & 0.3595 & 0.360018 \tabularnewline
52 & -0.043392 & -0.4207 & 0.337468 \tabularnewline
53 & -0.02022 & -0.196 & 0.422502 \tabularnewline
54 & 0.017137 & 0.1661 & 0.4342 \tabularnewline
55 & -0.078077 & -0.757 & 0.225476 \tabularnewline
56 & 0.00316 & 0.0306 & 0.487813 \tabularnewline
57 & -0.038656 & -0.3748 & 0.354334 \tabularnewline
58 & 0.0559 & 0.542 & 0.294562 \tabularnewline
59 & 0.034694 & 0.3364 & 0.36867 \tabularnewline
60 & 0.030702 & 0.2977 & 0.383306 \tabularnewline
\hline
\end{tabular}
%Source: https://freestatistics.org/blog/index.php?pk=35780&T=2

[TABLE]
[ROW][C]Partial Autocorrelation Function[/C][/ROW]
[ROW][C]Time lag k[/C][C]PACF(k)[/C][C]T-STAT[/C][C]P-value[/C][/ROW]
[ROW][C]1[/C][C]0.927861[/C][C]8.9959[/C][C]0[/C][/ROW]
[ROW][C]2[/C][C]-0.317673[/C][C]-3.08[/C][C]0.001357[/C][/ROW]
[ROW][C]3[/C][C]0.182785[/C][C]1.7722[/C][C]0.039803[/C][/ROW]
[ROW][C]4[/C][C]0.134597[/C][C]1.305[/C][C]0.097545[/C][/ROW]
[ROW][C]5[/C][C]0.156326[/C][C]1.5156[/C][C]0.066483[/C][/ROW]
[ROW][C]6[/C][C]-0.14089[/C][C]-1.366[/C][C]0.087603[/C][/ROW]
[ROW][C]7[/C][C]-0.068573[/C][C]-0.6648[/C][C]0.253891[/C][/ROW]
[ROW][C]8[/C][C]0.050561[/C][C]0.4902[/C][C]0.312564[/C][/ROW]
[ROW][C]9[/C][C]0.288969[/C][C]2.8017[/C][C]0.003087[/C][/ROW]
[ROW][C]10[/C][C]0.153375[/C][C]1.487[/C][C]0.070177[/C][/ROW]
[ROW][C]11[/C][C]0.135428[/C][C]1.313[/C][C]0.096185[/C][/ROW]
[ROW][C]12[/C][C]-0.210045[/C][C]-2.0365[/C][C]0.022259[/C][/ROW]
[ROW][C]13[/C][C]-0.658564[/C][C]-6.385[/C][C]0[/C][/ROW]
[ROW][C]14[/C][C]0.126634[/C][C]1.2278[/C][C]0.111301[/C][/ROW]
[ROW][C]15[/C][C]-0.050843[/C][C]-0.4929[/C][C]0.311601[/C][/ROW]
[ROW][C]16[/C][C]-0.020221[/C][C]-0.1961[/C][C]0.422495[/C][/ROW]
[ROW][C]17[/C][C]-0.06889[/C][C]-0.6679[/C][C]0.252914[/C][/ROW]
[ROW][C]18[/C][C]0.059365[/C][C]0.5756[/C][C]0.283142[/C][/ROW]
[ROW][C]19[/C][C]0.064872[/C][C]0.629[/C][C]0.265453[/C][/ROW]
[ROW][C]20[/C][C]0.023648[/C][C]0.2293[/C][C]0.409575[/C][/ROW]
[ROW][C]21[/C][C]-0.010886[/C][C]-0.1055[/C][C]0.458085[/C][/ROW]
[ROW][C]22[/C][C]-0.097223[/C][C]-0.9426[/C][C]0.174147[/C][/ROW]
[ROW][C]23[/C][C]-0.164112[/C][C]-1.5911[/C][C]0.057469[/C][/ROW]
[ROW][C]24[/C][C]0.06309[/C][C]0.6117[/C][C]0.271113[/C][/ROW]
[ROW][C]25[/C][C]-0.137865[/C][C]-1.3367[/C][C]0.092281[/C][/ROW]
[ROW][C]26[/C][C]0.018158[/C][C]0.176[/C][C]0.430319[/C][/ROW]
[ROW][C]27[/C][C]-0.000849[/C][C]-0.0082[/C][C]0.496726[/C][/ROW]
[ROW][C]28[/C][C]0.107646[/C][C]1.0437[/C][C]0.149657[/C][/ROW]
[ROW][C]29[/C][C]-0.013165[/C][C]-0.1276[/C][C]0.449353[/C][/ROW]
[ROW][C]30[/C][C]0.006542[/C][C]0.0634[/C][C]0.47478[/C][/ROW]
[ROW][C]31[/C][C]0.037496[/C][C]0.3635[/C][C]0.358512[/C][/ROW]
[ROW][C]32[/C][C]-0.090989[/C][C]-0.8822[/C][C]0.189967[/C][/ROW]
[ROW][C]33[/C][C]-0.085099[/C][C]-0.8251[/C][C]0.205712[/C][/ROW]
[ROW][C]34[/C][C]-0.041593[/C][C]-0.4033[/C][C]0.343835[/C][/ROW]
[ROW][C]35[/C][C]0.064[/C][C]0.6205[/C][C]0.268213[/C][/ROW]
[ROW][C]36[/C][C]0.028253[/C][C]0.2739[/C][C]0.392371[/C][/ROW]
[ROW][C]37[/C][C]-0.096916[/C][C]-0.9396[/C][C]0.174907[/C][/ROW]
[ROW][C]38[/C][C]-0.026546[/C][C]-0.2574[/C][C]0.398725[/C][/ROW]
[ROW][C]39[/C][C]0.013673[/C][C]0.1326[/C][C]0.447409[/C][/ROW]
[ROW][C]40[/C][C]0.016462[/C][C]0.1596[/C][C]0.436765[/C][/ROW]
[ROW][C]41[/C][C]-0.033678[/C][C]-0.3265[/C][C]0.372378[/C][/ROW]
[ROW][C]42[/C][C]-0.006702[/C][C]-0.065[/C][C]0.474164[/C][/ROW]
[ROW][C]43[/C][C]-0.096436[/C][C]-0.935[/C][C]0.176096[/C][/ROW]
[ROW][C]44[/C][C]0.070656[/C][C]0.685[/C][C]0.247504[/C][/ROW]
[ROW][C]45[/C][C]-0.00187[/C][C]-0.0181[/C][C]0.492787[/C][/ROW]
[ROW][C]46[/C][C]-0.095297[/C][C]-0.9239[/C][C]0.178941[/C][/ROW]
[ROW][C]47[/C][C]-9.7e-05[/C][C]-9e-04[/C][C]0.499627[/C][/ROW]
[ROW][C]48[/C][C]0.035155[/C][C]0.3408[/C][C]0.366992[/C][/ROW]
[ROW][C]49[/C][C]0.092255[/C][C]0.8944[/C][C]0.186683[/C][/ROW]
[ROW][C]50[/C][C]0.002863[/C][C]0.0278[/C][C]0.488956[/C][/ROW]
[ROW][C]51[/C][C]0.037079[/C][C]0.3595[/C][C]0.360018[/C][/ROW]
[ROW][C]52[/C][C]-0.043392[/C][C]-0.4207[/C][C]0.337468[/C][/ROW]
[ROW][C]53[/C][C]-0.02022[/C][C]-0.196[/C][C]0.422502[/C][/ROW]
[ROW][C]54[/C][C]0.017137[/C][C]0.1661[/C][C]0.4342[/C][/ROW]
[ROW][C]55[/C][C]-0.078077[/C][C]-0.757[/C][C]0.225476[/C][/ROW]
[ROW][C]56[/C][C]0.00316[/C][C]0.0306[/C][C]0.487813[/C][/ROW]
[ROW][C]57[/C][C]-0.038656[/C][C]-0.3748[/C][C]0.354334[/C][/ROW]
[ROW][C]58[/C][C]0.0559[/C][C]0.542[/C][C]0.294562[/C][/ROW]
[ROW][C]59[/C][C]0.034694[/C][C]0.3364[/C][C]0.36867[/C][/ROW]
[ROW][C]60[/C][C]0.030702[/C][C]0.2977[/C][C]0.383306[/C][/ROW]
[/TABLE]
Source: https://freestatistics.org/blog/index.php?pk=35780&T=2

Globally Unique Identifier (entire table): ba.freestatistics.org/blog/index.php?pk=35780&T=2

As an alternative you can also use a QR Code:  

The GUIDs for individual cells are displayed in the table below:

Partial Autocorrelation Function
Time lag kPACF(k)T-STATP-value
10.9278618.99590
2-0.317673-3.080.001357
30.1827851.77220.039803
40.1345971.3050.097545
50.1563261.51560.066483
6-0.14089-1.3660.087603
7-0.068573-0.66480.253891
80.0505610.49020.312564
90.2889692.80170.003087
100.1533751.4870.070177
110.1354281.3130.096185
12-0.210045-2.03650.022259
13-0.658564-6.3850
140.1266341.22780.111301
15-0.050843-0.49290.311601
16-0.020221-0.19610.422495
17-0.06889-0.66790.252914
180.0593650.57560.283142
190.0648720.6290.265453
200.0236480.22930.409575
21-0.010886-0.10550.458085
22-0.097223-0.94260.174147
23-0.164112-1.59110.057469
240.063090.61170.271113
25-0.137865-1.33670.092281
260.0181580.1760.430319
27-0.000849-0.00820.496726
280.1076461.04370.149657
29-0.013165-0.12760.449353
300.0065420.06340.47478
310.0374960.36350.358512
32-0.090989-0.88220.189967
33-0.085099-0.82510.205712
34-0.041593-0.40330.343835
350.0640.62050.268213
360.0282530.27390.392371
37-0.096916-0.93960.174907
38-0.026546-0.25740.398725
390.0136730.13260.447409
400.0164620.15960.436765
41-0.033678-0.32650.372378
42-0.006702-0.0650.474164
43-0.096436-0.9350.176096
440.0706560.6850.247504
45-0.00187-0.01810.492787
46-0.095297-0.92390.178941
47-9.7e-05-9e-040.499627
480.0351550.34080.366992
490.0922550.89440.186683
500.0028630.02780.488956
510.0370790.35950.360018
52-0.043392-0.42070.337468
53-0.02022-0.1960.422502
540.0171370.16610.4342
55-0.078077-0.7570.225476
560.003160.03060.487813
57-0.038656-0.37480.354334
580.05590.5420.294562
590.0346940.33640.36867
600.0307020.29770.383306


Parameters (Session):
par1 = 60 ; par2 = 1 ; par3 = 0 ; par4 = 0 ; par5 = 12 ;
Parameters (R input):
par1 = 60 ; par2 = 1 ; par3 = 0 ; par4 = 0 ; par5 = 12 ;
R code (references can be found in the software module):
if (par1 == 'Default') {
par1 = 10*log10(length(x))
} else {
par1 <- as.numeric(par1)
}
par2 <- as.numeric(par2)
par3 <- as.numeric(par3)
par4 <- as.numeric(par4)
par5 <- as.numeric(par5)
if (par2 == 0) {
x <- log(x)
} else {
x <- (x ^ par2 - 1) / par2
}
if (par3 > 0) x <- diff(x,lag=1,difference=par3)
if (par4 > 0) x <- diff(x,lag=par5,difference=par4)
bitmap(file='pic1.png')
racf <- acf(x,par1,main='Autocorrelation',xlab='lags',ylab='ACF')
dev.off()
bitmap(file='pic2.png')
rpacf <- pacf(x,par1,main='Partial Autocorrelation',xlab='lags',ylab='PACF')
dev.off()
(myacf <- c(racf$acf))
(mypacf <- c(rpacf$acf))
lengthx <- length(x)
sqrtn <- sqrt(lengthx)
load(file='createtable')
a<-table.start()
a<-table.row.start(a)
a<-table.element(a,'Autocorrelation Function',4,TRUE)
a<-table.row.end(a)
a<-table.row.start(a)
a<-table.element(a,'Time lag k',header=TRUE)
a<-table.element(a,hyperlink('basics.htm','ACF(k)','click here for more information about the Autocorrelation Function'),header=TRUE)
a<-table.element(a,'T-STAT',header=TRUE)
a<-table.element(a,'P-value',header=TRUE)
a<-table.row.end(a)
for (i in 2:(par1+1)) {
a<-table.row.start(a)
a<-table.element(a,i-1,header=TRUE)
a<-table.element(a,round(myacf[i],6))
mytstat <- myacf[i]*sqrtn
a<-table.element(a,round(mytstat,4))
a<-table.element(a,round(1-pt(abs(mytstat),lengthx),6))
a<-table.row.end(a)
}
a<-table.end(a)
table.save(a,file='mytable.tab')
a<-table.start()
a<-table.row.start(a)
a<-table.element(a,'Partial Autocorrelation Function',4,TRUE)
a<-table.row.end(a)
a<-table.row.start(a)
a<-table.element(a,'Time lag k',header=TRUE)
a<-table.element(a,hyperlink('basics.htm','PACF(k)','click here for more information about the Partial Autocorrelation Function'),header=TRUE)
a<-table.element(a,'T-STAT',header=TRUE)
a<-table.element(a,'P-value',header=TRUE)
a<-table.row.end(a)
for (i in 1:par1) {
a<-table.row.start(a)
a<-table.element(a,i,header=TRUE)
a<-table.element(a,round(mypacf[i],6))
mytstat <- mypacf[i]*sqrtn
a<-table.element(a,round(mytstat,4))
a<-table.element(a,round(1-pt(abs(mytstat),lengthx),6))
a<-table.row.end(a)
}
a<-table.end(a)
table.save(a,file='mytable1.tab')