Free Statistics
of Irreproducible Research!
Description of Statistical Computation | |||||||||||||||||||||||||||||||||||||||||
|---|---|---|---|---|---|---|---|---|---|---|---|---|---|---|---|---|---|---|---|---|---|---|---|---|---|---|---|---|---|---|---|---|---|---|---|---|---|---|---|---|---|
| Author's title | |||||||||||||||||||||||||||||||||||||||||
| Author | *Unverified author* | ||||||||||||||||||||||||||||||||||||||||
| R Software Module | rwasp_univariatedataseries.wasp | ||||||||||||||||||||||||||||||||||||||||
| Title produced by software | Univariate Data Series | ||||||||||||||||||||||||||||||||||||||||
| Date of computation | Sun, 21 Dec 2008 11:35:28 -0700 | ||||||||||||||||||||||||||||||||||||||||
| Cite this page as follows | Statistical Computations at FreeStatistics.org, Office for Research Development and Education, URL https://freestatistics.org/blog/index.php?v=date/2008/Dec/21/t1229884556lani86o057isty9.htm/, Retrieved Fri, 17 May 2024 05:45:46 +0000 | ||||||||||||||||||||||||||||||||||||||||
| Statistical Computations at FreeStatistics.org, Office for Research Development and Education, URL https://freestatistics.org/blog/index.php?pk=35742, Retrieved Fri, 17 May 2024 05:45:46 +0000 | |||||||||||||||||||||||||||||||||||||||||
| QR Codes: | |||||||||||||||||||||||||||||||||||||||||
|
| |||||||||||||||||||||||||||||||||||||||||
| Original text written by user: | |||||||||||||||||||||||||||||||||||||||||
| IsPrivate? | No (this computation is public) | ||||||||||||||||||||||||||||||||||||||||
| User-defined keywords | |||||||||||||||||||||||||||||||||||||||||
| Estimated Impact | 189 | ||||||||||||||||||||||||||||||||||||||||
Tree of Dependent Computations | |||||||||||||||||||||||||||||||||||||||||
| Family? (F = Feedback message, R = changed R code, M = changed R Module, P = changed Parameters, D = changed Data) | |||||||||||||||||||||||||||||||||||||||||
| - [Univariate Data Series] [Buitenlandse Hand...] [2008-10-13 22:33:57] [bd51eba1292ec8d03a55225bfbdeaf98] - PD [Univariate Data Series] [Tijdreeks - Food ...] [2008-12-10 08:38:14] [6f54f97492451bf8edc5dd186465ee4a] - PD [Univariate Data Series] [Belgian Export: F...] [2008-12-21 18:32:05] [d7f17de546c455a6cc3e244ffe795733] - PD [Univariate Data Series] [Belgian Export: D...] [2008-12-21 18:33:47] [d7f17de546c455a6cc3e244ffe795733] - PD [Univariate Data Series] [Belgian Export: N...] [2008-12-21 18:35:28] [4ef5c191fa12c0a7497d8cf4a02b2cfe] [Current] | |||||||||||||||||||||||||||||||||||||||||
| Feedback Forum | |||||||||||||||||||||||||||||||||||||||||
Post a new message | |||||||||||||||||||||||||||||||||||||||||
Dataset | |||||||||||||||||||||||||||||||||||||||||
| Dataseries X: | |||||||||||||||||||||||||||||||||||||||||
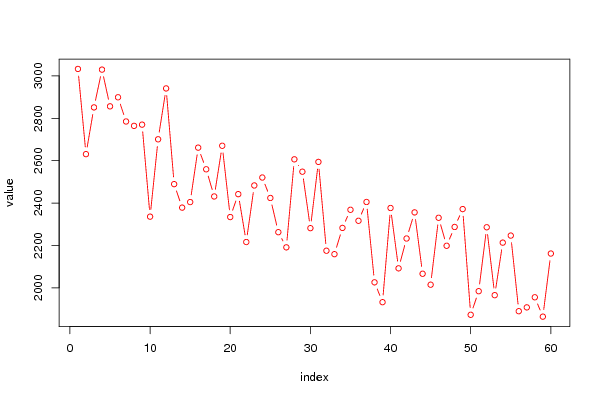
3032.9 2630.8 2851.4 3029.7 2856.4 2899.2 2784.9 2764.2 2770.0 2335.6 2700.9 2941.0 2489.2 2378.3 2404.6 2661.4 2559.3 2431.0 2670.2 2333.8 2441.9 2215.9 2482.9 2520.4 2423.8 2262.3 2190.8 2606.3 2547.9 2281.4 2594.1 2174.8 2158.6 2282.5 2368.1 2316.1 2404.9 2025.7 1931.9 2376.5 2091.7 2232.5 2355.8 2066.1 2014.4 2330.4 2198.2 2287.0 2371.4 1872.4 1983.8 2285.6 1965.0 2213.0 2246.3 1889.4 1907.4 1955.1 1863.6 2161.5 | |||||||||||||||||||||||||||||||||||||||||
Tables (Output of Computation) | |||||||||||||||||||||||||||||||||||||||||
| |||||||||||||||||||||||||||||||||||||||||
Figures (Output of Computation) | |||||||||||||||||||||||||||||||||||||||||
Input Parameters & R Code | |||||||||||||||||||||||||||||||||||||||||
| Parameters (Session): | |||||||||||||||||||||||||||||||||||||||||
| par1 = Belgian Export: Nederland ; par2 = http://www.nbb.be/belgostat/PresentationLinker?TableId=365000038&Lang=E ; par3 = Belgian Export: Nederland ; | |||||||||||||||||||||||||||||||||||||||||
| Parameters (R input): | |||||||||||||||||||||||||||||||||||||||||
| par1 = Belgian Export: Nederland ; par2 = http://www.nbb.be/belgostat/PresentationLinker?TableId=365000038&Lang=E ; par3 = Belgian Export: Nederland ; | |||||||||||||||||||||||||||||||||||||||||
| R code (references can be found in the software module): | |||||||||||||||||||||||||||||||||||||||||
bitmap(file='test1.png') | |||||||||||||||||||||||||||||||||||||||||