Free Statistics
of Irreproducible Research!
Description of Statistical Computation | |||||||||||||||||||||||||||||||||||||||||||||||||||
|---|---|---|---|---|---|---|---|---|---|---|---|---|---|---|---|---|---|---|---|---|---|---|---|---|---|---|---|---|---|---|---|---|---|---|---|---|---|---|---|---|---|---|---|---|---|---|---|---|---|---|---|
| Author's title | |||||||||||||||||||||||||||||||||||||||||||||||||||
| Author | *The author of this computation has been verified* | ||||||||||||||||||||||||||||||||||||||||||||||||||
| R Software Module | rwasp_pairs.wasp | ||||||||||||||||||||||||||||||||||||||||||||||||||
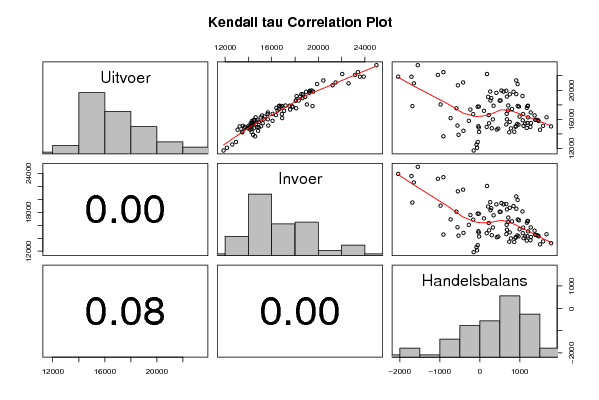
| Title produced by software | Kendall tau Correlation Matrix | ||||||||||||||||||||||||||||||||||||||||||||||||||
| Date of computation | Sun, 21 Dec 2008 09:24:43 -0700 | ||||||||||||||||||||||||||||||||||||||||||||||||||
| Cite this page as follows | Statistical Computations at FreeStatistics.org, Office for Research Development and Education, URL https://freestatistics.org/blog/index.php?v=date/2008/Dec/21/t12298767171pnergykqej204d.htm/, Retrieved Fri, 17 May 2024 07:01:36 +0000 | ||||||||||||||||||||||||||||||||||||||||||||||||||
| Statistical Computations at FreeStatistics.org, Office for Research Development and Education, URL https://freestatistics.org/blog/index.php?pk=35667, Retrieved Fri, 17 May 2024 07:01:36 +0000 | |||||||||||||||||||||||||||||||||||||||||||||||||||
| QR Codes: | |||||||||||||||||||||||||||||||||||||||||||||||||||
|
| |||||||||||||||||||||||||||||||||||||||||||||||||||
| Original text written by user: | |||||||||||||||||||||||||||||||||||||||||||||||||||
| IsPrivate? | No (this computation is public) | ||||||||||||||||||||||||||||||||||||||||||||||||||
| User-defined keywords | |||||||||||||||||||||||||||||||||||||||||||||||||||
| Estimated Impact | 158 | ||||||||||||||||||||||||||||||||||||||||||||||||||
Tree of Dependent Computations | |||||||||||||||||||||||||||||||||||||||||||||||||||
| Family? (F = Feedback message, R = changed R code, M = changed R Module, P = changed Parameters, D = changed Data) | |||||||||||||||||||||||||||||||||||||||||||||||||||
| - [Pearson Correlation] [Investigating ass...] [2007-10-22 22:08:56] [8cd6641b921d30ebe00b648d1481bba0] F D [Pearson Correlation] [Correlatie tussen...] [2008-10-21 00:01:19] [504b73e6de93b01331326637b3288ad4] F D [Pearson Correlation] [Correlatie tussen...] [2008-10-21 00:32:08] [504b73e6de93b01331326637b3288ad4] - RM D [Kendall tau Correlation Matrix] [Kendall Tau] [2008-12-21 16:24:43] [ba85d9d0a82357dd3edf208eef933423] [Current] - D [Kendall tau Correlation Matrix] [Kendall Tau na di...] [2008-12-22 02:08:59] [504b73e6de93b01331326637b3288ad4] - D [Kendall tau Correlation Matrix] [Kendall Tau na di...] [2008-12-22 02:16:19] [504b73e6de93b01331326637b3288ad4] | |||||||||||||||||||||||||||||||||||||||||||||||||||
| Feedback Forum | |||||||||||||||||||||||||||||||||||||||||||||||||||
Post a new message | |||||||||||||||||||||||||||||||||||||||||||||||||||
Dataset | |||||||||||||||||||||||||||||||||||||||||||||||||||
| Dataseries X: | |||||||||||||||||||||||||||||||||||||||||||||||||||
15916,4 14532,2 1384,2 16535,9 15167 1368,9 15796 16071,1 -275,1 14418,6 14827,5 -408,9 15044,5 15082 -37,5 14944,2 14772,7 171,5 16754,8 16083 671,8 14254 14272,5 -18,5 15454,9 15223,3 231,6 15644,8 14897,3 747,5 14568,3 13062,6 1505,7 12520,2 12603,8 -83,6 14803 13629,8 1173,2 15873,2 14421,1 1452,1 14755,3 13978,3 777 12875,1 12927,9 -52,8 14291,1 13429,9 861,2 14205,3 13470,1 735,2 15859,4 14785,8 1073,6 15258,9 14292 966,9 15498,6 14308,8 1189,8 15106,5 14013 1093,5 15023,6 13240,9 1782,7 12083 12153,4 -70,4 15761,3 14289,7 1471,6 16943 15669,2 1273,8 15070,3 14169,5 900,8 13659,6 14569,8 -910,2 14768,9 14469,1 299,8 14725,1 14264,9 460,2 15998,1 15320,9 677,2 15370,6 14433,5 937,1 14956,9 13691,5 1265,4 15469,7 14194,1 1275,6 15101,8 13519,2 1582,6 11703,7 11857,9 -154,2 16283,6 14616 1667,6 16726,5 15643,4 1083,1 14968,9 14077,2 891,7 14861 14887,5 -26,5 14583,3 14159,9 423,4 15305,8 14643 662,8 17903,9 17192,5 711,4 16379,4 15386,1 993,3 15420,3 14287,1 1133,2 17870,5 17526,6 343,9 15912,8 14497 1415,8 13866,5 14398,3 -531,8 17823,2 16629,6 1193,6 17872 16670,7 1201,3 17420,4 16614,8 805,6 16704,4 16869,2 -164,8 15991,2 15663,9 327,3 16583,6 16359,9 223,7 19123,5 18447,7 675,8 17838,7 16889 949,7 17209,4 16505 704,4 18586,5 18320,9 265,6 16258,1 15052,1 1206 15141,6 15699,8 -558,2 19202,1 18135,3 1066,8 17746,5 16768,7 977,8 19090,1 18883 207,1 18040,3 19021 -980,7 17515,5 18101,9 -586,4 17751,8 17776,1 -24,3 21072,4 21489,9 -417,5 17170 17065,3 104,7 19439,5 18690 749,5 19795,4 18953,1 842,3 17574,9 16398,9 1176 16165,4 16895,7 -730,3 19464,6 18553 911,6 19932,1 19270 662,1 19961,2 19422,1 539,1 17343,4 17579,4 -236 18924,2 18637,3 286,9 18574,1 18076,7 497,4 21350,6 20438,6 912 18594,6 18075,2 519,4 19823,1 19563 260,1 20844,4 19899,2 945,2 19640,2 19227,5 412,7 17735,4 17789,6 -54,2 19813,6 19220,8 592,8 22238,5 22058,6 179,9 20682,2 21230,8 -548,6 17818,6 19504,4 -1685,8 21872,1 23913,1 -2041 22117 23165,7 -1048,7 21865,9 23574,3 -1708,4 23451,3 25002 -1550,7 20953,7 22603,9 -1650,2 22497,3 23408,6 -911,3 | |||||||||||||||||||||||||||||||||||||||||||||||||||
Tables (Output of Computation) | |||||||||||||||||||||||||||||||||||||||||||||||||||
| |||||||||||||||||||||||||||||||||||||||||||||||||||
Figures (Output of Computation) | |||||||||||||||||||||||||||||||||||||||||||||||||||
Input Parameters & R Code | |||||||||||||||||||||||||||||||||||||||||||||||||||
| Parameters (Session): | |||||||||||||||||||||||||||||||||||||||||||||||||||
| Parameters (R input): | |||||||||||||||||||||||||||||||||||||||||||||||||||
| R code (references can be found in the software module): | |||||||||||||||||||||||||||||||||||||||||||||||||||
panel.tau <- function(x, y, digits=2, prefix='', cex.cor) | |||||||||||||||||||||||||||||||||||||||||||||||||||