Free Statistics

of Irreproducible Research!

Author's title

Author*The author of this computation has been verified*
R Software Modulerwasp_arimaforecasting.wasp
Title produced by softwareARIMA Forecasting
Date of computationSun, 21 Dec 2008 09:05:33 -0700
Cite this page as followsStatistical Computations at FreeStatistics.org, Office for Research Development and Education, URL https://freestatistics.org/blog/index.php?v=date/2008/Dec/21/t1229875767rfdu1ose90t7qn2.htm/, Retrieved Fri, 17 May 2024 02:03:14 +0000
Statistical Computations at FreeStatistics.org, Office for Research Development and Education, URL https://freestatistics.org/blog/index.php?pk=35657, Retrieved Fri, 17 May 2024 02:03:14 +0000
QR Codes:

Original text written by user:
IsPrivate?No (this computation is public)
User-defined keywords
Estimated Impact153
Family? (F = Feedback message, R = changed R code, M = changed R Module, P = changed Parameters, D = changed Data)
F     [ARIMA Forecasting] [ARIMA forecast] [2008-12-15 20:51:22] [dff692ae32125bdbbfc005d665e23b83]
-   PD    [ARIMA Forecasting] [ARIMA Forecast En...] [2008-12-21 16:05:33] [9c9e716fef59bf95ba5b3e37a9a90be4] [Current]
Feedback Forum

Post a new message
Dataseries X:
95.1
95.9
95.9
96.9
95.7
97.8
95.9
98.2
101.2
106.8
108.2
108.2
113.2
115.2
122
119.8
119.8
112.7
113.8
118.6
119.2
118.1
121.6
125.3
126.5
133.6
136.5
131.9
131.9
139.3
139.9
140.1
142.1
141.8
143.5
143.6
140.6
137.4
133.9
134.6
134.6
132.1
132.5
134.1
135.1
136.4
136.6
138.1
138.4
141
144.9
153.4
156.5
160.7
163.9
166.7
169.7
174.3
181.8
187.8
182.4


Summary of computational transaction
Raw Inputview raw input (R code)
Raw Outputview raw output of R engine
Computing time1 seconds
R Server'George Udny Yule' @ 72.249.76.132

\begin{tabular}{lllllllll}
\hline
Summary of computational transaction \tabularnewline
Raw Input & view raw input (R code)  \tabularnewline
Raw Output & view raw output of R engine  \tabularnewline
Computing time & 1 seconds \tabularnewline
R Server & 'George Udny Yule' @ 72.249.76.132 \tabularnewline
\hline
\end{tabular}
%Source: https://freestatistics.org/blog/index.php?pk=35657&T=0

[TABLE]
[ROW][C]Summary of computational transaction[/C][/ROW]
[ROW][C]Raw Input[/C][C]view raw input (R code) [/C][/ROW]
[ROW][C]Raw Output[/C][C]view raw output of R engine [/C][/ROW]
[ROW][C]Computing time[/C][C]1 seconds[/C][/ROW]
[ROW][C]R Server[/C][C]'George Udny Yule' @ 72.249.76.132[/C][/ROW]
[/TABLE]
Source: https://freestatistics.org/blog/index.php?pk=35657&T=0

Globally Unique Identifier (entire table): ba.freestatistics.org/blog/index.php?pk=35657&T=0

As an alternative you can also use a QR Code:  

The GUIDs for individual cells are displayed in the table below:

Summary of computational transaction
Raw Inputview raw input (R code)
Raw Outputview raw output of R engine
Computing time1 seconds
R Server'George Udny Yule' @ 72.249.76.132


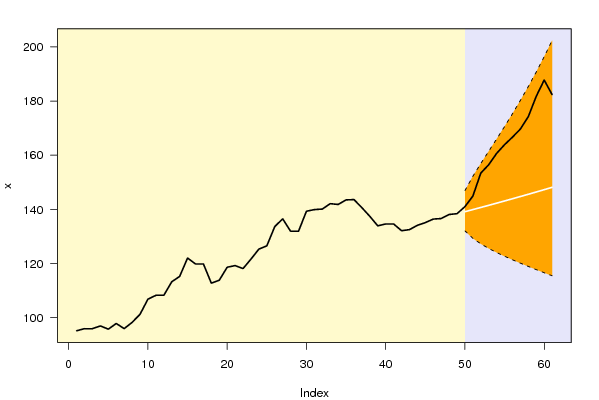
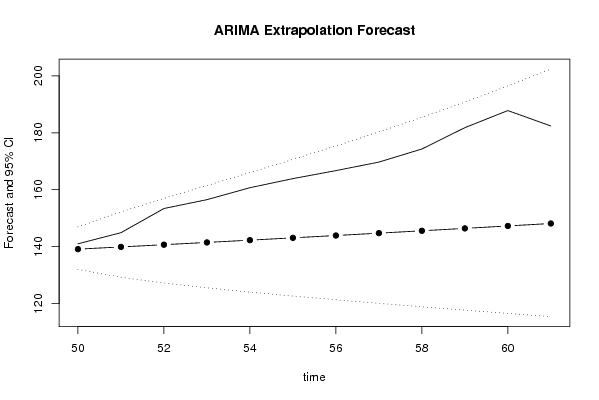
Univariate ARIMA Extrapolation Forecast
timeY[t]F[t]95% LB95% UBp-value(H0: Y[t] = F[t])P(F[t]>Y[t-1])P(F[t]>Y[t-s])P(F[t]>Y[49])
37140.6-------
38137.4-------
39133.9-------
40134.6-------
41134.6-------
42132.1-------
43132.5-------
44134.1-------
45135.1-------
46136.4-------
47136.6-------
48138.1-------
49138.4-------
50141139.1216132.0138146.94930.31910.57170.66680.5717
51144.9139.8996129.2498152.24020.21350.43060.82970.5941
52153.4140.6854127.2268156.94320.06270.30570.76840.6085
53156.5141.4792125.5324161.48390.07060.12140.74980.6186
54160.7142.2811124.0242166.01920.06420.12020.79970.6257
55163.9143.0913122.6347170.63250.06930.10510.77450.6308
56166.7143.9097121.326175.37860.07790.10660.72940.6343
57169.7144.7366120.075180.29950.08440.1130.70230.6365
58174.3145.5722118.8666185.43110.07890.11770.6740.6378
59181.8146.4164117.6906190.80630.05910.10910.66770.6383
60187.8147.2695116.5396196.45770.05320.08440.64260.6381
61182.4148.1316115.4085202.41830.1080.0760.63730.6373

\begin{tabular}{lllllllll}
\hline
Univariate ARIMA Extrapolation Forecast \tabularnewline
time & Y[t] & F[t] & 95% LB & 95% UB & p-value(H0: Y[t] = F[t]) & P(F[t]>Y[t-1]) & P(F[t]>Y[t-s]) & P(F[t]>Y[49]) \tabularnewline
37 & 140.6 & - & - & - & - & - & - & - \tabularnewline
38 & 137.4 & - & - & - & - & - & - & - \tabularnewline
39 & 133.9 & - & - & - & - & - & - & - \tabularnewline
40 & 134.6 & - & - & - & - & - & - & - \tabularnewline
41 & 134.6 & - & - & - & - & - & - & - \tabularnewline
42 & 132.1 & - & - & - & - & - & - & - \tabularnewline
43 & 132.5 & - & - & - & - & - & - & - \tabularnewline
44 & 134.1 & - & - & - & - & - & - & - \tabularnewline
45 & 135.1 & - & - & - & - & - & - & - \tabularnewline
46 & 136.4 & - & - & - & - & - & - & - \tabularnewline
47 & 136.6 & - & - & - & - & - & - & - \tabularnewline
48 & 138.1 & - & - & - & - & - & - & - \tabularnewline
49 & 138.4 & - & - & - & - & - & - & - \tabularnewline
50 & 141 & 139.1216 & 132.0138 & 146.9493 & 0.3191 & 0.5717 & 0.6668 & 0.5717 \tabularnewline
51 & 144.9 & 139.8996 & 129.2498 & 152.2402 & 0.2135 & 0.4306 & 0.8297 & 0.5941 \tabularnewline
52 & 153.4 & 140.6854 & 127.2268 & 156.9432 & 0.0627 & 0.3057 & 0.7684 & 0.6085 \tabularnewline
53 & 156.5 & 141.4792 & 125.5324 & 161.4839 & 0.0706 & 0.1214 & 0.7498 & 0.6186 \tabularnewline
54 & 160.7 & 142.2811 & 124.0242 & 166.0192 & 0.0642 & 0.1202 & 0.7997 & 0.6257 \tabularnewline
55 & 163.9 & 143.0913 & 122.6347 & 170.6325 & 0.0693 & 0.1051 & 0.7745 & 0.6308 \tabularnewline
56 & 166.7 & 143.9097 & 121.326 & 175.3786 & 0.0779 & 0.1066 & 0.7294 & 0.6343 \tabularnewline
57 & 169.7 & 144.7366 & 120.075 & 180.2995 & 0.0844 & 0.113 & 0.7023 & 0.6365 \tabularnewline
58 & 174.3 & 145.5722 & 118.8666 & 185.4311 & 0.0789 & 0.1177 & 0.674 & 0.6378 \tabularnewline
59 & 181.8 & 146.4164 & 117.6906 & 190.8063 & 0.0591 & 0.1091 & 0.6677 & 0.6383 \tabularnewline
60 & 187.8 & 147.2695 & 116.5396 & 196.4577 & 0.0532 & 0.0844 & 0.6426 & 0.6381 \tabularnewline
61 & 182.4 & 148.1316 & 115.4085 & 202.4183 & 0.108 & 0.076 & 0.6373 & 0.6373 \tabularnewline
\hline
\end{tabular}
%Source: https://freestatistics.org/blog/index.php?pk=35657&T=1

[TABLE]
[ROW][C]Univariate ARIMA Extrapolation Forecast[/C][/ROW]
[ROW][C]time[/C][C]Y[t][/C][C]F[t][/C][C]95% LB[/C][C]95% UB[/C][C]p-value(H0: Y[t] = F[t])[/C][C]P(F[t]>Y[t-1])[/C][C]P(F[t]>Y[t-s])[/C][C]P(F[t]>Y[49])[/C][/ROW]
[ROW][C]37[/C][C]140.6[/C][C]-[/C][C]-[/C][C]-[/C][C]-[/C][C]-[/C][C]-[/C][C]-[/C][/ROW]
[ROW][C]38[/C][C]137.4[/C][C]-[/C][C]-[/C][C]-[/C][C]-[/C][C]-[/C][C]-[/C][C]-[/C][/ROW]
[ROW][C]39[/C][C]133.9[/C][C]-[/C][C]-[/C][C]-[/C][C]-[/C][C]-[/C][C]-[/C][C]-[/C][/ROW]
[ROW][C]40[/C][C]134.6[/C][C]-[/C][C]-[/C][C]-[/C][C]-[/C][C]-[/C][C]-[/C][C]-[/C][/ROW]
[ROW][C]41[/C][C]134.6[/C][C]-[/C][C]-[/C][C]-[/C][C]-[/C][C]-[/C][C]-[/C][C]-[/C][/ROW]
[ROW][C]42[/C][C]132.1[/C][C]-[/C][C]-[/C][C]-[/C][C]-[/C][C]-[/C][C]-[/C][C]-[/C][/ROW]
[ROW][C]43[/C][C]132.5[/C][C]-[/C][C]-[/C][C]-[/C][C]-[/C][C]-[/C][C]-[/C][C]-[/C][/ROW]
[ROW][C]44[/C][C]134.1[/C][C]-[/C][C]-[/C][C]-[/C][C]-[/C][C]-[/C][C]-[/C][C]-[/C][/ROW]
[ROW][C]45[/C][C]135.1[/C][C]-[/C][C]-[/C][C]-[/C][C]-[/C][C]-[/C][C]-[/C][C]-[/C][/ROW]
[ROW][C]46[/C][C]136.4[/C][C]-[/C][C]-[/C][C]-[/C][C]-[/C][C]-[/C][C]-[/C][C]-[/C][/ROW]
[ROW][C]47[/C][C]136.6[/C][C]-[/C][C]-[/C][C]-[/C][C]-[/C][C]-[/C][C]-[/C][C]-[/C][/ROW]
[ROW][C]48[/C][C]138.1[/C][C]-[/C][C]-[/C][C]-[/C][C]-[/C][C]-[/C][C]-[/C][C]-[/C][/ROW]
[ROW][C]49[/C][C]138.4[/C][C]-[/C][C]-[/C][C]-[/C][C]-[/C][C]-[/C][C]-[/C][C]-[/C][/ROW]
[ROW][C]50[/C][C]141[/C][C]139.1216[/C][C]132.0138[/C][C]146.9493[/C][C]0.3191[/C][C]0.5717[/C][C]0.6668[/C][C]0.5717[/C][/ROW]
[ROW][C]51[/C][C]144.9[/C][C]139.8996[/C][C]129.2498[/C][C]152.2402[/C][C]0.2135[/C][C]0.4306[/C][C]0.8297[/C][C]0.5941[/C][/ROW]
[ROW][C]52[/C][C]153.4[/C][C]140.6854[/C][C]127.2268[/C][C]156.9432[/C][C]0.0627[/C][C]0.3057[/C][C]0.7684[/C][C]0.6085[/C][/ROW]
[ROW][C]53[/C][C]156.5[/C][C]141.4792[/C][C]125.5324[/C][C]161.4839[/C][C]0.0706[/C][C]0.1214[/C][C]0.7498[/C][C]0.6186[/C][/ROW]
[ROW][C]54[/C][C]160.7[/C][C]142.2811[/C][C]124.0242[/C][C]166.0192[/C][C]0.0642[/C][C]0.1202[/C][C]0.7997[/C][C]0.6257[/C][/ROW]
[ROW][C]55[/C][C]163.9[/C][C]143.0913[/C][C]122.6347[/C][C]170.6325[/C][C]0.0693[/C][C]0.1051[/C][C]0.7745[/C][C]0.6308[/C][/ROW]
[ROW][C]56[/C][C]166.7[/C][C]143.9097[/C][C]121.326[/C][C]175.3786[/C][C]0.0779[/C][C]0.1066[/C][C]0.7294[/C][C]0.6343[/C][/ROW]
[ROW][C]57[/C][C]169.7[/C][C]144.7366[/C][C]120.075[/C][C]180.2995[/C][C]0.0844[/C][C]0.113[/C][C]0.7023[/C][C]0.6365[/C][/ROW]
[ROW][C]58[/C][C]174.3[/C][C]145.5722[/C][C]118.8666[/C][C]185.4311[/C][C]0.0789[/C][C]0.1177[/C][C]0.674[/C][C]0.6378[/C][/ROW]
[ROW][C]59[/C][C]181.8[/C][C]146.4164[/C][C]117.6906[/C][C]190.8063[/C][C]0.0591[/C][C]0.1091[/C][C]0.6677[/C][C]0.6383[/C][/ROW]
[ROW][C]60[/C][C]187.8[/C][C]147.2695[/C][C]116.5396[/C][C]196.4577[/C][C]0.0532[/C][C]0.0844[/C][C]0.6426[/C][C]0.6381[/C][/ROW]
[ROW][C]61[/C][C]182.4[/C][C]148.1316[/C][C]115.4085[/C][C]202.4183[/C][C]0.108[/C][C]0.076[/C][C]0.6373[/C][C]0.6373[/C][/ROW]
[/TABLE]
Source: https://freestatistics.org/blog/index.php?pk=35657&T=1

Globally Unique Identifier (entire table): ba.freestatistics.org/blog/index.php?pk=35657&T=1

As an alternative you can also use a QR Code:  

The GUIDs for individual cells are displayed in the table below:

Univariate ARIMA Extrapolation Forecast
timeY[t]F[t]95% LB95% UBp-value(H0: Y[t] = F[t])P(F[t]>Y[t-1])P(F[t]>Y[t-s])P(F[t]>Y[49])
37140.6-------
38137.4-------
39133.9-------
40134.6-------
41134.6-------
42132.1-------
43132.5-------
44134.1-------
45135.1-------
46136.4-------
47136.6-------
48138.1-------
49138.4-------
50141139.1216132.0138146.94930.31910.57170.66680.5717
51144.9139.8996129.2498152.24020.21350.43060.82970.5941
52153.4140.6854127.2268156.94320.06270.30570.76840.6085
53156.5141.4792125.5324161.48390.07060.12140.74980.6186
54160.7142.2811124.0242166.01920.06420.12020.79970.6257
55163.9143.0913122.6347170.63250.06930.10510.77450.6308
56166.7143.9097121.326175.37860.07790.10660.72940.6343
57169.7144.7366120.075180.29950.08440.1130.70230.6365
58174.3145.5722118.8666185.43110.07890.11770.6740.6378
59181.8146.4164117.6906190.80630.05910.10910.66770.6383
60187.8147.2695116.5396196.45770.05320.08440.64260.6381
61182.4148.1316115.4085202.41830.1080.0760.63730.6373


Univariate ARIMA Extrapolation Forecast Performance
time% S.E.PEMAPESq.EMSERMSE
500.02870.01350.00113.52830.2940.5422
510.0450.03570.00325.00412.08371.4435
520.0590.09040.0075161.660613.47173.6704
530.07210.10620.0088225.623718.8024.3361
540.08510.12950.0108339.254828.27125.3171
550.09820.14540.0121433.003936.08376.007
560.11160.15840.0132519.396943.28316.579
570.12540.17250.0144623.168951.93077.2063
580.13970.19730.0164825.28868.7748.293
590.15470.24170.02011251.9978104.333210.2144
600.17040.27520.02291642.7199136.893311.7001
610.1870.23130.01931174.322797.86029.8924

\begin{tabular}{lllllllll}
\hline
Univariate ARIMA Extrapolation Forecast Performance \tabularnewline
time & % S.E. & PE & MAPE & Sq.E & MSE & RMSE \tabularnewline
50 & 0.0287 & 0.0135 & 0.0011 & 3.5283 & 0.294 & 0.5422 \tabularnewline
51 & 0.045 & 0.0357 & 0.003 & 25.0041 & 2.0837 & 1.4435 \tabularnewline
52 & 0.059 & 0.0904 & 0.0075 & 161.6606 & 13.4717 & 3.6704 \tabularnewline
53 & 0.0721 & 0.1062 & 0.0088 & 225.6237 & 18.802 & 4.3361 \tabularnewline
54 & 0.0851 & 0.1295 & 0.0108 & 339.2548 & 28.2712 & 5.3171 \tabularnewline
55 & 0.0982 & 0.1454 & 0.0121 & 433.0039 & 36.0837 & 6.007 \tabularnewline
56 & 0.1116 & 0.1584 & 0.0132 & 519.3969 & 43.2831 & 6.579 \tabularnewline
57 & 0.1254 & 0.1725 & 0.0144 & 623.1689 & 51.9307 & 7.2063 \tabularnewline
58 & 0.1397 & 0.1973 & 0.0164 & 825.288 & 68.774 & 8.293 \tabularnewline
59 & 0.1547 & 0.2417 & 0.0201 & 1251.9978 & 104.3332 & 10.2144 \tabularnewline
60 & 0.1704 & 0.2752 & 0.0229 & 1642.7199 & 136.8933 & 11.7001 \tabularnewline
61 & 0.187 & 0.2313 & 0.0193 & 1174.3227 & 97.8602 & 9.8924 \tabularnewline
\hline
\end{tabular}
%Source: https://freestatistics.org/blog/index.php?pk=35657&T=2

[TABLE]
[ROW][C]Univariate ARIMA Extrapolation Forecast Performance[/C][/ROW]
[ROW][C]time[/C][C]% S.E.[/C][C]PE[/C][C]MAPE[/C][C]Sq.E[/C][C]MSE[/C][C]RMSE[/C][/ROW]
[ROW][C]50[/C][C]0.0287[/C][C]0.0135[/C][C]0.0011[/C][C]3.5283[/C][C]0.294[/C][C]0.5422[/C][/ROW]
[ROW][C]51[/C][C]0.045[/C][C]0.0357[/C][C]0.003[/C][C]25.0041[/C][C]2.0837[/C][C]1.4435[/C][/ROW]
[ROW][C]52[/C][C]0.059[/C][C]0.0904[/C][C]0.0075[/C][C]161.6606[/C][C]13.4717[/C][C]3.6704[/C][/ROW]
[ROW][C]53[/C][C]0.0721[/C][C]0.1062[/C][C]0.0088[/C][C]225.6237[/C][C]18.802[/C][C]4.3361[/C][/ROW]
[ROW][C]54[/C][C]0.0851[/C][C]0.1295[/C][C]0.0108[/C][C]339.2548[/C][C]28.2712[/C][C]5.3171[/C][/ROW]
[ROW][C]55[/C][C]0.0982[/C][C]0.1454[/C][C]0.0121[/C][C]433.0039[/C][C]36.0837[/C][C]6.007[/C][/ROW]
[ROW][C]56[/C][C]0.1116[/C][C]0.1584[/C][C]0.0132[/C][C]519.3969[/C][C]43.2831[/C][C]6.579[/C][/ROW]
[ROW][C]57[/C][C]0.1254[/C][C]0.1725[/C][C]0.0144[/C][C]623.1689[/C][C]51.9307[/C][C]7.2063[/C][/ROW]
[ROW][C]58[/C][C]0.1397[/C][C]0.1973[/C][C]0.0164[/C][C]825.288[/C][C]68.774[/C][C]8.293[/C][/ROW]
[ROW][C]59[/C][C]0.1547[/C][C]0.2417[/C][C]0.0201[/C][C]1251.9978[/C][C]104.3332[/C][C]10.2144[/C][/ROW]
[ROW][C]60[/C][C]0.1704[/C][C]0.2752[/C][C]0.0229[/C][C]1642.7199[/C][C]136.8933[/C][C]11.7001[/C][/ROW]
[ROW][C]61[/C][C]0.187[/C][C]0.2313[/C][C]0.0193[/C][C]1174.3227[/C][C]97.8602[/C][C]9.8924[/C][/ROW]
[/TABLE]
Source: https://freestatistics.org/blog/index.php?pk=35657&T=2

Globally Unique Identifier (entire table): ba.freestatistics.org/blog/index.php?pk=35657&T=2

As an alternative you can also use a QR Code:  

The GUIDs for individual cells are displayed in the table below:

Univariate ARIMA Extrapolation Forecast Performance
time% S.E.PEMAPESq.EMSERMSE
500.02870.01350.00113.52830.2940.5422
510.0450.03570.00325.00412.08371.4435
520.0590.09040.0075161.660613.47173.6704
530.07210.10620.0088225.623718.8024.3361
540.08510.12950.0108339.254828.27125.3171
550.09820.14540.0121433.003936.08376.007
560.11160.15840.0132519.396943.28316.579
570.12540.17250.0144623.168951.93077.2063
580.13970.19730.0164825.28868.7748.293
590.15470.24170.02011251.9978104.333210.2144
600.17040.27520.02291642.7199136.893311.7001
610.1870.23130.01931174.322797.86029.8924


Parameters (Session):
par1 = 12 ; par2 = -0.8 ; par3 = 0 ; par4 = 0 ; par5 = 12 ; par6 = 0 ; par7 = 1 ; par8 = 0 ; par9 = 0 ; par10 = FALSE ;
Parameters (R input):
par1 = 12 ; par2 = -0.8 ; par3 = 2 ; par4 = 0 ; par5 = 12 ; par6 = 0 ; par7 = 2 ; par8 = 0 ; par9 = 0 ; par10 = FALSE ;
R code (references can be found in the software module):
par1 <- as.numeric(par1) #cut off periods
par2 <- as.numeric(par2) #lambda
par3 <- as.numeric(par3) #degree of non-seasonal differencing
par4 <- as.numeric(par4) #degree of seasonal differencing
par5 <- as.numeric(par5) #seasonal period
par6 <- as.numeric(par6) #p
par7 <- as.numeric(par7) #q
par8 <- as.numeric(par8) #P
par9 <- as.numeric(par9) #Q
if (par10 == 'TRUE') par10 <- TRUE
if (par10 == 'FALSE') par10 <- FALSE
if (par2 == 0) x <- log(x)
if (par2 != 0) x <- x^par2
lx <- length(x)
first <- lx - 2*par1
nx <- lx - par1
nx1 <- nx + 1
fx <- lx - nx
if (fx < 1) {
fx <- par5
nx1 <- lx + fx - 1
first <- lx - 2*fx
}
first <- 1
if (fx < 3) fx <- round(lx/10,0)
(arima.out <- arima(x[1:nx], order=c(par6,par3,par7), seasonal=list(order=c(par8,par4,par9), period=par5), include.mean=par10, method='ML'))
(forecast <- predict(arima.out,fx))
(lb <- forecast$pred - 1.96 * forecast$se)
(ub <- forecast$pred + 1.96 * forecast$se)
if (par2 == 0) {
x <- exp(x)
forecast$pred <- exp(forecast$pred)
lb <- exp(lb)
ub <- exp(ub)
}
if (par2 != 0) {
x <- x^(1/par2)
forecast$pred <- forecast$pred^(1/par2)
lb <- lb^(1/par2)
ub <- ub^(1/par2)
}
if (par2 < 0) {
olb <- lb
lb <- ub
ub <- olb
}
(actandfor <- c(x[1:nx], forecast$pred))
(perc.se <- (ub-forecast$pred)/1.96/forecast$pred)
bitmap(file='test1.png')
opar <- par(mar=c(4,4,2,2),las=1)
ylim <- c( min(x[first:nx],lb), max(x[first:nx],ub))
plot(x,ylim=ylim,type='n',xlim=c(first,lx))
usr <- par('usr')
rect(usr[1],usr[3],nx+1,usr[4],border=NA,col='lemonchiffon')
rect(nx1,usr[3],usr[2],usr[4],border=NA,col='lavender')
abline(h= (-3:3)*2 , col ='gray', lty =3)
polygon( c(nx1:lx,lx:nx1), c(lb,rev(ub)), col = 'orange', lty=2,border=NA)
lines(nx1:lx, lb , lty=2)
lines(nx1:lx, ub , lty=2)
lines(x, lwd=2)
lines(nx1:lx, forecast$pred , lwd=2 , col ='white')
box()
par(opar)
dev.off()
prob.dec <- array(NA, dim=fx)
prob.sdec <- array(NA, dim=fx)
prob.ldec <- array(NA, dim=fx)
prob.pval <- array(NA, dim=fx)
perf.pe <- array(0, dim=fx)
perf.mape <- array(0, dim=fx)
perf.se <- array(0, dim=fx)
perf.mse <- array(0, dim=fx)
perf.rmse <- array(0, dim=fx)
for (i in 1:fx) {
locSD <- (ub[i] - forecast$pred[i]) / 1.96
perf.pe[i] = (x[nx+i] - forecast$pred[i]) / forecast$pred[i]
perf.mape[i] = perf.mape[i] + abs(perf.pe[i])
perf.se[i] = (x[nx+i] - forecast$pred[i])^2
perf.mse[i] = perf.mse[i] + perf.se[i]
prob.dec[i] = pnorm((x[nx+i-1] - forecast$pred[i]) / locSD)
prob.sdec[i] = pnorm((x[nx+i-par5] - forecast$pred[i]) / locSD)
prob.ldec[i] = pnorm((x[nx] - forecast$pred[i]) / locSD)
prob.pval[i] = pnorm(abs(x[nx+i] - forecast$pred[i]) / locSD)
}
perf.mape = perf.mape / fx
perf.mse = perf.mse / fx
perf.rmse = sqrt(perf.mse)
bitmap(file='test2.png')
plot(forecast$pred, pch=19, type='b',main='ARIMA Extrapolation Forecast', ylab='Forecast and 95% CI', xlab='time',ylim=c(min(lb),max(ub)))
dum <- forecast$pred
dum[1:12] <- x[(nx+1):lx]
lines(dum, lty=1)
lines(ub,lty=3)
lines(lb,lty=3)
dev.off()
load(file='createtable')
a<-table.start()
a<-table.row.start(a)
a<-table.element(a,'Univariate ARIMA Extrapolation Forecast',9,TRUE)
a<-table.row.end(a)
a<-table.row.start(a)
a<-table.element(a,'time',1,header=TRUE)
a<-table.element(a,'Y[t]',1,header=TRUE)
a<-table.element(a,'F[t]',1,header=TRUE)
a<-table.element(a,'95% LB',1,header=TRUE)
a<-table.element(a,'95% UB',1,header=TRUE)
a<-table.element(a,'p-value
(H0: Y[t] = F[t])',1,header=TRUE)
a<-table.element(a,'P(F[t]>Y[t-1])',1,header=TRUE)
a<-table.element(a,'P(F[t]>Y[t-s])',1,header=TRUE)
mylab <- paste('P(F[t]>Y[',nx,sep='')
mylab <- paste(mylab,'])',sep='')
a<-table.element(a,mylab,1,header=TRUE)
a<-table.row.end(a)
for (i in (nx-par5):nx) {
a<-table.row.start(a)
a<-table.element(a,i,header=TRUE)
a<-table.element(a,x[i])
a<-table.element(a,'-')
a<-table.row.end(a)
}
for (i in 1:fx) {
a<-table.row.start(a)
a<-table.element(a,nx+i,header=TRUE)
a<-table.element(a,round(x[nx+i],4))
a<-table.element(a,round(forecast$pred[i],4))
a<-table.element(a,round(lb[i],4))
a<-table.element(a,round(ub[i],4))
a<-table.element(a,round((1-prob.pval[i]),4))
a<-table.element(a,round((1-prob.dec[i]),4))
a<-table.element(a,round((1-prob.sdec[i]),4))
a<-table.element(a,round((1-prob.ldec[i]),4))
a<-table.row.end(a)
}
a<-table.end(a)
table.save(a,file='mytable.tab')
a<-table.start()
a<-table.row.start(a)
a<-table.element(a,'Univariate ARIMA Extrapolation Forecast Performance',7,TRUE)
a<-table.row.end(a)
a<-table.row.start(a)
a<-table.element(a,'time',1,header=TRUE)
a<-table.element(a,'% S.E.',1,header=TRUE)
a<-table.element(a,'PE',1,header=TRUE)
a<-table.element(a,'MAPE',1,header=TRUE)
a<-table.element(a,'Sq.E',1,header=TRUE)
a<-table.element(a,'MSE',1,header=TRUE)
a<-table.element(a,'RMSE',1,header=TRUE)
a<-table.row.end(a)
for (i in 1:fx) {
a<-table.row.start(a)
a<-table.element(a,nx+i,header=TRUE)
a<-table.element(a,round(perc.se[i],4))
a<-table.element(a,round(perf.pe[i],4))
a<-table.element(a,round(perf.mape[i],4))
a<-table.element(a,round(perf.se[i],4))
a<-table.element(a,round(perf.mse[i],4))
a<-table.element(a,round(perf.rmse[i],4))
a<-table.row.end(a)
}
a<-table.end(a)
table.save(a,file='mytable1.tab')