Free Statistics

of Irreproducible Research!

Author's title

Author*The author of this computation has been verified*
R Software Modulerwasp_cross.wasp
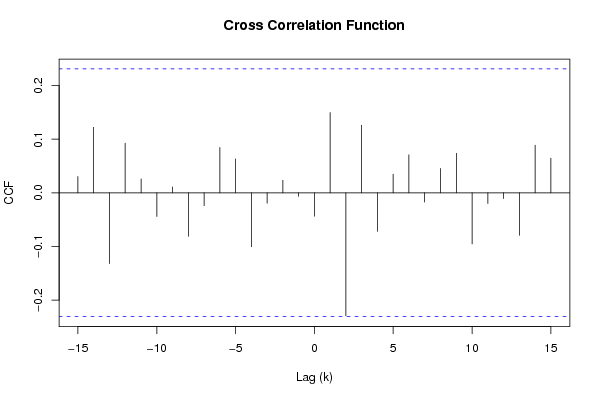
Title produced by softwareCross Correlation Function
Date of computationSun, 21 Dec 2008 07:41:38 -0700
Cite this page as followsStatistical Computations at FreeStatistics.org, Office for Research Development and Education, URL https://freestatistics.org/blog/index.php?v=date/2008/Dec/21/t1229870538xjimk9heqhaptvk.htm/, Retrieved Fri, 17 May 2024 05:46:25 +0000
Statistical Computations at FreeStatistics.org, Office for Research Development and Education, URL https://freestatistics.org/blog/index.php?pk=35608, Retrieved Fri, 17 May 2024 05:46:25 +0000
QR Codes:

Original text written by user:
IsPrivate?No (this computation is public)
User-defined keywords
Estimated Impact184
Family? (F = Feedback message, R = changed R code, M = changed R Module, P = changed Parameters, D = changed Data)
-     [Kendall tau Correlation Matrix] [Kendall tau matri...] [2007-12-13 16:32:12] [707a919fab5d6f3020ea3c395672cd86]
- RMPD  [Cross Correlation Function] [Stefan Temmerman] [2008-12-11 13:49:31] [4c0c0466a42d9212e91e81695c3ab4a9]
-           [Cross Correlation Function] [] [2008-12-21 14:41:38] [75a00449045803b2332dacf227dc78d5] [Current]
Feedback Forum

Post a new message
Dataseries X:
13139.7
14532.2
15167
16071.1
14827.5
15082
14772.7
16083
14272.5
15223.3
14897.3
13062.6
12603.8
13629.8
14421.1
13978.3
12927.9
13429.9
13470.1
14785.8
14292
14308.8
14013
13240.9
12153.4
14289.7
15669.2
14169.5
14569.8
14469.1
14264.9
15320.9
14433.5
13691.5
14194.1
13519.2
11857.9
14616
15643.4
14077.2
14887.5
14159.9
14643
17192.5
15386.1
14287.1
17526.6
14497
14398.3
16629.6
16670.7
16614.8
16869.2
15663.9
16359.9
18447.7
16889
16505
18320.9
15052.1
15699.8
18135.3
16768.7
18883
19021
18101.9
17776.1
21489.9
17065.3
18690
18953.1
16398.9
16895.7
18553
19270
19422.1
17579.4
18637.3
18076.7
20438.6
18075.2
19563
19899.2
19227.5
17789.6
19220.8
21968.9
21131.5
19484.6
22404.1
21099
22486.5
23707.5
21897.5
23326.4
23765.4
20444
Dataseries Y:
7.3
7.1
7.1
6.8
6.5
6.3
6.1
6.1
6.3
6.3
6
6.2
6.4
6.8
7.5
7.5
7.6
7.6
7.4
7.3
7.1
6.9
6.8
7.5
7.6
7.8
8
8.1
8.2
8.3
8.2
8
7.9
7.6
7.6
8.2
8.3
8.4
8.4
8.4
8.6
8.9
8.8
8.3
7.5
7.2
7.5
8.8
9.3
9.3
8.7
8.2
8.3
8.5
8.6
8.6
8.2
8.1
8
8.6
8.7
8.8
8.5
8.4
8.5
8.7
8.7
8.6
8.5
8.3
8.1
8.2
8.1
8.1
7.9
7.9
7.9
8
8
7.9
8
7.7
7.2
7.5
7.3
7
7
7
7.2
7.3
7.1
6.8
6.6
6.2
6.2
6.8
6.9


Summary of computational transaction
Raw Inputview raw input (R code)
Raw Outputview raw output of R engine
Computing time1 seconds
R Server'Gwilym Jenkins' @ 72.249.127.135

\begin{tabular}{lllllllll}
\hline
Summary of computational transaction \tabularnewline
Raw Input & view raw input (R code)  \tabularnewline
Raw Output & view raw output of R engine  \tabularnewline
Computing time & 1 seconds \tabularnewline
R Server & 'Gwilym Jenkins' @ 72.249.127.135 \tabularnewline
\hline
\end{tabular}
%Source: https://freestatistics.org/blog/index.php?pk=35608&T=0

[TABLE]
[ROW][C]Summary of computational transaction[/C][/ROW]
[ROW][C]Raw Input[/C][C]view raw input (R code) [/C][/ROW]
[ROW][C]Raw Output[/C][C]view raw output of R engine [/C][/ROW]
[ROW][C]Computing time[/C][C]1 seconds[/C][/ROW]
[ROW][C]R Server[/C][C]'Gwilym Jenkins' @ 72.249.127.135[/C][/ROW]
[/TABLE]
Source: https://freestatistics.org/blog/index.php?pk=35608&T=0

Globally Unique Identifier (entire table): ba.freestatistics.org/blog/index.php?pk=35608&T=0

As an alternative you can also use a QR Code:  

The GUIDs for individual cells are displayed in the table below:

Summary of computational transaction
Raw Inputview raw input (R code)
Raw Outputview raw output of R engine
Computing time1 seconds
R Server'Gwilym Jenkins' @ 72.249.127.135


Cross Correlation Function
ParameterValue
Box-Cox transformation parameter (lambda) of X series-0.6
Degree of non-seasonal differencing (d) of X series1
Degree of seasonal differencing (D) of X series2
Seasonal Period (s)12
Box-Cox transformation parameter (lambda) of Y series1
Degree of non-seasonal differencing (d) of Y series2
Degree of seasonal differencing (D) of Y series1
krho(Y[t],X[t+k])
-150.0304057392382176
-140.122205061018990
-13-0.132081294099040
-120.0924560036048447
-110.0258745410366296
-10-0.0440096671868219
-90.0110235572195794
-8-0.0811831359582591
-7-0.023975307166323
-60.0844228821754183
-50.0630759319844917
-4-0.100795213160667
-3-0.0192779003262279
-20.0233634069054486
-1-0.00648367112787924
0-0.0437108591805704
10.149731868525346
2-0.229225521122701
30.126142246284520
4-0.0717870431805463
50.0346802013191776
60.0707767154389678
7-0.0173166285068989
80.0455159559506086
90.0736861418293399
10-0.0953694075927833
11-0.0197514228621139
12-0.0107969776524840
13-0.0793361319830858
140.0888010845325091
150.0646688723477729

\begin{tabular}{lllllllll}
\hline
Cross Correlation Function \tabularnewline
Parameter & Value \tabularnewline
Box-Cox transformation parameter (lambda) of X series & -0.6 \tabularnewline
Degree of non-seasonal differencing (d) of X series & 1 \tabularnewline
Degree of seasonal differencing (D) of X series & 2 \tabularnewline
Seasonal Period (s) & 12 \tabularnewline
Box-Cox transformation parameter (lambda) of Y series & 1 \tabularnewline
Degree of non-seasonal differencing (d) of Y series & 2 \tabularnewline
Degree of seasonal differencing (D) of Y series & 1 \tabularnewline
k & rho(Y[t],X[t+k]) \tabularnewline
-15 & 0.0304057392382176 \tabularnewline
-14 & 0.122205061018990 \tabularnewline
-13 & -0.132081294099040 \tabularnewline
-12 & 0.0924560036048447 \tabularnewline
-11 & 0.0258745410366296 \tabularnewline
-10 & -0.0440096671868219 \tabularnewline
-9 & 0.0110235572195794 \tabularnewline
-8 & -0.0811831359582591 \tabularnewline
-7 & -0.023975307166323 \tabularnewline
-6 & 0.0844228821754183 \tabularnewline
-5 & 0.0630759319844917 \tabularnewline
-4 & -0.100795213160667 \tabularnewline
-3 & -0.0192779003262279 \tabularnewline
-2 & 0.0233634069054486 \tabularnewline
-1 & -0.00648367112787924 \tabularnewline
0 & -0.0437108591805704 \tabularnewline
1 & 0.149731868525346 \tabularnewline
2 & -0.229225521122701 \tabularnewline
3 & 0.126142246284520 \tabularnewline
4 & -0.0717870431805463 \tabularnewline
5 & 0.0346802013191776 \tabularnewline
6 & 0.0707767154389678 \tabularnewline
7 & -0.0173166285068989 \tabularnewline
8 & 0.0455159559506086 \tabularnewline
9 & 0.0736861418293399 \tabularnewline
10 & -0.0953694075927833 \tabularnewline
11 & -0.0197514228621139 \tabularnewline
12 & -0.0107969776524840 \tabularnewline
13 & -0.0793361319830858 \tabularnewline
14 & 0.0888010845325091 \tabularnewline
15 & 0.0646688723477729 \tabularnewline
\hline
\end{tabular}
%Source: https://freestatistics.org/blog/index.php?pk=35608&T=1

[TABLE]
[ROW][C]Cross Correlation Function[/C][/ROW]
[ROW][C]Parameter[/C][C]Value[/C][/ROW]
[ROW][C]Box-Cox transformation parameter (lambda) of X series[/C][C]-0.6[/C][/ROW]
[ROW][C]Degree of non-seasonal differencing (d) of X series[/C][C]1[/C][/ROW]
[ROW][C]Degree of seasonal differencing (D) of X series[/C][C]2[/C][/ROW]
[ROW][C]Seasonal Period (s)[/C][C]12[/C][/ROW]
[ROW][C]Box-Cox transformation parameter (lambda) of Y series[/C][C]1[/C][/ROW]
[ROW][C]Degree of non-seasonal differencing (d) of Y series[/C][C]2[/C][/ROW]
[ROW][C]Degree of seasonal differencing (D) of Y series[/C][C]1[/C][/ROW]
[ROW][C]k[/C][C]rho(Y[t],X[t+k])[/C][/ROW]
[ROW][C]-15[/C][C]0.0304057392382176[/C][/ROW]
[ROW][C]-14[/C][C]0.122205061018990[/C][/ROW]
[ROW][C]-13[/C][C]-0.132081294099040[/C][/ROW]
[ROW][C]-12[/C][C]0.0924560036048447[/C][/ROW]
[ROW][C]-11[/C][C]0.0258745410366296[/C][/ROW]
[ROW][C]-10[/C][C]-0.0440096671868219[/C][/ROW]
[ROW][C]-9[/C][C]0.0110235572195794[/C][/ROW]
[ROW][C]-8[/C][C]-0.0811831359582591[/C][/ROW]
[ROW][C]-7[/C][C]-0.023975307166323[/C][/ROW]
[ROW][C]-6[/C][C]0.0844228821754183[/C][/ROW]
[ROW][C]-5[/C][C]0.0630759319844917[/C][/ROW]
[ROW][C]-4[/C][C]-0.100795213160667[/C][/ROW]
[ROW][C]-3[/C][C]-0.0192779003262279[/C][/ROW]
[ROW][C]-2[/C][C]0.0233634069054486[/C][/ROW]
[ROW][C]-1[/C][C]-0.00648367112787924[/C][/ROW]
[ROW][C]0[/C][C]-0.0437108591805704[/C][/ROW]
[ROW][C]1[/C][C]0.149731868525346[/C][/ROW]
[ROW][C]2[/C][C]-0.229225521122701[/C][/ROW]
[ROW][C]3[/C][C]0.126142246284520[/C][/ROW]
[ROW][C]4[/C][C]-0.0717870431805463[/C][/ROW]
[ROW][C]5[/C][C]0.0346802013191776[/C][/ROW]
[ROW][C]6[/C][C]0.0707767154389678[/C][/ROW]
[ROW][C]7[/C][C]-0.0173166285068989[/C][/ROW]
[ROW][C]8[/C][C]0.0455159559506086[/C][/ROW]
[ROW][C]9[/C][C]0.0736861418293399[/C][/ROW]
[ROW][C]10[/C][C]-0.0953694075927833[/C][/ROW]
[ROW][C]11[/C][C]-0.0197514228621139[/C][/ROW]
[ROW][C]12[/C][C]-0.0107969776524840[/C][/ROW]
[ROW][C]13[/C][C]-0.0793361319830858[/C][/ROW]
[ROW][C]14[/C][C]0.0888010845325091[/C][/ROW]
[ROW][C]15[/C][C]0.0646688723477729[/C][/ROW]
[/TABLE]
Source: https://freestatistics.org/blog/index.php?pk=35608&T=1

Globally Unique Identifier (entire table): ba.freestatistics.org/blog/index.php?pk=35608&T=1

As an alternative you can also use a QR Code:  

The GUIDs for individual cells are displayed in the table below:

Cross Correlation Function
ParameterValue
Box-Cox transformation parameter (lambda) of X series-0.6
Degree of non-seasonal differencing (d) of X series1
Degree of seasonal differencing (D) of X series2
Seasonal Period (s)12
Box-Cox transformation parameter (lambda) of Y series1
Degree of non-seasonal differencing (d) of Y series2
Degree of seasonal differencing (D) of Y series1
krho(Y[t],X[t+k])
-150.0304057392382176
-140.122205061018990
-13-0.132081294099040
-120.0924560036048447
-110.0258745410366296
-10-0.0440096671868219
-90.0110235572195794
-8-0.0811831359582591
-7-0.023975307166323
-60.0844228821754183
-50.0630759319844917
-4-0.100795213160667
-3-0.0192779003262279
-20.0233634069054486
-1-0.00648367112787924
0-0.0437108591805704
10.149731868525346
2-0.229225521122701
30.126142246284520
4-0.0717870431805463
50.0346802013191776
60.0707767154389678
7-0.0173166285068989
80.0455159559506086
90.0736861418293399
10-0.0953694075927833
11-0.0197514228621139
12-0.0107969776524840
13-0.0793361319830858
140.0888010845325091
150.0646688723477729


Parameters (Session):
par1 = -0.6 ; par2 = 1 ; par3 = 2 ; par4 = 12 ; par5 = 1 ; par6 = 2 ; par7 = 1 ;
Parameters (R input):
par1 = -0.6 ; par2 = 1 ; par3 = 2 ; par4 = 12 ; par5 = 1 ; par6 = 2 ; par7 = 1 ; par8 = ; par9 = ; par10 = ; par11 = ; par12 = ; par13 = ; par14 = ; par15 = ; par16 = ; par17 = ; par18 = ; par19 = ; par20 = ;
R code (references can be found in the software module):
par1 <- as.numeric(par1)
par2 <- as.numeric(par2)
par3 <- as.numeric(par3)
par4 <- as.numeric(par4)
par5 <- as.numeric(par5)
par6 <- as.numeric(par6)
par7 <- as.numeric(par7)
if (par1 == 0) {
x <- log(x)
} else {
x <- (x ^ par1 - 1) / par1
}
if (par5 == 0) {
y <- log(y)
} else {
y <- (y ^ par5 - 1) / par5
}
if (par2 > 0) x <- diff(x,lag=1,difference=par2)
if (par6 > 0) y <- diff(y,lag=1,difference=par6)
if (par3 > 0) x <- diff(x,lag=par4,difference=par3)
if (par7 > 0) y <- diff(y,lag=par4,difference=par7)
x
y
bitmap(file='test1.png')
(r <- ccf(x,y,main='Cross Correlation Function',ylab='CCF',xlab='Lag (k)'))
dev.off()
load(file='createtable')
a<-table.start()
a<-table.row.start(a)
a<-table.element(a,'Cross Correlation Function',2,TRUE)
a<-table.row.end(a)
a<-table.row.start(a)
a<-table.element(a,'Parameter',header=TRUE)
a<-table.element(a,'Value',header=TRUE)
a<-table.row.end(a)
a<-table.row.start(a)
a<-table.element(a,'Box-Cox transformation parameter (lambda) of X series',header=TRUE)
a<-table.element(a,par1)
a<-table.row.end(a)
a<-table.row.start(a)
a<-table.element(a,'Degree of non-seasonal differencing (d) of X series',header=TRUE)
a<-table.element(a,par2)
a<-table.row.end(a)
a<-table.row.start(a)
a<-table.element(a,'Degree of seasonal differencing (D) of X series',header=TRUE)
a<-table.element(a,par3)
a<-table.row.end(a)
a<-table.row.start(a)
a<-table.element(a,'Seasonal Period (s)',header=TRUE)
a<-table.element(a,par4)
a<-table.row.end(a)
a<-table.row.start(a)
a<-table.element(a,'Box-Cox transformation parameter (lambda) of Y series',header=TRUE)
a<-table.element(a,par5)
a<-table.row.end(a)
a<-table.row.start(a)
a<-table.element(a,'Degree of non-seasonal differencing (d) of Y series',header=TRUE)
a<-table.element(a,par6)
a<-table.row.end(a)
a<-table.row.start(a)
a<-table.element(a,'Degree of seasonal differencing (D) of Y series',header=TRUE)
a<-table.element(a,par7)
a<-table.row.end(a)
a<-table.row.start(a)
a<-table.element(a,'k',header=TRUE)
a<-table.element(a,'rho(Y[t],X[t+k])',header=TRUE)
a<-table.row.end(a)
mylength <- length(r$acf)
myhalf <- floor((mylength-1)/2)
for (i in 1:mylength) {
a<-table.row.start(a)
a<-table.element(a,i-myhalf-1,header=TRUE)
a<-table.element(a,r$acf[i])
a<-table.row.end(a)
}
a<-table.end(a)
table.save(a,file='mytable.tab')