Free Statistics

of Irreproducible Research!

Author's title

Author*The author of this computation has been verified*
R Software Modulerwasp_autocorrelation.wasp
Title produced by software(Partial) Autocorrelation Function
Date of computationSun, 21 Dec 2008 04:22:09 -0700
Cite this page as followsStatistical Computations at FreeStatistics.org, Office for Research Development and Education, URL https://freestatistics.org/blog/index.php?v=date/2008/Dec/21/t1229858591fdbhkohcx97fqws.htm/, Retrieved Fri, 17 May 2024 04:42:20 +0000
Statistical Computations at FreeStatistics.org, Office for Research Development and Education, URL https://freestatistics.org/blog/index.php?pk=35502, Retrieved Fri, 17 May 2024 04:42:20 +0000
QR Codes:

Original text written by user:
IsPrivate?No (this computation is public)
User-defined keywords
Estimated Impact178
Family? (F = Feedback message, R = changed R code, M = changed R Module, P = changed Parameters, D = changed Data)
-     [(Partial) Autocorrelation Function] [ACF paper bel 20] [2008-12-21 11:19:00] [82d201ca7b4e7cd2c6f885d29b5b6937]
-   P     [(Partial) Autocorrelation Function] [ACF paper] [2008-12-21 11:22:09] [00a0a665d7a07edd2e460056b0c0c354] [Current]
Feedback Forum

Post a new message
Dataseries X:
1995
1947
1766
1635
1833
1910
1960
1970
2061
2093
2121
2175
2197
2350
2440
2409
2473
2408
2455
2448
2498
2646
2757
2849
2921
2982
3081
3106
3119
3061
3097
3162
3257
3277
3295
3364
3494
3667
3813
3918
3896
3801
3570
3702
3862
3970
4139
4200
4291
4444
4503
4357
4591
4697
4621
4563
4203
4296
4435
4105
4117


Summary of computational transaction
Raw Inputview raw input (R code)
Raw Outputview raw output of R engine
Computing time1 seconds
R Server'George Udny Yule' @ 72.249.76.132

\begin{tabular}{lllllllll}
\hline
Summary of computational transaction \tabularnewline
Raw Input & view raw input (R code)  \tabularnewline
Raw Output & view raw output of R engine  \tabularnewline
Computing time & 1 seconds \tabularnewline
R Server & 'George Udny Yule' @ 72.249.76.132 \tabularnewline
\hline
\end{tabular}
%Source: https://freestatistics.org/blog/index.php?pk=35502&T=0

[TABLE]
[ROW][C]Summary of computational transaction[/C][/ROW]
[ROW][C]Raw Input[/C][C]view raw input (R code) [/C][/ROW]
[ROW][C]Raw Output[/C][C]view raw output of R engine [/C][/ROW]
[ROW][C]Computing time[/C][C]1 seconds[/C][/ROW]
[ROW][C]R Server[/C][C]'George Udny Yule' @ 72.249.76.132[/C][/ROW]
[/TABLE]
Source: https://freestatistics.org/blog/index.php?pk=35502&T=0

Globally Unique Identifier (entire table): ba.freestatistics.org/blog/index.php?pk=35502&T=0

As an alternative you can also use a QR Code:  

The GUIDs for individual cells are displayed in the table below:

Summary of computational transaction
Raw Inputview raw input (R code)
Raw Outputview raw output of R engine
Computing time1 seconds
R Server'George Udny Yule' @ 72.249.76.132


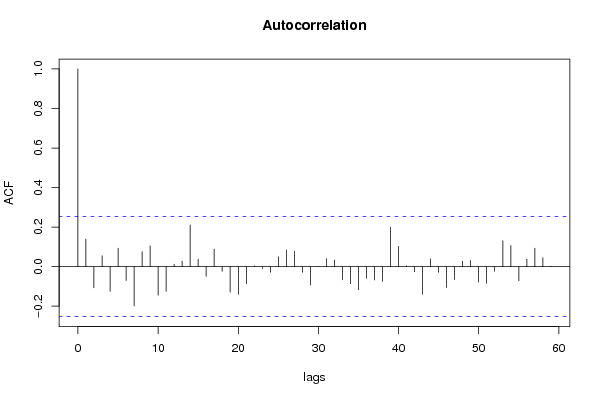
Autocorrelation Function
Time lag kACF(k)T-STATP-value
10.1393851.07970.142304
2-0.107352-0.83150.204482
30.0545350.42240.337113
4-0.125083-0.96890.168245
50.0933330.7230.236259
6-0.069929-0.54170.295027
7-0.199038-1.54170.064197
80.0758620.58760.279495
90.1050520.81370.20951
10-0.144423-1.11870.133865
11-0.124592-0.96510.169188
120.0123860.09590.461944
130.0276970.21450.415427
140.2104251.62990.054176
150.0379270.29380.384968
16-0.048881-0.37860.35315
170.088110.68250.248776
18-0.023826-0.18460.427099
19-0.129358-1.0020.160183
20-0.140034-1.08470.141197
21-0.087199-0.67540.250995
220.0038560.02990.488136
23-0.010033-0.07770.469155
24-0.028066-0.21740.414318
250.0498730.38630.350314
260.0835920.64750.25989
270.0778770.60320.274313
28-0.028841-0.22340.41199
29-0.092713-0.71810.237726
30-0.000134-0.0010.499587
310.0402320.31160.378198
320.033510.25960.398043
33-0.06668-0.51650.303702
34-0.086232-0.6680.253363
35-0.117423-0.90960.183348
36-0.059294-0.45930.323844
37-0.067531-0.52310.301419
38-0.074849-0.57980.282116
390.199611.54620.063661
400.1018760.78910.216572
410.0043770.03390.486534
42-0.025416-0.19690.422297
43-0.139551-1.0810.142021
440.0387270.30.382614
45-0.028722-0.22250.412349
46-0.105265-0.81540.209039
47-0.064775-0.50170.308841
480.0273460.21180.416483
490.0311920.24160.404953
50-0.077422-0.59970.27548
51-0.08408-0.65130.258677
52-0.023438-0.18160.428273
530.1307711.0130.157576
540.1067310.82670.205832
55-0.071719-0.55550.290297
560.0373470.28930.386679
570.0932520.72230.23645
580.0445740.34530.365551
590.0024450.01890.492477
60NANANA

\begin{tabular}{lllllllll}
\hline
Autocorrelation Function \tabularnewline
Time lag k & ACF(k) & T-STAT & P-value \tabularnewline
1 & 0.139385 & 1.0797 & 0.142304 \tabularnewline
2 & -0.107352 & -0.8315 & 0.204482 \tabularnewline
3 & 0.054535 & 0.4224 & 0.337113 \tabularnewline
4 & -0.125083 & -0.9689 & 0.168245 \tabularnewline
5 & 0.093333 & 0.723 & 0.236259 \tabularnewline
6 & -0.069929 & -0.5417 & 0.295027 \tabularnewline
7 & -0.199038 & -1.5417 & 0.064197 \tabularnewline
8 & 0.075862 & 0.5876 & 0.279495 \tabularnewline
9 & 0.105052 & 0.8137 & 0.20951 \tabularnewline
10 & -0.144423 & -1.1187 & 0.133865 \tabularnewline
11 & -0.124592 & -0.9651 & 0.169188 \tabularnewline
12 & 0.012386 & 0.0959 & 0.461944 \tabularnewline
13 & 0.027697 & 0.2145 & 0.415427 \tabularnewline
14 & 0.210425 & 1.6299 & 0.054176 \tabularnewline
15 & 0.037927 & 0.2938 & 0.384968 \tabularnewline
16 & -0.048881 & -0.3786 & 0.35315 \tabularnewline
17 & 0.08811 & 0.6825 & 0.248776 \tabularnewline
18 & -0.023826 & -0.1846 & 0.427099 \tabularnewline
19 & -0.129358 & -1.002 & 0.160183 \tabularnewline
20 & -0.140034 & -1.0847 & 0.141197 \tabularnewline
21 & -0.087199 & -0.6754 & 0.250995 \tabularnewline
22 & 0.003856 & 0.0299 & 0.488136 \tabularnewline
23 & -0.010033 & -0.0777 & 0.469155 \tabularnewline
24 & -0.028066 & -0.2174 & 0.414318 \tabularnewline
25 & 0.049873 & 0.3863 & 0.350314 \tabularnewline
26 & 0.083592 & 0.6475 & 0.25989 \tabularnewline
27 & 0.077877 & 0.6032 & 0.274313 \tabularnewline
28 & -0.028841 & -0.2234 & 0.41199 \tabularnewline
29 & -0.092713 & -0.7181 & 0.237726 \tabularnewline
30 & -0.000134 & -0.001 & 0.499587 \tabularnewline
31 & 0.040232 & 0.3116 & 0.378198 \tabularnewline
32 & 0.03351 & 0.2596 & 0.398043 \tabularnewline
33 & -0.06668 & -0.5165 & 0.303702 \tabularnewline
34 & -0.086232 & -0.668 & 0.253363 \tabularnewline
35 & -0.117423 & -0.9096 & 0.183348 \tabularnewline
36 & -0.059294 & -0.4593 & 0.323844 \tabularnewline
37 & -0.067531 & -0.5231 & 0.301419 \tabularnewline
38 & -0.074849 & -0.5798 & 0.282116 \tabularnewline
39 & 0.19961 & 1.5462 & 0.063661 \tabularnewline
40 & 0.101876 & 0.7891 & 0.216572 \tabularnewline
41 & 0.004377 & 0.0339 & 0.486534 \tabularnewline
42 & -0.025416 & -0.1969 & 0.422297 \tabularnewline
43 & -0.139551 & -1.081 & 0.142021 \tabularnewline
44 & 0.038727 & 0.3 & 0.382614 \tabularnewline
45 & -0.028722 & -0.2225 & 0.412349 \tabularnewline
46 & -0.105265 & -0.8154 & 0.209039 \tabularnewline
47 & -0.064775 & -0.5017 & 0.308841 \tabularnewline
48 & 0.027346 & 0.2118 & 0.416483 \tabularnewline
49 & 0.031192 & 0.2416 & 0.404953 \tabularnewline
50 & -0.077422 & -0.5997 & 0.27548 \tabularnewline
51 & -0.08408 & -0.6513 & 0.258677 \tabularnewline
52 & -0.023438 & -0.1816 & 0.428273 \tabularnewline
53 & 0.130771 & 1.013 & 0.157576 \tabularnewline
54 & 0.106731 & 0.8267 & 0.205832 \tabularnewline
55 & -0.071719 & -0.5555 & 0.290297 \tabularnewline
56 & 0.037347 & 0.2893 & 0.386679 \tabularnewline
57 & 0.093252 & 0.7223 & 0.23645 \tabularnewline
58 & 0.044574 & 0.3453 & 0.365551 \tabularnewline
59 & 0.002445 & 0.0189 & 0.492477 \tabularnewline
60 & NA & NA & NA \tabularnewline
\hline
\end{tabular}
%Source: https://freestatistics.org/blog/index.php?pk=35502&T=1

[TABLE]
[ROW][C]Autocorrelation Function[/C][/ROW]
[ROW][C]Time lag k[/C][C]ACF(k)[/C][C]T-STAT[/C][C]P-value[/C][/ROW]
[ROW][C]1[/C][C]0.139385[/C][C]1.0797[/C][C]0.142304[/C][/ROW]
[ROW][C]2[/C][C]-0.107352[/C][C]-0.8315[/C][C]0.204482[/C][/ROW]
[ROW][C]3[/C][C]0.054535[/C][C]0.4224[/C][C]0.337113[/C][/ROW]
[ROW][C]4[/C][C]-0.125083[/C][C]-0.9689[/C][C]0.168245[/C][/ROW]
[ROW][C]5[/C][C]0.093333[/C][C]0.723[/C][C]0.236259[/C][/ROW]
[ROW][C]6[/C][C]-0.069929[/C][C]-0.5417[/C][C]0.295027[/C][/ROW]
[ROW][C]7[/C][C]-0.199038[/C][C]-1.5417[/C][C]0.064197[/C][/ROW]
[ROW][C]8[/C][C]0.075862[/C][C]0.5876[/C][C]0.279495[/C][/ROW]
[ROW][C]9[/C][C]0.105052[/C][C]0.8137[/C][C]0.20951[/C][/ROW]
[ROW][C]10[/C][C]-0.144423[/C][C]-1.1187[/C][C]0.133865[/C][/ROW]
[ROW][C]11[/C][C]-0.124592[/C][C]-0.9651[/C][C]0.169188[/C][/ROW]
[ROW][C]12[/C][C]0.012386[/C][C]0.0959[/C][C]0.461944[/C][/ROW]
[ROW][C]13[/C][C]0.027697[/C][C]0.2145[/C][C]0.415427[/C][/ROW]
[ROW][C]14[/C][C]0.210425[/C][C]1.6299[/C][C]0.054176[/C][/ROW]
[ROW][C]15[/C][C]0.037927[/C][C]0.2938[/C][C]0.384968[/C][/ROW]
[ROW][C]16[/C][C]-0.048881[/C][C]-0.3786[/C][C]0.35315[/C][/ROW]
[ROW][C]17[/C][C]0.08811[/C][C]0.6825[/C][C]0.248776[/C][/ROW]
[ROW][C]18[/C][C]-0.023826[/C][C]-0.1846[/C][C]0.427099[/C][/ROW]
[ROW][C]19[/C][C]-0.129358[/C][C]-1.002[/C][C]0.160183[/C][/ROW]
[ROW][C]20[/C][C]-0.140034[/C][C]-1.0847[/C][C]0.141197[/C][/ROW]
[ROW][C]21[/C][C]-0.087199[/C][C]-0.6754[/C][C]0.250995[/C][/ROW]
[ROW][C]22[/C][C]0.003856[/C][C]0.0299[/C][C]0.488136[/C][/ROW]
[ROW][C]23[/C][C]-0.010033[/C][C]-0.0777[/C][C]0.469155[/C][/ROW]
[ROW][C]24[/C][C]-0.028066[/C][C]-0.2174[/C][C]0.414318[/C][/ROW]
[ROW][C]25[/C][C]0.049873[/C][C]0.3863[/C][C]0.350314[/C][/ROW]
[ROW][C]26[/C][C]0.083592[/C][C]0.6475[/C][C]0.25989[/C][/ROW]
[ROW][C]27[/C][C]0.077877[/C][C]0.6032[/C][C]0.274313[/C][/ROW]
[ROW][C]28[/C][C]-0.028841[/C][C]-0.2234[/C][C]0.41199[/C][/ROW]
[ROW][C]29[/C][C]-0.092713[/C][C]-0.7181[/C][C]0.237726[/C][/ROW]
[ROW][C]30[/C][C]-0.000134[/C][C]-0.001[/C][C]0.499587[/C][/ROW]
[ROW][C]31[/C][C]0.040232[/C][C]0.3116[/C][C]0.378198[/C][/ROW]
[ROW][C]32[/C][C]0.03351[/C][C]0.2596[/C][C]0.398043[/C][/ROW]
[ROW][C]33[/C][C]-0.06668[/C][C]-0.5165[/C][C]0.303702[/C][/ROW]
[ROW][C]34[/C][C]-0.086232[/C][C]-0.668[/C][C]0.253363[/C][/ROW]
[ROW][C]35[/C][C]-0.117423[/C][C]-0.9096[/C][C]0.183348[/C][/ROW]
[ROW][C]36[/C][C]-0.059294[/C][C]-0.4593[/C][C]0.323844[/C][/ROW]
[ROW][C]37[/C][C]-0.067531[/C][C]-0.5231[/C][C]0.301419[/C][/ROW]
[ROW][C]38[/C][C]-0.074849[/C][C]-0.5798[/C][C]0.282116[/C][/ROW]
[ROW][C]39[/C][C]0.19961[/C][C]1.5462[/C][C]0.063661[/C][/ROW]
[ROW][C]40[/C][C]0.101876[/C][C]0.7891[/C][C]0.216572[/C][/ROW]
[ROW][C]41[/C][C]0.004377[/C][C]0.0339[/C][C]0.486534[/C][/ROW]
[ROW][C]42[/C][C]-0.025416[/C][C]-0.1969[/C][C]0.422297[/C][/ROW]
[ROW][C]43[/C][C]-0.139551[/C][C]-1.081[/C][C]0.142021[/C][/ROW]
[ROW][C]44[/C][C]0.038727[/C][C]0.3[/C][C]0.382614[/C][/ROW]
[ROW][C]45[/C][C]-0.028722[/C][C]-0.2225[/C][C]0.412349[/C][/ROW]
[ROW][C]46[/C][C]-0.105265[/C][C]-0.8154[/C][C]0.209039[/C][/ROW]
[ROW][C]47[/C][C]-0.064775[/C][C]-0.5017[/C][C]0.308841[/C][/ROW]
[ROW][C]48[/C][C]0.027346[/C][C]0.2118[/C][C]0.416483[/C][/ROW]
[ROW][C]49[/C][C]0.031192[/C][C]0.2416[/C][C]0.404953[/C][/ROW]
[ROW][C]50[/C][C]-0.077422[/C][C]-0.5997[/C][C]0.27548[/C][/ROW]
[ROW][C]51[/C][C]-0.08408[/C][C]-0.6513[/C][C]0.258677[/C][/ROW]
[ROW][C]52[/C][C]-0.023438[/C][C]-0.1816[/C][C]0.428273[/C][/ROW]
[ROW][C]53[/C][C]0.130771[/C][C]1.013[/C][C]0.157576[/C][/ROW]
[ROW][C]54[/C][C]0.106731[/C][C]0.8267[/C][C]0.205832[/C][/ROW]
[ROW][C]55[/C][C]-0.071719[/C][C]-0.5555[/C][C]0.290297[/C][/ROW]
[ROW][C]56[/C][C]0.037347[/C][C]0.2893[/C][C]0.386679[/C][/ROW]
[ROW][C]57[/C][C]0.093252[/C][C]0.7223[/C][C]0.23645[/C][/ROW]
[ROW][C]58[/C][C]0.044574[/C][C]0.3453[/C][C]0.365551[/C][/ROW]
[ROW][C]59[/C][C]0.002445[/C][C]0.0189[/C][C]0.492477[/C][/ROW]
[ROW][C]60[/C][C]NA[/C][C]NA[/C][C]NA[/C][/ROW]
[/TABLE]
Source: https://freestatistics.org/blog/index.php?pk=35502&T=1

Globally Unique Identifier (entire table): ba.freestatistics.org/blog/index.php?pk=35502&T=1

As an alternative you can also use a QR Code:  

The GUIDs for individual cells are displayed in the table below:

Autocorrelation Function
Time lag kACF(k)T-STATP-value
10.1393851.07970.142304
2-0.107352-0.83150.204482
30.0545350.42240.337113
4-0.125083-0.96890.168245
50.0933330.7230.236259
6-0.069929-0.54170.295027
7-0.199038-1.54170.064197
80.0758620.58760.279495
90.1050520.81370.20951
10-0.144423-1.11870.133865
11-0.124592-0.96510.169188
120.0123860.09590.461944
130.0276970.21450.415427
140.2104251.62990.054176
150.0379270.29380.384968
16-0.048881-0.37860.35315
170.088110.68250.248776
18-0.023826-0.18460.427099
19-0.129358-1.0020.160183
20-0.140034-1.08470.141197
21-0.087199-0.67540.250995
220.0038560.02990.488136
23-0.010033-0.07770.469155
24-0.028066-0.21740.414318
250.0498730.38630.350314
260.0835920.64750.25989
270.0778770.60320.274313
28-0.028841-0.22340.41199
29-0.092713-0.71810.237726
30-0.000134-0.0010.499587
310.0402320.31160.378198
320.033510.25960.398043
33-0.06668-0.51650.303702
34-0.086232-0.6680.253363
35-0.117423-0.90960.183348
36-0.059294-0.45930.323844
37-0.067531-0.52310.301419
38-0.074849-0.57980.282116
390.199611.54620.063661
400.1018760.78910.216572
410.0043770.03390.486534
42-0.025416-0.19690.422297
43-0.139551-1.0810.142021
440.0387270.30.382614
45-0.028722-0.22250.412349
46-0.105265-0.81540.209039
47-0.064775-0.50170.308841
480.0273460.21180.416483
490.0311920.24160.404953
50-0.077422-0.59970.27548
51-0.08408-0.65130.258677
52-0.023438-0.18160.428273
530.1307711.0130.157576
540.1067310.82670.205832
55-0.071719-0.55550.290297
560.0373470.28930.386679
570.0932520.72230.23645
580.0445740.34530.365551
590.0024450.01890.492477
60NANANA


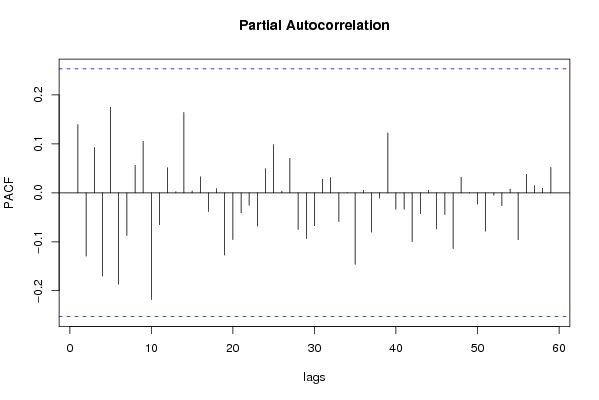
Partial Autocorrelation Function
Time lag kPACF(k)T-STATP-value
10.1393851.07970.142304
2-0.129292-1.00150.160306
30.0927770.71860.237573
4-0.17021-1.31840.096183
50.175031.35580.090126
6-0.186837-1.44720.076518
7-0.087437-0.67730.250414
80.0562950.43610.332181
90.1052270.81510.209125
10-0.218159-1.68990.048123
11-0.065072-0.5040.308037
120.051240.39690.346425
130.0023310.01810.492826
140.1641651.27160.104209
150.003840.02970.488186
160.0327840.25390.400204
17-0.038328-0.29690.38379
180.0085360.06610.473753
19-0.127165-0.9850.164285
20-0.095609-0.74060.230918
21-0.040656-0.31490.376958
22-0.025432-0.1970.422249
23-0.067927-0.52620.300357
240.0492490.38150.352098
250.098590.76370.224028
260.0035450.02750.489091
270.0704410.54560.293669
28-0.074787-0.57930.282279
29-0.093304-0.72270.236326
30-0.067094-0.51970.302589
310.0277330.21480.41532
320.0308160.23870.406074
33-0.058428-0.45260.326242
34-1.4e-05-1e-040.499957
35-0.146149-1.13210.131056
360.0052660.04080.4838
37-0.0802-0.62120.268402
38-0.010569-0.08190.467512
390.1223710.94790.173497
40-0.033719-0.26120.397423
41-0.033524-0.25970.398001
42-0.099695-0.77220.221503
43-0.042789-0.33140.370732
440.0052350.04060.483893
45-0.073895-0.57240.284598
46-0.044225-0.34260.36656
47-0.113962-0.88270.190449
480.0318270.24650.403055
496e-040.00460.498155
50-0.022908-0.17740.429879
51-0.078391-0.60720.272999
52-0.005118-0.03960.484255
53-0.026522-0.20540.418962
540.0074560.05780.477069
55-0.095823-0.74220.230419
560.0378160.29290.385295
570.0146880.11380.454898
580.0092920.0720.47143
590.051940.40230.344436
60NANANA

\begin{tabular}{lllllllll}
\hline
Partial Autocorrelation Function \tabularnewline
Time lag k & PACF(k) & T-STAT & P-value \tabularnewline
1 & 0.139385 & 1.0797 & 0.142304 \tabularnewline
2 & -0.129292 & -1.0015 & 0.160306 \tabularnewline
3 & 0.092777 & 0.7186 & 0.237573 \tabularnewline
4 & -0.17021 & -1.3184 & 0.096183 \tabularnewline
5 & 0.17503 & 1.3558 & 0.090126 \tabularnewline
6 & -0.186837 & -1.4472 & 0.076518 \tabularnewline
7 & -0.087437 & -0.6773 & 0.250414 \tabularnewline
8 & 0.056295 & 0.4361 & 0.332181 \tabularnewline
9 & 0.105227 & 0.8151 & 0.209125 \tabularnewline
10 & -0.218159 & -1.6899 & 0.048123 \tabularnewline
11 & -0.065072 & -0.504 & 0.308037 \tabularnewline
12 & 0.05124 & 0.3969 & 0.346425 \tabularnewline
13 & 0.002331 & 0.0181 & 0.492826 \tabularnewline
14 & 0.164165 & 1.2716 & 0.104209 \tabularnewline
15 & 0.00384 & 0.0297 & 0.488186 \tabularnewline
16 & 0.032784 & 0.2539 & 0.400204 \tabularnewline
17 & -0.038328 & -0.2969 & 0.38379 \tabularnewline
18 & 0.008536 & 0.0661 & 0.473753 \tabularnewline
19 & -0.127165 & -0.985 & 0.164285 \tabularnewline
20 & -0.095609 & -0.7406 & 0.230918 \tabularnewline
21 & -0.040656 & -0.3149 & 0.376958 \tabularnewline
22 & -0.025432 & -0.197 & 0.422249 \tabularnewline
23 & -0.067927 & -0.5262 & 0.300357 \tabularnewline
24 & 0.049249 & 0.3815 & 0.352098 \tabularnewline
25 & 0.09859 & 0.7637 & 0.224028 \tabularnewline
26 & 0.003545 & 0.0275 & 0.489091 \tabularnewline
27 & 0.070441 & 0.5456 & 0.293669 \tabularnewline
28 & -0.074787 & -0.5793 & 0.282279 \tabularnewline
29 & -0.093304 & -0.7227 & 0.236326 \tabularnewline
30 & -0.067094 & -0.5197 & 0.302589 \tabularnewline
31 & 0.027733 & 0.2148 & 0.41532 \tabularnewline
32 & 0.030816 & 0.2387 & 0.406074 \tabularnewline
33 & -0.058428 & -0.4526 & 0.326242 \tabularnewline
34 & -1.4e-05 & -1e-04 & 0.499957 \tabularnewline
35 & -0.146149 & -1.1321 & 0.131056 \tabularnewline
36 & 0.005266 & 0.0408 & 0.4838 \tabularnewline
37 & -0.0802 & -0.6212 & 0.268402 \tabularnewline
38 & -0.010569 & -0.0819 & 0.467512 \tabularnewline
39 & 0.122371 & 0.9479 & 0.173497 \tabularnewline
40 & -0.033719 & -0.2612 & 0.397423 \tabularnewline
41 & -0.033524 & -0.2597 & 0.398001 \tabularnewline
42 & -0.099695 & -0.7722 & 0.221503 \tabularnewline
43 & -0.042789 & -0.3314 & 0.370732 \tabularnewline
44 & 0.005235 & 0.0406 & 0.483893 \tabularnewline
45 & -0.073895 & -0.5724 & 0.284598 \tabularnewline
46 & -0.044225 & -0.3426 & 0.36656 \tabularnewline
47 & -0.113962 & -0.8827 & 0.190449 \tabularnewline
48 & 0.031827 & 0.2465 & 0.403055 \tabularnewline
49 & 6e-04 & 0.0046 & 0.498155 \tabularnewline
50 & -0.022908 & -0.1774 & 0.429879 \tabularnewline
51 & -0.078391 & -0.6072 & 0.272999 \tabularnewline
52 & -0.005118 & -0.0396 & 0.484255 \tabularnewline
53 & -0.026522 & -0.2054 & 0.418962 \tabularnewline
54 & 0.007456 & 0.0578 & 0.477069 \tabularnewline
55 & -0.095823 & -0.7422 & 0.230419 \tabularnewline
56 & 0.037816 & 0.2929 & 0.385295 \tabularnewline
57 & 0.014688 & 0.1138 & 0.454898 \tabularnewline
58 & 0.009292 & 0.072 & 0.47143 \tabularnewline
59 & 0.05194 & 0.4023 & 0.344436 \tabularnewline
60 & NA & NA & NA \tabularnewline
\hline
\end{tabular}
%Source: https://freestatistics.org/blog/index.php?pk=35502&T=2

[TABLE]
[ROW][C]Partial Autocorrelation Function[/C][/ROW]
[ROW][C]Time lag k[/C][C]PACF(k)[/C][C]T-STAT[/C][C]P-value[/C][/ROW]
[ROW][C]1[/C][C]0.139385[/C][C]1.0797[/C][C]0.142304[/C][/ROW]
[ROW][C]2[/C][C]-0.129292[/C][C]-1.0015[/C][C]0.160306[/C][/ROW]
[ROW][C]3[/C][C]0.092777[/C][C]0.7186[/C][C]0.237573[/C][/ROW]
[ROW][C]4[/C][C]-0.17021[/C][C]-1.3184[/C][C]0.096183[/C][/ROW]
[ROW][C]5[/C][C]0.17503[/C][C]1.3558[/C][C]0.090126[/C][/ROW]
[ROW][C]6[/C][C]-0.186837[/C][C]-1.4472[/C][C]0.076518[/C][/ROW]
[ROW][C]7[/C][C]-0.087437[/C][C]-0.6773[/C][C]0.250414[/C][/ROW]
[ROW][C]8[/C][C]0.056295[/C][C]0.4361[/C][C]0.332181[/C][/ROW]
[ROW][C]9[/C][C]0.105227[/C][C]0.8151[/C][C]0.209125[/C][/ROW]
[ROW][C]10[/C][C]-0.218159[/C][C]-1.6899[/C][C]0.048123[/C][/ROW]
[ROW][C]11[/C][C]-0.065072[/C][C]-0.504[/C][C]0.308037[/C][/ROW]
[ROW][C]12[/C][C]0.05124[/C][C]0.3969[/C][C]0.346425[/C][/ROW]
[ROW][C]13[/C][C]0.002331[/C][C]0.0181[/C][C]0.492826[/C][/ROW]
[ROW][C]14[/C][C]0.164165[/C][C]1.2716[/C][C]0.104209[/C][/ROW]
[ROW][C]15[/C][C]0.00384[/C][C]0.0297[/C][C]0.488186[/C][/ROW]
[ROW][C]16[/C][C]0.032784[/C][C]0.2539[/C][C]0.400204[/C][/ROW]
[ROW][C]17[/C][C]-0.038328[/C][C]-0.2969[/C][C]0.38379[/C][/ROW]
[ROW][C]18[/C][C]0.008536[/C][C]0.0661[/C][C]0.473753[/C][/ROW]
[ROW][C]19[/C][C]-0.127165[/C][C]-0.985[/C][C]0.164285[/C][/ROW]
[ROW][C]20[/C][C]-0.095609[/C][C]-0.7406[/C][C]0.230918[/C][/ROW]
[ROW][C]21[/C][C]-0.040656[/C][C]-0.3149[/C][C]0.376958[/C][/ROW]
[ROW][C]22[/C][C]-0.025432[/C][C]-0.197[/C][C]0.422249[/C][/ROW]
[ROW][C]23[/C][C]-0.067927[/C][C]-0.5262[/C][C]0.300357[/C][/ROW]
[ROW][C]24[/C][C]0.049249[/C][C]0.3815[/C][C]0.352098[/C][/ROW]
[ROW][C]25[/C][C]0.09859[/C][C]0.7637[/C][C]0.224028[/C][/ROW]
[ROW][C]26[/C][C]0.003545[/C][C]0.0275[/C][C]0.489091[/C][/ROW]
[ROW][C]27[/C][C]0.070441[/C][C]0.5456[/C][C]0.293669[/C][/ROW]
[ROW][C]28[/C][C]-0.074787[/C][C]-0.5793[/C][C]0.282279[/C][/ROW]
[ROW][C]29[/C][C]-0.093304[/C][C]-0.7227[/C][C]0.236326[/C][/ROW]
[ROW][C]30[/C][C]-0.067094[/C][C]-0.5197[/C][C]0.302589[/C][/ROW]
[ROW][C]31[/C][C]0.027733[/C][C]0.2148[/C][C]0.41532[/C][/ROW]
[ROW][C]32[/C][C]0.030816[/C][C]0.2387[/C][C]0.406074[/C][/ROW]
[ROW][C]33[/C][C]-0.058428[/C][C]-0.4526[/C][C]0.326242[/C][/ROW]
[ROW][C]34[/C][C]-1.4e-05[/C][C]-1e-04[/C][C]0.499957[/C][/ROW]
[ROW][C]35[/C][C]-0.146149[/C][C]-1.1321[/C][C]0.131056[/C][/ROW]
[ROW][C]36[/C][C]0.005266[/C][C]0.0408[/C][C]0.4838[/C][/ROW]
[ROW][C]37[/C][C]-0.0802[/C][C]-0.6212[/C][C]0.268402[/C][/ROW]
[ROW][C]38[/C][C]-0.010569[/C][C]-0.0819[/C][C]0.467512[/C][/ROW]
[ROW][C]39[/C][C]0.122371[/C][C]0.9479[/C][C]0.173497[/C][/ROW]
[ROW][C]40[/C][C]-0.033719[/C][C]-0.2612[/C][C]0.397423[/C][/ROW]
[ROW][C]41[/C][C]-0.033524[/C][C]-0.2597[/C][C]0.398001[/C][/ROW]
[ROW][C]42[/C][C]-0.099695[/C][C]-0.7722[/C][C]0.221503[/C][/ROW]
[ROW][C]43[/C][C]-0.042789[/C][C]-0.3314[/C][C]0.370732[/C][/ROW]
[ROW][C]44[/C][C]0.005235[/C][C]0.0406[/C][C]0.483893[/C][/ROW]
[ROW][C]45[/C][C]-0.073895[/C][C]-0.5724[/C][C]0.284598[/C][/ROW]
[ROW][C]46[/C][C]-0.044225[/C][C]-0.3426[/C][C]0.36656[/C][/ROW]
[ROW][C]47[/C][C]-0.113962[/C][C]-0.8827[/C][C]0.190449[/C][/ROW]
[ROW][C]48[/C][C]0.031827[/C][C]0.2465[/C][C]0.403055[/C][/ROW]
[ROW][C]49[/C][C]6e-04[/C][C]0.0046[/C][C]0.498155[/C][/ROW]
[ROW][C]50[/C][C]-0.022908[/C][C]-0.1774[/C][C]0.429879[/C][/ROW]
[ROW][C]51[/C][C]-0.078391[/C][C]-0.6072[/C][C]0.272999[/C][/ROW]
[ROW][C]52[/C][C]-0.005118[/C][C]-0.0396[/C][C]0.484255[/C][/ROW]
[ROW][C]53[/C][C]-0.026522[/C][C]-0.2054[/C][C]0.418962[/C][/ROW]
[ROW][C]54[/C][C]0.007456[/C][C]0.0578[/C][C]0.477069[/C][/ROW]
[ROW][C]55[/C][C]-0.095823[/C][C]-0.7422[/C][C]0.230419[/C][/ROW]
[ROW][C]56[/C][C]0.037816[/C][C]0.2929[/C][C]0.385295[/C][/ROW]
[ROW][C]57[/C][C]0.014688[/C][C]0.1138[/C][C]0.454898[/C][/ROW]
[ROW][C]58[/C][C]0.009292[/C][C]0.072[/C][C]0.47143[/C][/ROW]
[ROW][C]59[/C][C]0.05194[/C][C]0.4023[/C][C]0.344436[/C][/ROW]
[ROW][C]60[/C][C]NA[/C][C]NA[/C][C]NA[/C][/ROW]
[/TABLE]
Source: https://freestatistics.org/blog/index.php?pk=35502&T=2

Globally Unique Identifier (entire table): ba.freestatistics.org/blog/index.php?pk=35502&T=2

As an alternative you can also use a QR Code:  

The GUIDs for individual cells are displayed in the table below:

Partial Autocorrelation Function
Time lag kPACF(k)T-STATP-value
10.1393851.07970.142304
2-0.129292-1.00150.160306
30.0927770.71860.237573
4-0.17021-1.31840.096183
50.175031.35580.090126
6-0.186837-1.44720.076518
7-0.087437-0.67730.250414
80.0562950.43610.332181
90.1052270.81510.209125
10-0.218159-1.68990.048123
11-0.065072-0.5040.308037
120.051240.39690.346425
130.0023310.01810.492826
140.1641651.27160.104209
150.003840.02970.488186
160.0327840.25390.400204
17-0.038328-0.29690.38379
180.0085360.06610.473753
19-0.127165-0.9850.164285
20-0.095609-0.74060.230918
21-0.040656-0.31490.376958
22-0.025432-0.1970.422249
23-0.067927-0.52620.300357
240.0492490.38150.352098
250.098590.76370.224028
260.0035450.02750.489091
270.0704410.54560.293669
28-0.074787-0.57930.282279
29-0.093304-0.72270.236326
30-0.067094-0.51970.302589
310.0277330.21480.41532
320.0308160.23870.406074
33-0.058428-0.45260.326242
34-1.4e-05-1e-040.499957
35-0.146149-1.13210.131056
360.0052660.04080.4838
37-0.0802-0.62120.268402
38-0.010569-0.08190.467512
390.1223710.94790.173497
40-0.033719-0.26120.397423
41-0.033524-0.25970.398001
42-0.099695-0.77220.221503
43-0.042789-0.33140.370732
440.0052350.04060.483893
45-0.073895-0.57240.284598
46-0.044225-0.34260.36656
47-0.113962-0.88270.190449
480.0318270.24650.403055
496e-040.00460.498155
50-0.022908-0.17740.429879
51-0.078391-0.60720.272999
52-0.005118-0.03960.484255
53-0.026522-0.20540.418962
540.0074560.05780.477069
55-0.095823-0.74220.230419
560.0378160.29290.385295
570.0146880.11380.454898
580.0092920.0720.47143
590.051940.40230.344436
60NANANA


Parameters (Session):
par1 = 60 ; par2 = 1 ; par3 = 1 ; par4 = 0 ; par5 = 12 ;
Parameters (R input):
par1 = 60 ; par2 = 1 ; par3 = 1 ; par4 = 0 ; par5 = 12 ;
R code (references can be found in the software module):
if (par1 == 'Default') {
par1 = 10*log10(length(x))
} else {
par1 <- as.numeric(par1)
}
par2 <- as.numeric(par2)
par3 <- as.numeric(par3)
par4 <- as.numeric(par4)
par5 <- as.numeric(par5)
if (par2 == 0) {
x <- log(x)
} else {
x <- (x ^ par2 - 1) / par2
}
if (par3 > 0) x <- diff(x,lag=1,difference=par3)
if (par4 > 0) x <- diff(x,lag=par5,difference=par4)
bitmap(file='pic1.png')
racf <- acf(x,par1,main='Autocorrelation',xlab='lags',ylab='ACF')
dev.off()
bitmap(file='pic2.png')
rpacf <- pacf(x,par1,main='Partial Autocorrelation',xlab='lags',ylab='PACF')
dev.off()
(myacf <- c(racf$acf))
(mypacf <- c(rpacf$acf))
lengthx <- length(x)
sqrtn <- sqrt(lengthx)
load(file='createtable')
a<-table.start()
a<-table.row.start(a)
a<-table.element(a,'Autocorrelation Function',4,TRUE)
a<-table.row.end(a)
a<-table.row.start(a)
a<-table.element(a,'Time lag k',header=TRUE)
a<-table.element(a,hyperlink('basics.htm','ACF(k)','click here for more information about the Autocorrelation Function'),header=TRUE)
a<-table.element(a,'T-STAT',header=TRUE)
a<-table.element(a,'P-value',header=TRUE)
a<-table.row.end(a)
for (i in 2:(par1+1)) {
a<-table.row.start(a)
a<-table.element(a,i-1,header=TRUE)
a<-table.element(a,round(myacf[i],6))
mytstat <- myacf[i]*sqrtn
a<-table.element(a,round(mytstat,4))
a<-table.element(a,round(1-pt(abs(mytstat),lengthx),6))
a<-table.row.end(a)
}
a<-table.end(a)
table.save(a,file='mytable.tab')
a<-table.start()
a<-table.row.start(a)
a<-table.element(a,'Partial Autocorrelation Function',4,TRUE)
a<-table.row.end(a)
a<-table.row.start(a)
a<-table.element(a,'Time lag k',header=TRUE)
a<-table.element(a,hyperlink('basics.htm','PACF(k)','click here for more information about the Partial Autocorrelation Function'),header=TRUE)
a<-table.element(a,'T-STAT',header=TRUE)
a<-table.element(a,'P-value',header=TRUE)
a<-table.row.end(a)
for (i in 1:par1) {
a<-table.row.start(a)
a<-table.element(a,i,header=TRUE)
a<-table.element(a,round(mypacf[i],6))
mytstat <- mypacf[i]*sqrtn
a<-table.element(a,round(mytstat,4))
a<-table.element(a,round(1-pt(abs(mytstat),lengthx),6))
a<-table.row.end(a)
}
a<-table.end(a)
table.save(a,file='mytable1.tab')