Free Statistics

of Irreproducible Research!

Author's title

Author*The author of this computation has been verified*
R Software Modulerwasp_autocorrelation.wasp
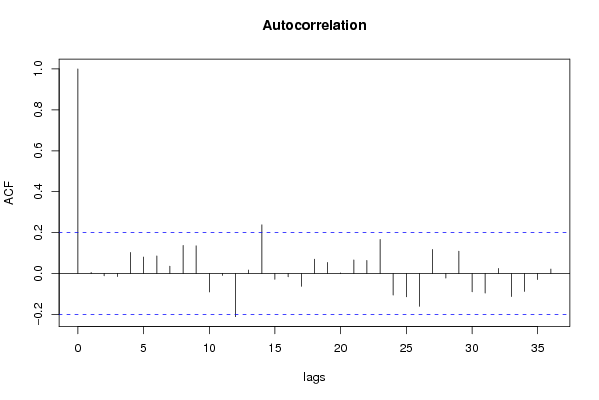
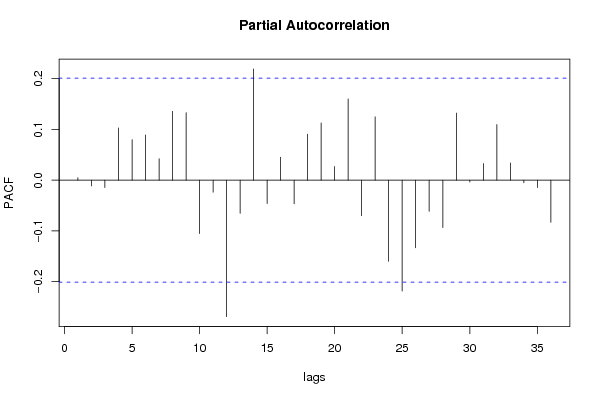
Title produced by software(Partial) Autocorrelation Function
Date of computationTue, 16 Dec 2008 15:59:25 -0700
Cite this page as followsStatistical Computations at FreeStatistics.org, Office for Research Development and Education, URL https://freestatistics.org/blog/index.php?v=date/2008/Dec/17/t1229468472eprxj8n073gffbw.htm/, Retrieved Fri, 17 May 2024 04:09:09 +0000
Statistical Computations at FreeStatistics.org, Office for Research Development and Education, URL https://freestatistics.org/blog/index.php?pk=34239, Retrieved Fri, 17 May 2024 04:09:09 +0000
QR Codes:

Original text written by user:
IsPrivate?No (this computation is public)
User-defined keywords
Estimated Impact237
Family? (F = Feedback message, R = changed R code, M = changed R Module, P = changed Parameters, D = changed Data)
F     [Univariate Data Series] [Airline data] [2007-10-18 09:58:47] [42daae401fd3def69a25014f2252b4c2]
F RMPD  [Standard Deviation-Mean Plot] [vraag 5] [2008-11-29 13:37:39] [c45c87b96bbf32ffc2144fc37d767b2e]
- RMPD    [(Partial) Autocorrelation Function] [ACF] [2008-12-12 14:04:37] [c45c87b96bbf32ffc2144fc37d767b2e]
-   P       [(Partial) Autocorrelation Function] [ACF] [2008-12-16 11:38:28] [c45c87b96bbf32ffc2144fc37d767b2e]
-    D          [(Partial) Autocorrelation Function] [acf] [2008-12-16 22:59:25] [3dc594a6c62226e1e98766c4d385bfaa] [Current]
Feedback Forum

Post a new message
Dataseries X:
524
552
532
511
492
492
493
481
462
457
442
439
488
521
501
485
464
460
467
460
448
443
436
431
484
510
513
503
471
471
476
475
470
461
455
456
517
525
523
519
509
512
519
517
510
509
501
507
569
580
578
565
547
555
562
561
555
544
537
543
594
611
613
611
594
595
591
589
584
573
567
569
621
629
628
612
595
597
593
590
580
574
573
573
620
626
620
588
566
557
561
549
532
526
511
499
555
565
542
527
510
514
517
508
493
490
469
478


Summary of computational transaction
Raw Inputview raw input (R code)
Raw Outputview raw output of R engine
Computing time2 seconds
R Server'Sir Ronald Aylmer Fisher' @ 193.190.124.24

\begin{tabular}{lllllllll}
\hline
Summary of computational transaction \tabularnewline
Raw Input & view raw input (R code)  \tabularnewline
Raw Output & view raw output of R engine  \tabularnewline
Computing time & 2 seconds \tabularnewline
R Server & 'Sir Ronald Aylmer Fisher' @ 193.190.124.24 \tabularnewline
\hline
\end{tabular}
%Source: https://freestatistics.org/blog/index.php?pk=34239&T=0

[TABLE]
[ROW][C]Summary of computational transaction[/C][/ROW]
[ROW][C]Raw Input[/C][C]view raw input (R code) [/C][/ROW]
[ROW][C]Raw Output[/C][C]view raw output of R engine [/C][/ROW]
[ROW][C]Computing time[/C][C]2 seconds[/C][/ROW]
[ROW][C]R Server[/C][C]'Sir Ronald Aylmer Fisher' @ 193.190.124.24[/C][/ROW]
[/TABLE]
Source: https://freestatistics.org/blog/index.php?pk=34239&T=0

Globally Unique Identifier (entire table): ba.freestatistics.org/blog/index.php?pk=34239&T=0

As an alternative you can also use a QR Code:  

The GUIDs for individual cells are displayed in the table below:

Summary of computational transaction
Raw Inputview raw input (R code)
Raw Outputview raw output of R engine
Computing time2 seconds
R Server'Sir Ronald Aylmer Fisher' @ 193.190.124.24


Autocorrelation Function
Time lag kACF(k)T-STATP-value
10.0048680.04740.481128
2-0.011288-0.110.456311
3-0.014584-0.14210.443632
40.1029321.00330.159143
50.0804140.78380.217558
60.0859940.83820.20202
70.0355460.34650.364881
80.1370581.33590.09239
90.1354171.31990.095023
10-0.089689-0.87420.192113
11-0.009183-0.08950.464435
12-0.210666-2.05330.021395
130.0169920.16560.434405
140.2380492.32020.011235
15-0.027571-0.26870.39436
16-0.015954-0.15550.438379
17-0.062297-0.60720.272584
180.0701410.68370.24793
190.0540130.52640.299901
200.0027690.0270.489261
210.0666790.64990.258659
220.0642810.62650.266235
230.1669761.62750.053474
24-0.105051-1.02390.154238
25-0.113691-1.10810.135303
26-0.160423-1.56360.060618
270.1176051.14630.12728
28-0.022109-0.21550.414925
290.1091651.0640.145011
30-0.089462-0.8720.192712
31-0.095439-0.93020.177306
320.0250080.24370.403977
33-0.112358-1.09510.138114
34-0.087205-0.850.198739
35-0.029526-0.28780.387068
360.0216430.2110.416688

\begin{tabular}{lllllllll}
\hline
Autocorrelation Function \tabularnewline
Time lag k & ACF(k) & T-STAT & P-value \tabularnewline
1 & 0.004868 & 0.0474 & 0.481128 \tabularnewline
2 & -0.011288 & -0.11 & 0.456311 \tabularnewline
3 & -0.014584 & -0.1421 & 0.443632 \tabularnewline
4 & 0.102932 & 1.0033 & 0.159143 \tabularnewline
5 & 0.080414 & 0.7838 & 0.217558 \tabularnewline
6 & 0.085994 & 0.8382 & 0.20202 \tabularnewline
7 & 0.035546 & 0.3465 & 0.364881 \tabularnewline
8 & 0.137058 & 1.3359 & 0.09239 \tabularnewline
9 & 0.135417 & 1.3199 & 0.095023 \tabularnewline
10 & -0.089689 & -0.8742 & 0.192113 \tabularnewline
11 & -0.009183 & -0.0895 & 0.464435 \tabularnewline
12 & -0.210666 & -2.0533 & 0.021395 \tabularnewline
13 & 0.016992 & 0.1656 & 0.434405 \tabularnewline
14 & 0.238049 & 2.3202 & 0.011235 \tabularnewline
15 & -0.027571 & -0.2687 & 0.39436 \tabularnewline
16 & -0.015954 & -0.1555 & 0.438379 \tabularnewline
17 & -0.062297 & -0.6072 & 0.272584 \tabularnewline
18 & 0.070141 & 0.6837 & 0.24793 \tabularnewline
19 & 0.054013 & 0.5264 & 0.299901 \tabularnewline
20 & 0.002769 & 0.027 & 0.489261 \tabularnewline
21 & 0.066679 & 0.6499 & 0.258659 \tabularnewline
22 & 0.064281 & 0.6265 & 0.266235 \tabularnewline
23 & 0.166976 & 1.6275 & 0.053474 \tabularnewline
24 & -0.105051 & -1.0239 & 0.154238 \tabularnewline
25 & -0.113691 & -1.1081 & 0.135303 \tabularnewline
26 & -0.160423 & -1.5636 & 0.060618 \tabularnewline
27 & 0.117605 & 1.1463 & 0.12728 \tabularnewline
28 & -0.022109 & -0.2155 & 0.414925 \tabularnewline
29 & 0.109165 & 1.064 & 0.145011 \tabularnewline
30 & -0.089462 & -0.872 & 0.192712 \tabularnewline
31 & -0.095439 & -0.9302 & 0.177306 \tabularnewline
32 & 0.025008 & 0.2437 & 0.403977 \tabularnewline
33 & -0.112358 & -1.0951 & 0.138114 \tabularnewline
34 & -0.087205 & -0.85 & 0.198739 \tabularnewline
35 & -0.029526 & -0.2878 & 0.387068 \tabularnewline
36 & 0.021643 & 0.211 & 0.416688 \tabularnewline
\hline
\end{tabular}
%Source: https://freestatistics.org/blog/index.php?pk=34239&T=1

[TABLE]
[ROW][C]Autocorrelation Function[/C][/ROW]
[ROW][C]Time lag k[/C][C]ACF(k)[/C][C]T-STAT[/C][C]P-value[/C][/ROW]
[ROW][C]1[/C][C]0.004868[/C][C]0.0474[/C][C]0.481128[/C][/ROW]
[ROW][C]2[/C][C]-0.011288[/C][C]-0.11[/C][C]0.456311[/C][/ROW]
[ROW][C]3[/C][C]-0.014584[/C][C]-0.1421[/C][C]0.443632[/C][/ROW]
[ROW][C]4[/C][C]0.102932[/C][C]1.0033[/C][C]0.159143[/C][/ROW]
[ROW][C]5[/C][C]0.080414[/C][C]0.7838[/C][C]0.217558[/C][/ROW]
[ROW][C]6[/C][C]0.085994[/C][C]0.8382[/C][C]0.20202[/C][/ROW]
[ROW][C]7[/C][C]0.035546[/C][C]0.3465[/C][C]0.364881[/C][/ROW]
[ROW][C]8[/C][C]0.137058[/C][C]1.3359[/C][C]0.09239[/C][/ROW]
[ROW][C]9[/C][C]0.135417[/C][C]1.3199[/C][C]0.095023[/C][/ROW]
[ROW][C]10[/C][C]-0.089689[/C][C]-0.8742[/C][C]0.192113[/C][/ROW]
[ROW][C]11[/C][C]-0.009183[/C][C]-0.0895[/C][C]0.464435[/C][/ROW]
[ROW][C]12[/C][C]-0.210666[/C][C]-2.0533[/C][C]0.021395[/C][/ROW]
[ROW][C]13[/C][C]0.016992[/C][C]0.1656[/C][C]0.434405[/C][/ROW]
[ROW][C]14[/C][C]0.238049[/C][C]2.3202[/C][C]0.011235[/C][/ROW]
[ROW][C]15[/C][C]-0.027571[/C][C]-0.2687[/C][C]0.39436[/C][/ROW]
[ROW][C]16[/C][C]-0.015954[/C][C]-0.1555[/C][C]0.438379[/C][/ROW]
[ROW][C]17[/C][C]-0.062297[/C][C]-0.6072[/C][C]0.272584[/C][/ROW]
[ROW][C]18[/C][C]0.070141[/C][C]0.6837[/C][C]0.24793[/C][/ROW]
[ROW][C]19[/C][C]0.054013[/C][C]0.5264[/C][C]0.299901[/C][/ROW]
[ROW][C]20[/C][C]0.002769[/C][C]0.027[/C][C]0.489261[/C][/ROW]
[ROW][C]21[/C][C]0.066679[/C][C]0.6499[/C][C]0.258659[/C][/ROW]
[ROW][C]22[/C][C]0.064281[/C][C]0.6265[/C][C]0.266235[/C][/ROW]
[ROW][C]23[/C][C]0.166976[/C][C]1.6275[/C][C]0.053474[/C][/ROW]
[ROW][C]24[/C][C]-0.105051[/C][C]-1.0239[/C][C]0.154238[/C][/ROW]
[ROW][C]25[/C][C]-0.113691[/C][C]-1.1081[/C][C]0.135303[/C][/ROW]
[ROW][C]26[/C][C]-0.160423[/C][C]-1.5636[/C][C]0.060618[/C][/ROW]
[ROW][C]27[/C][C]0.117605[/C][C]1.1463[/C][C]0.12728[/C][/ROW]
[ROW][C]28[/C][C]-0.022109[/C][C]-0.2155[/C][C]0.414925[/C][/ROW]
[ROW][C]29[/C][C]0.109165[/C][C]1.064[/C][C]0.145011[/C][/ROW]
[ROW][C]30[/C][C]-0.089462[/C][C]-0.872[/C][C]0.192712[/C][/ROW]
[ROW][C]31[/C][C]-0.095439[/C][C]-0.9302[/C][C]0.177306[/C][/ROW]
[ROW][C]32[/C][C]0.025008[/C][C]0.2437[/C][C]0.403977[/C][/ROW]
[ROW][C]33[/C][C]-0.112358[/C][C]-1.0951[/C][C]0.138114[/C][/ROW]
[ROW][C]34[/C][C]-0.087205[/C][C]-0.85[/C][C]0.198739[/C][/ROW]
[ROW][C]35[/C][C]-0.029526[/C][C]-0.2878[/C][C]0.387068[/C][/ROW]
[ROW][C]36[/C][C]0.021643[/C][C]0.211[/C][C]0.416688[/C][/ROW]
[/TABLE]
Source: https://freestatistics.org/blog/index.php?pk=34239&T=1

Globally Unique Identifier (entire table): ba.freestatistics.org/blog/index.php?pk=34239&T=1

As an alternative you can also use a QR Code:  

The GUIDs for individual cells are displayed in the table below:

Autocorrelation Function
Time lag kACF(k)T-STATP-value
10.0048680.04740.481128
2-0.011288-0.110.456311
3-0.014584-0.14210.443632
40.1029321.00330.159143
50.0804140.78380.217558
60.0859940.83820.20202
70.0355460.34650.364881
80.1370581.33590.09239
90.1354171.31990.095023
10-0.089689-0.87420.192113
11-0.009183-0.08950.464435
12-0.210666-2.05330.021395
130.0169920.16560.434405
140.2380492.32020.011235
15-0.027571-0.26870.39436
16-0.015954-0.15550.438379
17-0.062297-0.60720.272584
180.0701410.68370.24793
190.0540130.52640.299901
200.0027690.0270.489261
210.0666790.64990.258659
220.0642810.62650.266235
230.1669761.62750.053474
24-0.105051-1.02390.154238
25-0.113691-1.10810.135303
26-0.160423-1.56360.060618
270.1176051.14630.12728
28-0.022109-0.21550.414925
290.1091651.0640.145011
30-0.089462-0.8720.192712
31-0.095439-0.93020.177306
320.0250080.24370.403977
33-0.112358-1.09510.138114
34-0.087205-0.850.198739
35-0.029526-0.28780.387068
360.0216430.2110.416688


Partial Autocorrelation Function
Time lag kPACF(k)T-STATP-value
10.0048680.04740.481128
2-0.011312-0.11030.456218
3-0.014476-0.14110.444048
40.1029821.00370.159026
50.0798290.77810.219229
60.0891690.86910.193488
70.0421370.41070.341108
80.1356771.32240.094602
90.1329391.29570.099105
10-0.105149-1.02490.154016
11-0.023629-0.23030.409174
12-0.268951-2.62140.005099
13-0.065107-0.63460.263613
140.2192062.13660.017602
15-0.045975-0.44810.327547
160.0450860.43940.330669
17-0.046697-0.45510.325022
180.0906670.88370.189542
190.1126441.09790.137507
200.0267220.26050.397539
210.1600311.55980.061067
22-0.069916-0.68150.248621
230.1248071.21650.11341
24-0.159826-1.55780.061304
25-0.218631-2.13090.017838
26-0.133396-1.30020.098342
27-0.061177-0.59630.276204
28-0.093354-0.90990.182589
290.1322221.28870.100309
30-0.003518-0.03430.48636
310.0327150.31890.375265
320.1095281.06760.144214
330.0338110.32950.371235
34-0.005051-0.04920.48042
35-0.014557-0.14190.443736
36-0.083043-0.80940.210153

\begin{tabular}{lllllllll}
\hline
Partial Autocorrelation Function \tabularnewline
Time lag k & PACF(k) & T-STAT & P-value \tabularnewline
1 & 0.004868 & 0.0474 & 0.481128 \tabularnewline
2 & -0.011312 & -0.1103 & 0.456218 \tabularnewline
3 & -0.014476 & -0.1411 & 0.444048 \tabularnewline
4 & 0.102982 & 1.0037 & 0.159026 \tabularnewline
5 & 0.079829 & 0.7781 & 0.219229 \tabularnewline
6 & 0.089169 & 0.8691 & 0.193488 \tabularnewline
7 & 0.042137 & 0.4107 & 0.341108 \tabularnewline
8 & 0.135677 & 1.3224 & 0.094602 \tabularnewline
9 & 0.132939 & 1.2957 & 0.099105 \tabularnewline
10 & -0.105149 & -1.0249 & 0.154016 \tabularnewline
11 & -0.023629 & -0.2303 & 0.409174 \tabularnewline
12 & -0.268951 & -2.6214 & 0.005099 \tabularnewline
13 & -0.065107 & -0.6346 & 0.263613 \tabularnewline
14 & 0.219206 & 2.1366 & 0.017602 \tabularnewline
15 & -0.045975 & -0.4481 & 0.327547 \tabularnewline
16 & 0.045086 & 0.4394 & 0.330669 \tabularnewline
17 & -0.046697 & -0.4551 & 0.325022 \tabularnewline
18 & 0.090667 & 0.8837 & 0.189542 \tabularnewline
19 & 0.112644 & 1.0979 & 0.137507 \tabularnewline
20 & 0.026722 & 0.2605 & 0.397539 \tabularnewline
21 & 0.160031 & 1.5598 & 0.061067 \tabularnewline
22 & -0.069916 & -0.6815 & 0.248621 \tabularnewline
23 & 0.124807 & 1.2165 & 0.11341 \tabularnewline
24 & -0.159826 & -1.5578 & 0.061304 \tabularnewline
25 & -0.218631 & -2.1309 & 0.017838 \tabularnewline
26 & -0.133396 & -1.3002 & 0.098342 \tabularnewline
27 & -0.061177 & -0.5963 & 0.276204 \tabularnewline
28 & -0.093354 & -0.9099 & 0.182589 \tabularnewline
29 & 0.132222 & 1.2887 & 0.100309 \tabularnewline
30 & -0.003518 & -0.0343 & 0.48636 \tabularnewline
31 & 0.032715 & 0.3189 & 0.375265 \tabularnewline
32 & 0.109528 & 1.0676 & 0.144214 \tabularnewline
33 & 0.033811 & 0.3295 & 0.371235 \tabularnewline
34 & -0.005051 & -0.0492 & 0.48042 \tabularnewline
35 & -0.014557 & -0.1419 & 0.443736 \tabularnewline
36 & -0.083043 & -0.8094 & 0.210153 \tabularnewline
\hline
\end{tabular}
%Source: https://freestatistics.org/blog/index.php?pk=34239&T=2

[TABLE]
[ROW][C]Partial Autocorrelation Function[/C][/ROW]
[ROW][C]Time lag k[/C][C]PACF(k)[/C][C]T-STAT[/C][C]P-value[/C][/ROW]
[ROW][C]1[/C][C]0.004868[/C][C]0.0474[/C][C]0.481128[/C][/ROW]
[ROW][C]2[/C][C]-0.011312[/C][C]-0.1103[/C][C]0.456218[/C][/ROW]
[ROW][C]3[/C][C]-0.014476[/C][C]-0.1411[/C][C]0.444048[/C][/ROW]
[ROW][C]4[/C][C]0.102982[/C][C]1.0037[/C][C]0.159026[/C][/ROW]
[ROW][C]5[/C][C]0.079829[/C][C]0.7781[/C][C]0.219229[/C][/ROW]
[ROW][C]6[/C][C]0.089169[/C][C]0.8691[/C][C]0.193488[/C][/ROW]
[ROW][C]7[/C][C]0.042137[/C][C]0.4107[/C][C]0.341108[/C][/ROW]
[ROW][C]8[/C][C]0.135677[/C][C]1.3224[/C][C]0.094602[/C][/ROW]
[ROW][C]9[/C][C]0.132939[/C][C]1.2957[/C][C]0.099105[/C][/ROW]
[ROW][C]10[/C][C]-0.105149[/C][C]-1.0249[/C][C]0.154016[/C][/ROW]
[ROW][C]11[/C][C]-0.023629[/C][C]-0.2303[/C][C]0.409174[/C][/ROW]
[ROW][C]12[/C][C]-0.268951[/C][C]-2.6214[/C][C]0.005099[/C][/ROW]
[ROW][C]13[/C][C]-0.065107[/C][C]-0.6346[/C][C]0.263613[/C][/ROW]
[ROW][C]14[/C][C]0.219206[/C][C]2.1366[/C][C]0.017602[/C][/ROW]
[ROW][C]15[/C][C]-0.045975[/C][C]-0.4481[/C][C]0.327547[/C][/ROW]
[ROW][C]16[/C][C]0.045086[/C][C]0.4394[/C][C]0.330669[/C][/ROW]
[ROW][C]17[/C][C]-0.046697[/C][C]-0.4551[/C][C]0.325022[/C][/ROW]
[ROW][C]18[/C][C]0.090667[/C][C]0.8837[/C][C]0.189542[/C][/ROW]
[ROW][C]19[/C][C]0.112644[/C][C]1.0979[/C][C]0.137507[/C][/ROW]
[ROW][C]20[/C][C]0.026722[/C][C]0.2605[/C][C]0.397539[/C][/ROW]
[ROW][C]21[/C][C]0.160031[/C][C]1.5598[/C][C]0.061067[/C][/ROW]
[ROW][C]22[/C][C]-0.069916[/C][C]-0.6815[/C][C]0.248621[/C][/ROW]
[ROW][C]23[/C][C]0.124807[/C][C]1.2165[/C][C]0.11341[/C][/ROW]
[ROW][C]24[/C][C]-0.159826[/C][C]-1.5578[/C][C]0.061304[/C][/ROW]
[ROW][C]25[/C][C]-0.218631[/C][C]-2.1309[/C][C]0.017838[/C][/ROW]
[ROW][C]26[/C][C]-0.133396[/C][C]-1.3002[/C][C]0.098342[/C][/ROW]
[ROW][C]27[/C][C]-0.061177[/C][C]-0.5963[/C][C]0.276204[/C][/ROW]
[ROW][C]28[/C][C]-0.093354[/C][C]-0.9099[/C][C]0.182589[/C][/ROW]
[ROW][C]29[/C][C]0.132222[/C][C]1.2887[/C][C]0.100309[/C][/ROW]
[ROW][C]30[/C][C]-0.003518[/C][C]-0.0343[/C][C]0.48636[/C][/ROW]
[ROW][C]31[/C][C]0.032715[/C][C]0.3189[/C][C]0.375265[/C][/ROW]
[ROW][C]32[/C][C]0.109528[/C][C]1.0676[/C][C]0.144214[/C][/ROW]
[ROW][C]33[/C][C]0.033811[/C][C]0.3295[/C][C]0.371235[/C][/ROW]
[ROW][C]34[/C][C]-0.005051[/C][C]-0.0492[/C][C]0.48042[/C][/ROW]
[ROW][C]35[/C][C]-0.014557[/C][C]-0.1419[/C][C]0.443736[/C][/ROW]
[ROW][C]36[/C][C]-0.083043[/C][C]-0.8094[/C][C]0.210153[/C][/ROW]
[/TABLE]
Source: https://freestatistics.org/blog/index.php?pk=34239&T=2

Globally Unique Identifier (entire table): ba.freestatistics.org/blog/index.php?pk=34239&T=2

As an alternative you can also use a QR Code:  

The GUIDs for individual cells are displayed in the table below:

Partial Autocorrelation Function
Time lag kPACF(k)T-STATP-value
10.0048680.04740.481128
2-0.011312-0.11030.456218
3-0.014476-0.14110.444048
40.1029821.00370.159026
50.0798290.77810.219229
60.0891690.86910.193488
70.0421370.41070.341108
80.1356771.32240.094602
90.1329391.29570.099105
10-0.105149-1.02490.154016
11-0.023629-0.23030.409174
12-0.268951-2.62140.005099
13-0.065107-0.63460.263613
140.2192062.13660.017602
15-0.045975-0.44810.327547
160.0450860.43940.330669
17-0.046697-0.45510.325022
180.0906670.88370.189542
190.1126441.09790.137507
200.0267220.26050.397539
210.1600311.55980.061067
22-0.069916-0.68150.248621
230.1248071.21650.11341
24-0.159826-1.55780.061304
25-0.218631-2.13090.017838
26-0.133396-1.30020.098342
27-0.061177-0.59630.276204
28-0.093354-0.90990.182589
290.1322221.28870.100309
30-0.003518-0.03430.48636
310.0327150.31890.375265
320.1095281.06760.144214
330.0338110.32950.371235
34-0.005051-0.04920.48042
35-0.014557-0.14190.443736
36-0.083043-0.80940.210153


Parameters (Session):
par1 = 36 ; par2 = 1 ; par3 = 1 ; par4 = 1 ; par5 = 12 ;
Parameters (R input):
par1 = 36 ; par2 = 1 ; par3 = 1 ; par4 = 1 ; par5 = 12 ;
R code (references can be found in the software module):
if (par1 == 'Default') {
par1 = 10*log10(length(x))
} else {
par1 <- as.numeric(par1)
}
par2 <- as.numeric(par2)
par3 <- as.numeric(par3)
par4 <- as.numeric(par4)
par5 <- as.numeric(par5)
if (par2 == 0) {
x <- log(x)
} else {
x <- (x ^ par2 - 1) / par2
}
if (par3 > 0) x <- diff(x,lag=1,difference=par3)
if (par4 > 0) x <- diff(x,lag=par5,difference=par4)
bitmap(file='pic1.png')
racf <- acf(x,par1,main='Autocorrelation',xlab='lags',ylab='ACF')
dev.off()
bitmap(file='pic2.png')
rpacf <- pacf(x,par1,main='Partial Autocorrelation',xlab='lags',ylab='PACF')
dev.off()
(myacf <- c(racf$acf))
(mypacf <- c(rpacf$acf))
lengthx <- length(x)
sqrtn <- sqrt(lengthx)
load(file='createtable')
a<-table.start()
a<-table.row.start(a)
a<-table.element(a,'Autocorrelation Function',4,TRUE)
a<-table.row.end(a)
a<-table.row.start(a)
a<-table.element(a,'Time lag k',header=TRUE)
a<-table.element(a,hyperlink('basics.htm','ACF(k)','click here for more information about the Autocorrelation Function'),header=TRUE)
a<-table.element(a,'T-STAT',header=TRUE)
a<-table.element(a,'P-value',header=TRUE)
a<-table.row.end(a)
for (i in 2:(par1+1)) {
a<-table.row.start(a)
a<-table.element(a,i-1,header=TRUE)
a<-table.element(a,round(myacf[i],6))
mytstat <- myacf[i]*sqrtn
a<-table.element(a,round(mytstat,4))
a<-table.element(a,round(1-pt(abs(mytstat),lengthx),6))
a<-table.row.end(a)
}
a<-table.end(a)
table.save(a,file='mytable.tab')
a<-table.start()
a<-table.row.start(a)
a<-table.element(a,'Partial Autocorrelation Function',4,TRUE)
a<-table.row.end(a)
a<-table.row.start(a)
a<-table.element(a,'Time lag k',header=TRUE)
a<-table.element(a,hyperlink('basics.htm','PACF(k)','click here for more information about the Partial Autocorrelation Function'),header=TRUE)
a<-table.element(a,'T-STAT',header=TRUE)
a<-table.element(a,'P-value',header=TRUE)
a<-table.row.end(a)
for (i in 1:par1) {
a<-table.row.start(a)
a<-table.element(a,i,header=TRUE)
a<-table.element(a,round(mypacf[i],6))
mytstat <- mypacf[i]*sqrtn
a<-table.element(a,round(mytstat,4))
a<-table.element(a,round(1-pt(abs(mytstat),lengthx),6))
a<-table.row.end(a)
}
a<-table.end(a)
table.save(a,file='mytable1.tab')