Free Statistics

of Irreproducible Research!

Author's title

(Partial) Autocorrelation Function Totaal # niet-werkende werkzoekende mann...

Author*The author of this computation has been verified*
R Software Modulerwasp_autocorrelation.wasp
Title produced by software(Partial) Autocorrelation Function
Date of computationSat, 13 Dec 2008 07:53:48 -0700
Cite this page as followsStatistical Computations at FreeStatistics.org, Office for Research Development and Education, URL https://freestatistics.org/blog/index.php?v=date/2008/Dec/13/t1229180297hj56tl15d6t1fp5.htm/, Retrieved Fri, 17 May 2024 05:14:35 +0000
Statistical Computations at FreeStatistics.org, Office for Research Development and Education, URL https://freestatistics.org/blog/index.php?pk=33138, Retrieved Fri, 17 May 2024 05:14:35 +0000
QR Codes:

Original text written by user:Time lags: 60 Lambda: 1 D: 1 d: 1 Seizoenale periode: 12
IsPrivate?No (this computation is public)
User-defined keywords(Partial) Autocorrelation Function Totaal niet-werkende werkzoekende mannen Vlaams gewest
Estimated Impact148
Family? (F = Feedback message, R = changed R code, M = changed R Module, P = changed Parameters, D = changed Data)
-       [(Partial) Autocorrelation Function] [(Partial) Autocor...] [2008-12-13 14:53:48] [f4b2017b314c03698059f43b95818e67] [Current]
Feedback Forum

Post a new message
Dataseries X:
106099
103235
98857
101107
102700
101477
99639
96622
94697
95093
112885
121162
113624
111632
106707
108827
108413
106249
104861
102382
100320
100228
117089
121523
114948
112831
107605
108928
101993
102850
99925
101536
99450
98305
110159
109483
106810
96279
91982
90276
90999
86622
83117
80367
77550
77443
92844
92175
84822
81632
78872
81485
80651
78192
76844
76335
71415
73899
86822
86371
83469
82662


Summary of computational transaction
Raw Inputview raw input (R code)
Raw Outputview raw output of R engine
Computing time3 seconds
R Server'Herman Ole Andreas Wold' @ 193.190.124.10:1001

\begin{tabular}{lllllllll}
\hline
Summary of computational transaction \tabularnewline
Raw Input & view raw input (R code)  \tabularnewline
Raw Output & view raw output of R engine  \tabularnewline
Computing time & 3 seconds \tabularnewline
R Server & 'Herman Ole Andreas Wold' @ 193.190.124.10:1001 \tabularnewline
\hline
\end{tabular}
%Source: https://freestatistics.org/blog/index.php?pk=33138&T=0

[TABLE]
[ROW][C]Summary of computational transaction[/C][/ROW]
[ROW][C]Raw Input[/C][C]view raw input (R code) [/C][/ROW]
[ROW][C]Raw Output[/C][C]view raw output of R engine [/C][/ROW]
[ROW][C]Computing time[/C][C]3 seconds[/C][/ROW]
[ROW][C]R Server[/C][C]'Herman Ole Andreas Wold' @ 193.190.124.10:1001[/C][/ROW]
[/TABLE]
Source: https://freestatistics.org/blog/index.php?pk=33138&T=0

Globally Unique Identifier (entire table): ba.freestatistics.org/blog/index.php?pk=33138&T=0

As an alternative you can also use a QR Code:  

The GUIDs for individual cells are displayed in the table below:

Summary of computational transaction
Raw Inputview raw input (R code)
Raw Outputview raw output of R engine
Computing time3 seconds
R Server'Herman Ole Andreas Wold' @ 193.190.124.10:1001


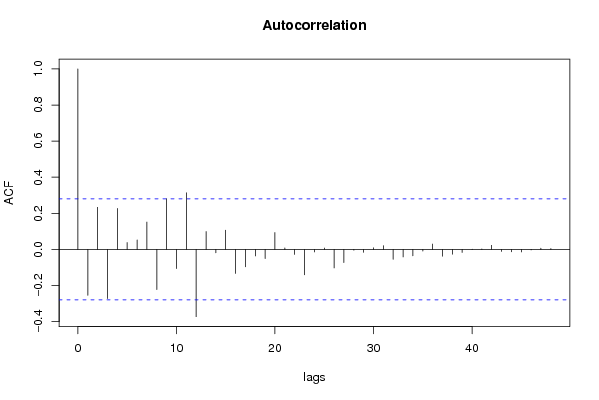
Autocorrelation Function
Time lag kACF(k)T-STATP-value
1-0.254502-1.78150.040513
20.2332541.63280.054463
3-0.272329-1.90630.031242
40.2272611.59080.05904
50.0380980.26670.395414
60.0523160.36620.357891
70.1517111.0620.146726
8-0.222348-1.55640.06302
90.2810751.96750.027398
10-0.106265-0.74390.230259
110.3138622.1970.016389
12-0.372709-2.6090.006004
130.0985520.68990.246767
14-0.018835-0.13180.447823
150.1067240.74710.229296
16-0.133493-0.93440.177328
17-0.096727-0.67710.250767
18-0.036274-0.25390.400311
19-0.050926-0.35650.361505
200.0933340.65330.258296
210.0080760.05650.477573
22-0.027828-0.19480.423178
23-0.140751-0.98530.164668
24-0.014256-0.09980.460457
250.0072280.05060.479927
26-0.102845-0.71990.2375
27-0.072686-0.50880.306588
28-0.004637-0.03250.487119
29-0.015889-0.11120.455948
300.0089260.06250.475216
310.0203620.14250.443622
32-0.055275-0.38690.350244
33-0.04197-0.29380.38508
34-0.035835-0.25080.401493
35-0.009495-0.06650.47364
360.0298070.20860.417794
37-0.037726-0.26410.396413
38-0.026239-0.18370.427514
39-0.016929-0.11850.453078
400.0010880.00760.496977
410.0026460.01850.492648
420.0225760.1580.437539
43-0.011622-0.08140.467747
44-0.013371-0.09360.462905
45-0.013929-0.09750.461362
46-0.002979-0.02090.491723
470.0068860.04820.480876
480.0048850.03420.486429
49NANANA
50NANANA
51NANANA
52NANANA
53NANANA
54NANANA
55NANANA
56NANANA
57NANANA
58NANANA
59NANANA
60NANANA

\begin{tabular}{lllllllll}
\hline
Autocorrelation Function \tabularnewline
Time lag k & ACF(k) & T-STAT & P-value \tabularnewline
1 & -0.254502 & -1.7815 & 0.040513 \tabularnewline
2 & 0.233254 & 1.6328 & 0.054463 \tabularnewline
3 & -0.272329 & -1.9063 & 0.031242 \tabularnewline
4 & 0.227261 & 1.5908 & 0.05904 \tabularnewline
5 & 0.038098 & 0.2667 & 0.395414 \tabularnewline
6 & 0.052316 & 0.3662 & 0.357891 \tabularnewline
7 & 0.151711 & 1.062 & 0.146726 \tabularnewline
8 & -0.222348 & -1.5564 & 0.06302 \tabularnewline
9 & 0.281075 & 1.9675 & 0.027398 \tabularnewline
10 & -0.106265 & -0.7439 & 0.230259 \tabularnewline
11 & 0.313862 & 2.197 & 0.016389 \tabularnewline
12 & -0.372709 & -2.609 & 0.006004 \tabularnewline
13 & 0.098552 & 0.6899 & 0.246767 \tabularnewline
14 & -0.018835 & -0.1318 & 0.447823 \tabularnewline
15 & 0.106724 & 0.7471 & 0.229296 \tabularnewline
16 & -0.133493 & -0.9344 & 0.177328 \tabularnewline
17 & -0.096727 & -0.6771 & 0.250767 \tabularnewline
18 & -0.036274 & -0.2539 & 0.400311 \tabularnewline
19 & -0.050926 & -0.3565 & 0.361505 \tabularnewline
20 & 0.093334 & 0.6533 & 0.258296 \tabularnewline
21 & 0.008076 & 0.0565 & 0.477573 \tabularnewline
22 & -0.027828 & -0.1948 & 0.423178 \tabularnewline
23 & -0.140751 & -0.9853 & 0.164668 \tabularnewline
24 & -0.014256 & -0.0998 & 0.460457 \tabularnewline
25 & 0.007228 & 0.0506 & 0.479927 \tabularnewline
26 & -0.102845 & -0.7199 & 0.2375 \tabularnewline
27 & -0.072686 & -0.5088 & 0.306588 \tabularnewline
28 & -0.004637 & -0.0325 & 0.487119 \tabularnewline
29 & -0.015889 & -0.1112 & 0.455948 \tabularnewline
30 & 0.008926 & 0.0625 & 0.475216 \tabularnewline
31 & 0.020362 & 0.1425 & 0.443622 \tabularnewline
32 & -0.055275 & -0.3869 & 0.350244 \tabularnewline
33 & -0.04197 & -0.2938 & 0.38508 \tabularnewline
34 & -0.035835 & -0.2508 & 0.401493 \tabularnewline
35 & -0.009495 & -0.0665 & 0.47364 \tabularnewline
36 & 0.029807 & 0.2086 & 0.417794 \tabularnewline
37 & -0.037726 & -0.2641 & 0.396413 \tabularnewline
38 & -0.026239 & -0.1837 & 0.427514 \tabularnewline
39 & -0.016929 & -0.1185 & 0.453078 \tabularnewline
40 & 0.001088 & 0.0076 & 0.496977 \tabularnewline
41 & 0.002646 & 0.0185 & 0.492648 \tabularnewline
42 & 0.022576 & 0.158 & 0.437539 \tabularnewline
43 & -0.011622 & -0.0814 & 0.467747 \tabularnewline
44 & -0.013371 & -0.0936 & 0.462905 \tabularnewline
45 & -0.013929 & -0.0975 & 0.461362 \tabularnewline
46 & -0.002979 & -0.0209 & 0.491723 \tabularnewline
47 & 0.006886 & 0.0482 & 0.480876 \tabularnewline
48 & 0.004885 & 0.0342 & 0.486429 \tabularnewline
49 & NA & NA & NA \tabularnewline
50 & NA & NA & NA \tabularnewline
51 & NA & NA & NA \tabularnewline
52 & NA & NA & NA \tabularnewline
53 & NA & NA & NA \tabularnewline
54 & NA & NA & NA \tabularnewline
55 & NA & NA & NA \tabularnewline
56 & NA & NA & NA \tabularnewline
57 & NA & NA & NA \tabularnewline
58 & NA & NA & NA \tabularnewline
59 & NA & NA & NA \tabularnewline
60 & NA & NA & NA \tabularnewline
\hline
\end{tabular}
%Source: https://freestatistics.org/blog/index.php?pk=33138&T=1

[TABLE]
[ROW][C]Autocorrelation Function[/C][/ROW]
[ROW][C]Time lag k[/C][C]ACF(k)[/C][C]T-STAT[/C][C]P-value[/C][/ROW]
[ROW][C]1[/C][C]-0.254502[/C][C]-1.7815[/C][C]0.040513[/C][/ROW]
[ROW][C]2[/C][C]0.233254[/C][C]1.6328[/C][C]0.054463[/C][/ROW]
[ROW][C]3[/C][C]-0.272329[/C][C]-1.9063[/C][C]0.031242[/C][/ROW]
[ROW][C]4[/C][C]0.227261[/C][C]1.5908[/C][C]0.05904[/C][/ROW]
[ROW][C]5[/C][C]0.038098[/C][C]0.2667[/C][C]0.395414[/C][/ROW]
[ROW][C]6[/C][C]0.052316[/C][C]0.3662[/C][C]0.357891[/C][/ROW]
[ROW][C]7[/C][C]0.151711[/C][C]1.062[/C][C]0.146726[/C][/ROW]
[ROW][C]8[/C][C]-0.222348[/C][C]-1.5564[/C][C]0.06302[/C][/ROW]
[ROW][C]9[/C][C]0.281075[/C][C]1.9675[/C][C]0.027398[/C][/ROW]
[ROW][C]10[/C][C]-0.106265[/C][C]-0.7439[/C][C]0.230259[/C][/ROW]
[ROW][C]11[/C][C]0.313862[/C][C]2.197[/C][C]0.016389[/C][/ROW]
[ROW][C]12[/C][C]-0.372709[/C][C]-2.609[/C][C]0.006004[/C][/ROW]
[ROW][C]13[/C][C]0.098552[/C][C]0.6899[/C][C]0.246767[/C][/ROW]
[ROW][C]14[/C][C]-0.018835[/C][C]-0.1318[/C][C]0.447823[/C][/ROW]
[ROW][C]15[/C][C]0.106724[/C][C]0.7471[/C][C]0.229296[/C][/ROW]
[ROW][C]16[/C][C]-0.133493[/C][C]-0.9344[/C][C]0.177328[/C][/ROW]
[ROW][C]17[/C][C]-0.096727[/C][C]-0.6771[/C][C]0.250767[/C][/ROW]
[ROW][C]18[/C][C]-0.036274[/C][C]-0.2539[/C][C]0.400311[/C][/ROW]
[ROW][C]19[/C][C]-0.050926[/C][C]-0.3565[/C][C]0.361505[/C][/ROW]
[ROW][C]20[/C][C]0.093334[/C][C]0.6533[/C][C]0.258296[/C][/ROW]
[ROW][C]21[/C][C]0.008076[/C][C]0.0565[/C][C]0.477573[/C][/ROW]
[ROW][C]22[/C][C]-0.027828[/C][C]-0.1948[/C][C]0.423178[/C][/ROW]
[ROW][C]23[/C][C]-0.140751[/C][C]-0.9853[/C][C]0.164668[/C][/ROW]
[ROW][C]24[/C][C]-0.014256[/C][C]-0.0998[/C][C]0.460457[/C][/ROW]
[ROW][C]25[/C][C]0.007228[/C][C]0.0506[/C][C]0.479927[/C][/ROW]
[ROW][C]26[/C][C]-0.102845[/C][C]-0.7199[/C][C]0.2375[/C][/ROW]
[ROW][C]27[/C][C]-0.072686[/C][C]-0.5088[/C][C]0.306588[/C][/ROW]
[ROW][C]28[/C][C]-0.004637[/C][C]-0.0325[/C][C]0.487119[/C][/ROW]
[ROW][C]29[/C][C]-0.015889[/C][C]-0.1112[/C][C]0.455948[/C][/ROW]
[ROW][C]30[/C][C]0.008926[/C][C]0.0625[/C][C]0.475216[/C][/ROW]
[ROW][C]31[/C][C]0.020362[/C][C]0.1425[/C][C]0.443622[/C][/ROW]
[ROW][C]32[/C][C]-0.055275[/C][C]-0.3869[/C][C]0.350244[/C][/ROW]
[ROW][C]33[/C][C]-0.04197[/C][C]-0.2938[/C][C]0.38508[/C][/ROW]
[ROW][C]34[/C][C]-0.035835[/C][C]-0.2508[/C][C]0.401493[/C][/ROW]
[ROW][C]35[/C][C]-0.009495[/C][C]-0.0665[/C][C]0.47364[/C][/ROW]
[ROW][C]36[/C][C]0.029807[/C][C]0.2086[/C][C]0.417794[/C][/ROW]
[ROW][C]37[/C][C]-0.037726[/C][C]-0.2641[/C][C]0.396413[/C][/ROW]
[ROW][C]38[/C][C]-0.026239[/C][C]-0.1837[/C][C]0.427514[/C][/ROW]
[ROW][C]39[/C][C]-0.016929[/C][C]-0.1185[/C][C]0.453078[/C][/ROW]
[ROW][C]40[/C][C]0.001088[/C][C]0.0076[/C][C]0.496977[/C][/ROW]
[ROW][C]41[/C][C]0.002646[/C][C]0.0185[/C][C]0.492648[/C][/ROW]
[ROW][C]42[/C][C]0.022576[/C][C]0.158[/C][C]0.437539[/C][/ROW]
[ROW][C]43[/C][C]-0.011622[/C][C]-0.0814[/C][C]0.467747[/C][/ROW]
[ROW][C]44[/C][C]-0.013371[/C][C]-0.0936[/C][C]0.462905[/C][/ROW]
[ROW][C]45[/C][C]-0.013929[/C][C]-0.0975[/C][C]0.461362[/C][/ROW]
[ROW][C]46[/C][C]-0.002979[/C][C]-0.0209[/C][C]0.491723[/C][/ROW]
[ROW][C]47[/C][C]0.006886[/C][C]0.0482[/C][C]0.480876[/C][/ROW]
[ROW][C]48[/C][C]0.004885[/C][C]0.0342[/C][C]0.486429[/C][/ROW]
[ROW][C]49[/C][C]NA[/C][C]NA[/C][C]NA[/C][/ROW]
[ROW][C]50[/C][C]NA[/C][C]NA[/C][C]NA[/C][/ROW]
[ROW][C]51[/C][C]NA[/C][C]NA[/C][C]NA[/C][/ROW]
[ROW][C]52[/C][C]NA[/C][C]NA[/C][C]NA[/C][/ROW]
[ROW][C]53[/C][C]NA[/C][C]NA[/C][C]NA[/C][/ROW]
[ROW][C]54[/C][C]NA[/C][C]NA[/C][C]NA[/C][/ROW]
[ROW][C]55[/C][C]NA[/C][C]NA[/C][C]NA[/C][/ROW]
[ROW][C]56[/C][C]NA[/C][C]NA[/C][C]NA[/C][/ROW]
[ROW][C]57[/C][C]NA[/C][C]NA[/C][C]NA[/C][/ROW]
[ROW][C]58[/C][C]NA[/C][C]NA[/C][C]NA[/C][/ROW]
[ROW][C]59[/C][C]NA[/C][C]NA[/C][C]NA[/C][/ROW]
[ROW][C]60[/C][C]NA[/C][C]NA[/C][C]NA[/C][/ROW]
[/TABLE]
Source: https://freestatistics.org/blog/index.php?pk=33138&T=1

Globally Unique Identifier (entire table): ba.freestatistics.org/blog/index.php?pk=33138&T=1

As an alternative you can also use a QR Code:  

The GUIDs for individual cells are displayed in the table below:

Autocorrelation Function
Time lag kACF(k)T-STATP-value
1-0.254502-1.78150.040513
20.2332541.63280.054463
3-0.272329-1.90630.031242
40.2272611.59080.05904
50.0380980.26670.395414
60.0523160.36620.357891
70.1517111.0620.146726
8-0.222348-1.55640.06302
90.2810751.96750.027398
10-0.106265-0.74390.230259
110.3138622.1970.016389
12-0.372709-2.6090.006004
130.0985520.68990.246767
14-0.018835-0.13180.447823
150.1067240.74710.229296
16-0.133493-0.93440.177328
17-0.096727-0.67710.250767
18-0.036274-0.25390.400311
19-0.050926-0.35650.361505
200.0933340.65330.258296
210.0080760.05650.477573
22-0.027828-0.19480.423178
23-0.140751-0.98530.164668
24-0.014256-0.09980.460457
250.0072280.05060.479927
26-0.102845-0.71990.2375
27-0.072686-0.50880.306588
28-0.004637-0.03250.487119
29-0.015889-0.11120.455948
300.0089260.06250.475216
310.0203620.14250.443622
32-0.055275-0.38690.350244
33-0.04197-0.29380.38508
34-0.035835-0.25080.401493
35-0.009495-0.06650.47364
360.0298070.20860.417794
37-0.037726-0.26410.396413
38-0.026239-0.18370.427514
39-0.016929-0.11850.453078
400.0010880.00760.496977
410.0026460.01850.492648
420.0225760.1580.437539
43-0.011622-0.08140.467747
44-0.013371-0.09360.462905
45-0.013929-0.09750.461362
46-0.002979-0.02090.491723
470.0068860.04820.480876
480.0048850.03420.486429
49NANANA
50NANANA
51NANANA
52NANANA
53NANANA
54NANANA
55NANANA
56NANANA
57NANANA
58NANANA
59NANANA
60NANANA


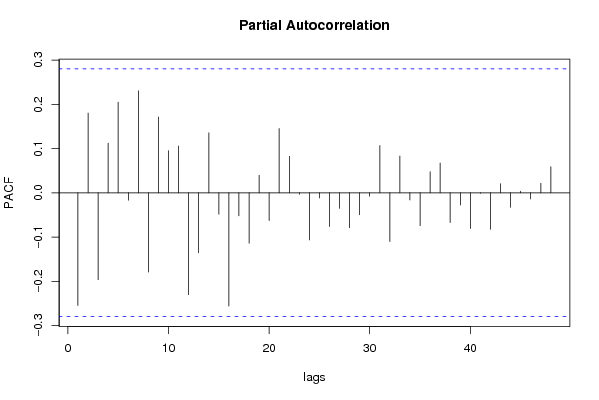
Partial Autocorrelation Function
Time lag kPACF(k)T-STATP-value
1-0.254502-1.78150.040513
20.1801511.26110.10663
3-0.196503-1.37550.087613
40.1122050.78540.217989
50.2048481.43390.078971
6-0.016696-0.11690.45372
70.2304471.61310.05657
8-0.179326-1.25530.107666
90.1711571.19810.118321
100.0953090.66720.253899
110.1056740.73970.2315
12-0.230245-1.61170.056724
13-0.135552-0.94890.173673
140.1355410.94880.173693
15-0.048296-0.33810.368377
16-0.256084-1.79260.039607
17-0.052157-0.36510.358305
18-0.114035-0.79820.21429
190.0396270.27740.391324
20-0.062739-0.43920.331234
210.1451731.01620.15726
220.0826230.57840.282835
23-0.003352-0.02350.490688
24-0.106668-0.74670.229414
25-0.011726-0.08210.467458
26-0.076314-0.53420.297811
27-0.035342-0.24740.402818
28-0.079122-0.55390.291098
29-0.049437-0.34610.36539
30-0.007596-0.05320.478904
310.1068780.74810.228974
32-0.110297-0.77210.221887
330.0829220.58050.282135
34-0.016007-0.1120.455621
35-0.074211-0.51950.302883
360.0478470.33490.369555
370.0671720.47020.320147
38-0.067426-0.4720.319518
39-0.027739-0.19420.423423
40-0.080976-0.56680.286708
41-0.001067-0.00750.497035
42-0.082483-0.57740.283162
430.0205640.14390.443065
44-0.03276-0.22930.409787
450.0037040.02590.48971
46-0.013881-0.09720.461495
470.0213540.14950.440896
480.0589210.41240.340905
49NANANA
50NANANA
51NANANA
52NANANA
53NANANA
54NANANA
55NANANA
56NANANA
57NANANA
58NANANA
59NANANA
60NANANA

\begin{tabular}{lllllllll}
\hline
Partial Autocorrelation Function \tabularnewline
Time lag k & PACF(k) & T-STAT & P-value \tabularnewline
1 & -0.254502 & -1.7815 & 0.040513 \tabularnewline
2 & 0.180151 & 1.2611 & 0.10663 \tabularnewline
3 & -0.196503 & -1.3755 & 0.087613 \tabularnewline
4 & 0.112205 & 0.7854 & 0.217989 \tabularnewline
5 & 0.204848 & 1.4339 & 0.078971 \tabularnewline
6 & -0.016696 & -0.1169 & 0.45372 \tabularnewline
7 & 0.230447 & 1.6131 & 0.05657 \tabularnewline
8 & -0.179326 & -1.2553 & 0.107666 \tabularnewline
9 & 0.171157 & 1.1981 & 0.118321 \tabularnewline
10 & 0.095309 & 0.6672 & 0.253899 \tabularnewline
11 & 0.105674 & 0.7397 & 0.2315 \tabularnewline
12 & -0.230245 & -1.6117 & 0.056724 \tabularnewline
13 & -0.135552 & -0.9489 & 0.173673 \tabularnewline
14 & 0.135541 & 0.9488 & 0.173693 \tabularnewline
15 & -0.048296 & -0.3381 & 0.368377 \tabularnewline
16 & -0.256084 & -1.7926 & 0.039607 \tabularnewline
17 & -0.052157 & -0.3651 & 0.358305 \tabularnewline
18 & -0.114035 & -0.7982 & 0.21429 \tabularnewline
19 & 0.039627 & 0.2774 & 0.391324 \tabularnewline
20 & -0.062739 & -0.4392 & 0.331234 \tabularnewline
21 & 0.145173 & 1.0162 & 0.15726 \tabularnewline
22 & 0.082623 & 0.5784 & 0.282835 \tabularnewline
23 & -0.003352 & -0.0235 & 0.490688 \tabularnewline
24 & -0.106668 & -0.7467 & 0.229414 \tabularnewline
25 & -0.011726 & -0.0821 & 0.467458 \tabularnewline
26 & -0.076314 & -0.5342 & 0.297811 \tabularnewline
27 & -0.035342 & -0.2474 & 0.402818 \tabularnewline
28 & -0.079122 & -0.5539 & 0.291098 \tabularnewline
29 & -0.049437 & -0.3461 & 0.36539 \tabularnewline
30 & -0.007596 & -0.0532 & 0.478904 \tabularnewline
31 & 0.106878 & 0.7481 & 0.228974 \tabularnewline
32 & -0.110297 & -0.7721 & 0.221887 \tabularnewline
33 & 0.082922 & 0.5805 & 0.282135 \tabularnewline
34 & -0.016007 & -0.112 & 0.455621 \tabularnewline
35 & -0.074211 & -0.5195 & 0.302883 \tabularnewline
36 & 0.047847 & 0.3349 & 0.369555 \tabularnewline
37 & 0.067172 & 0.4702 & 0.320147 \tabularnewline
38 & -0.067426 & -0.472 & 0.319518 \tabularnewline
39 & -0.027739 & -0.1942 & 0.423423 \tabularnewline
40 & -0.080976 & -0.5668 & 0.286708 \tabularnewline
41 & -0.001067 & -0.0075 & 0.497035 \tabularnewline
42 & -0.082483 & -0.5774 & 0.283162 \tabularnewline
43 & 0.020564 & 0.1439 & 0.443065 \tabularnewline
44 & -0.03276 & -0.2293 & 0.409787 \tabularnewline
45 & 0.003704 & 0.0259 & 0.48971 \tabularnewline
46 & -0.013881 & -0.0972 & 0.461495 \tabularnewline
47 & 0.021354 & 0.1495 & 0.440896 \tabularnewline
48 & 0.058921 & 0.4124 & 0.340905 \tabularnewline
49 & NA & NA & NA \tabularnewline
50 & NA & NA & NA \tabularnewline
51 & NA & NA & NA \tabularnewline
52 & NA & NA & NA \tabularnewline
53 & NA & NA & NA \tabularnewline
54 & NA & NA & NA \tabularnewline
55 & NA & NA & NA \tabularnewline
56 & NA & NA & NA \tabularnewline
57 & NA & NA & NA \tabularnewline
58 & NA & NA & NA \tabularnewline
59 & NA & NA & NA \tabularnewline
60 & NA & NA & NA \tabularnewline
\hline
\end{tabular}
%Source: https://freestatistics.org/blog/index.php?pk=33138&T=2

[TABLE]
[ROW][C]Partial Autocorrelation Function[/C][/ROW]
[ROW][C]Time lag k[/C][C]PACF(k)[/C][C]T-STAT[/C][C]P-value[/C][/ROW]
[ROW][C]1[/C][C]-0.254502[/C][C]-1.7815[/C][C]0.040513[/C][/ROW]
[ROW][C]2[/C][C]0.180151[/C][C]1.2611[/C][C]0.10663[/C][/ROW]
[ROW][C]3[/C][C]-0.196503[/C][C]-1.3755[/C][C]0.087613[/C][/ROW]
[ROW][C]4[/C][C]0.112205[/C][C]0.7854[/C][C]0.217989[/C][/ROW]
[ROW][C]5[/C][C]0.204848[/C][C]1.4339[/C][C]0.078971[/C][/ROW]
[ROW][C]6[/C][C]-0.016696[/C][C]-0.1169[/C][C]0.45372[/C][/ROW]
[ROW][C]7[/C][C]0.230447[/C][C]1.6131[/C][C]0.05657[/C][/ROW]
[ROW][C]8[/C][C]-0.179326[/C][C]-1.2553[/C][C]0.107666[/C][/ROW]
[ROW][C]9[/C][C]0.171157[/C][C]1.1981[/C][C]0.118321[/C][/ROW]
[ROW][C]10[/C][C]0.095309[/C][C]0.6672[/C][C]0.253899[/C][/ROW]
[ROW][C]11[/C][C]0.105674[/C][C]0.7397[/C][C]0.2315[/C][/ROW]
[ROW][C]12[/C][C]-0.230245[/C][C]-1.6117[/C][C]0.056724[/C][/ROW]
[ROW][C]13[/C][C]-0.135552[/C][C]-0.9489[/C][C]0.173673[/C][/ROW]
[ROW][C]14[/C][C]0.135541[/C][C]0.9488[/C][C]0.173693[/C][/ROW]
[ROW][C]15[/C][C]-0.048296[/C][C]-0.3381[/C][C]0.368377[/C][/ROW]
[ROW][C]16[/C][C]-0.256084[/C][C]-1.7926[/C][C]0.039607[/C][/ROW]
[ROW][C]17[/C][C]-0.052157[/C][C]-0.3651[/C][C]0.358305[/C][/ROW]
[ROW][C]18[/C][C]-0.114035[/C][C]-0.7982[/C][C]0.21429[/C][/ROW]
[ROW][C]19[/C][C]0.039627[/C][C]0.2774[/C][C]0.391324[/C][/ROW]
[ROW][C]20[/C][C]-0.062739[/C][C]-0.4392[/C][C]0.331234[/C][/ROW]
[ROW][C]21[/C][C]0.145173[/C][C]1.0162[/C][C]0.15726[/C][/ROW]
[ROW][C]22[/C][C]0.082623[/C][C]0.5784[/C][C]0.282835[/C][/ROW]
[ROW][C]23[/C][C]-0.003352[/C][C]-0.0235[/C][C]0.490688[/C][/ROW]
[ROW][C]24[/C][C]-0.106668[/C][C]-0.7467[/C][C]0.229414[/C][/ROW]
[ROW][C]25[/C][C]-0.011726[/C][C]-0.0821[/C][C]0.467458[/C][/ROW]
[ROW][C]26[/C][C]-0.076314[/C][C]-0.5342[/C][C]0.297811[/C][/ROW]
[ROW][C]27[/C][C]-0.035342[/C][C]-0.2474[/C][C]0.402818[/C][/ROW]
[ROW][C]28[/C][C]-0.079122[/C][C]-0.5539[/C][C]0.291098[/C][/ROW]
[ROW][C]29[/C][C]-0.049437[/C][C]-0.3461[/C][C]0.36539[/C][/ROW]
[ROW][C]30[/C][C]-0.007596[/C][C]-0.0532[/C][C]0.478904[/C][/ROW]
[ROW][C]31[/C][C]0.106878[/C][C]0.7481[/C][C]0.228974[/C][/ROW]
[ROW][C]32[/C][C]-0.110297[/C][C]-0.7721[/C][C]0.221887[/C][/ROW]
[ROW][C]33[/C][C]0.082922[/C][C]0.5805[/C][C]0.282135[/C][/ROW]
[ROW][C]34[/C][C]-0.016007[/C][C]-0.112[/C][C]0.455621[/C][/ROW]
[ROW][C]35[/C][C]-0.074211[/C][C]-0.5195[/C][C]0.302883[/C][/ROW]
[ROW][C]36[/C][C]0.047847[/C][C]0.3349[/C][C]0.369555[/C][/ROW]
[ROW][C]37[/C][C]0.067172[/C][C]0.4702[/C][C]0.320147[/C][/ROW]
[ROW][C]38[/C][C]-0.067426[/C][C]-0.472[/C][C]0.319518[/C][/ROW]
[ROW][C]39[/C][C]-0.027739[/C][C]-0.1942[/C][C]0.423423[/C][/ROW]
[ROW][C]40[/C][C]-0.080976[/C][C]-0.5668[/C][C]0.286708[/C][/ROW]
[ROW][C]41[/C][C]-0.001067[/C][C]-0.0075[/C][C]0.497035[/C][/ROW]
[ROW][C]42[/C][C]-0.082483[/C][C]-0.5774[/C][C]0.283162[/C][/ROW]
[ROW][C]43[/C][C]0.020564[/C][C]0.1439[/C][C]0.443065[/C][/ROW]
[ROW][C]44[/C][C]-0.03276[/C][C]-0.2293[/C][C]0.409787[/C][/ROW]
[ROW][C]45[/C][C]0.003704[/C][C]0.0259[/C][C]0.48971[/C][/ROW]
[ROW][C]46[/C][C]-0.013881[/C][C]-0.0972[/C][C]0.461495[/C][/ROW]
[ROW][C]47[/C][C]0.021354[/C][C]0.1495[/C][C]0.440896[/C][/ROW]
[ROW][C]48[/C][C]0.058921[/C][C]0.4124[/C][C]0.340905[/C][/ROW]
[ROW][C]49[/C][C]NA[/C][C]NA[/C][C]NA[/C][/ROW]
[ROW][C]50[/C][C]NA[/C][C]NA[/C][C]NA[/C][/ROW]
[ROW][C]51[/C][C]NA[/C][C]NA[/C][C]NA[/C][/ROW]
[ROW][C]52[/C][C]NA[/C][C]NA[/C][C]NA[/C][/ROW]
[ROW][C]53[/C][C]NA[/C][C]NA[/C][C]NA[/C][/ROW]
[ROW][C]54[/C][C]NA[/C][C]NA[/C][C]NA[/C][/ROW]
[ROW][C]55[/C][C]NA[/C][C]NA[/C][C]NA[/C][/ROW]
[ROW][C]56[/C][C]NA[/C][C]NA[/C][C]NA[/C][/ROW]
[ROW][C]57[/C][C]NA[/C][C]NA[/C][C]NA[/C][/ROW]
[ROW][C]58[/C][C]NA[/C][C]NA[/C][C]NA[/C][/ROW]
[ROW][C]59[/C][C]NA[/C][C]NA[/C][C]NA[/C][/ROW]
[ROW][C]60[/C][C]NA[/C][C]NA[/C][C]NA[/C][/ROW]
[/TABLE]
Source: https://freestatistics.org/blog/index.php?pk=33138&T=2

Globally Unique Identifier (entire table): ba.freestatistics.org/blog/index.php?pk=33138&T=2

As an alternative you can also use a QR Code:  

The GUIDs for individual cells are displayed in the table below:

Partial Autocorrelation Function
Time lag kPACF(k)T-STATP-value
1-0.254502-1.78150.040513
20.1801511.26110.10663
3-0.196503-1.37550.087613
40.1122050.78540.217989
50.2048481.43390.078971
6-0.016696-0.11690.45372
70.2304471.61310.05657
8-0.179326-1.25530.107666
90.1711571.19810.118321
100.0953090.66720.253899
110.1056740.73970.2315
12-0.230245-1.61170.056724
13-0.135552-0.94890.173673
140.1355410.94880.173693
15-0.048296-0.33810.368377
16-0.256084-1.79260.039607
17-0.052157-0.36510.358305
18-0.114035-0.79820.21429
190.0396270.27740.391324
20-0.062739-0.43920.331234
210.1451731.01620.15726
220.0826230.57840.282835
23-0.003352-0.02350.490688
24-0.106668-0.74670.229414
25-0.011726-0.08210.467458
26-0.076314-0.53420.297811
27-0.035342-0.24740.402818
28-0.079122-0.55390.291098
29-0.049437-0.34610.36539
30-0.007596-0.05320.478904
310.1068780.74810.228974
32-0.110297-0.77210.221887
330.0829220.58050.282135
34-0.016007-0.1120.455621
35-0.074211-0.51950.302883
360.0478470.33490.369555
370.0671720.47020.320147
38-0.067426-0.4720.319518
39-0.027739-0.19420.423423
40-0.080976-0.56680.286708
41-0.001067-0.00750.497035
42-0.082483-0.57740.283162
430.0205640.14390.443065
44-0.03276-0.22930.409787
450.0037040.02590.48971
46-0.013881-0.09720.461495
470.0213540.14950.440896
480.0589210.41240.340905
49NANANA
50NANANA
51NANANA
52NANANA
53NANANA
54NANANA
55NANANA
56NANANA
57NANANA
58NANANA
59NANANA
60NANANA


Parameters (Session):
par1 = 60 ; par2 = 1 ; par3 = 1 ; par4 = 1 ; par5 = 12 ;
Parameters (R input):
par1 = 60 ; par2 = 1 ; par3 = 1 ; par4 = 1 ; par5 = 12 ;
R code (references can be found in the software module):
if (par1 == 'Default') {
par1 = 10*log10(length(x))
} else {
par1 <- as.numeric(par1)
}
par2 <- as.numeric(par2)
par3 <- as.numeric(par3)
par4 <- as.numeric(par4)
par5 <- as.numeric(par5)
if (par2 == 0) {
x <- log(x)
} else {
x <- (x ^ par2 - 1) / par2
}
if (par3 > 0) x <- diff(x,lag=1,difference=par3)
if (par4 > 0) x <- diff(x,lag=par5,difference=par4)
bitmap(file='pic1.png')
racf <- acf(x,par1,main='Autocorrelation',xlab='lags',ylab='ACF')
dev.off()
bitmap(file='pic2.png')
rpacf <- pacf(x,par1,main='Partial Autocorrelation',xlab='lags',ylab='PACF')
dev.off()
(myacf <- c(racf$acf))
(mypacf <- c(rpacf$acf))
lengthx <- length(x)
sqrtn <- sqrt(lengthx)
load(file='createtable')
a<-table.start()
a<-table.row.start(a)
a<-table.element(a,'Autocorrelation Function',4,TRUE)
a<-table.row.end(a)
a<-table.row.start(a)
a<-table.element(a,'Time lag k',header=TRUE)
a<-table.element(a,hyperlink('basics.htm','ACF(k)','click here for more information about the Autocorrelation Function'),header=TRUE)
a<-table.element(a,'T-STAT',header=TRUE)
a<-table.element(a,'P-value',header=TRUE)
a<-table.row.end(a)
for (i in 2:(par1+1)) {
a<-table.row.start(a)
a<-table.element(a,i-1,header=TRUE)
a<-table.element(a,round(myacf[i],6))
mytstat <- myacf[i]*sqrtn
a<-table.element(a,round(mytstat,4))
a<-table.element(a,round(1-pt(abs(mytstat),lengthx),6))
a<-table.row.end(a)
}
a<-table.end(a)
table.save(a,file='mytable.tab')
a<-table.start()
a<-table.row.start(a)
a<-table.element(a,'Partial Autocorrelation Function',4,TRUE)
a<-table.row.end(a)
a<-table.row.start(a)
a<-table.element(a,'Time lag k',header=TRUE)
a<-table.element(a,hyperlink('basics.htm','PACF(k)','click here for more information about the Partial Autocorrelation Function'),header=TRUE)
a<-table.element(a,'T-STAT',header=TRUE)
a<-table.element(a,'P-value',header=TRUE)
a<-table.row.end(a)
for (i in 1:par1) {
a<-table.row.start(a)
a<-table.element(a,i,header=TRUE)
a<-table.element(a,round(mypacf[i],6))
mytstat <- mypacf[i]*sqrtn
a<-table.element(a,round(mytstat,4))
a<-table.element(a,round(1-pt(abs(mytstat),lengthx),6))
a<-table.row.end(a)
}
a<-table.end(a)
table.save(a,file='mytable1.tab')