Free Statistics

of Irreproducible Research!

Author's title

Author*Unverified author*
R Software Modulerwasp_autocorrelation.wasp
Title produced by software(Partial) Autocorrelation Function
Date of computationSat, 13 Dec 2008 03:21:28 -0700
Cite this page as followsStatistical Computations at FreeStatistics.org, Office for Research Development and Education, URL https://freestatistics.org/blog/index.php?v=date/2008/Dec/13/t1229163746p1glaay6cbpye9v.htm/, Retrieved Fri, 17 May 2024 07:01:58 +0000
Statistical Computations at FreeStatistics.org, Office for Research Development and Education, URL https://freestatistics.org/blog/index.php?pk=32941, Retrieved Fri, 17 May 2024 07:01:58 +0000
QR Codes:

Original text written by user:
IsPrivate?No (this computation is public)
User-defined keywords
Estimated Impact181
Family? (F = Feedback message, R = changed R code, M = changed R Module, P = changed Parameters, D = changed Data)
-     [Univariate Data Series] [data set] [2008-12-01 19:54:57] [b98453cac15ba1066b407e146608df68]
- RMPD    [(Partial) Autocorrelation Function] [Duurzame consumpt...] [2008-12-13 10:21:28] [d41d8cd98f00b204e9800998ecf8427e] [Current]
Feedback Forum

Post a new message
Dataseries X:
98.1
101.1
111.1
93.3
100
108
70.4
75.4
105.5
112.3
102.5
93.5
86.7
95.2
103.8
97
95.5
101
67.5
64
106.7
100.6
101.2
93.1
84.2
85.8
91.8
92.4
80.3
79.7
62.5
57.1
100.8
100.7
86.2
83.2
71.7
77.5
89.8
80.3
78.7
93.8
57.6
60.6
91
85.3
77.4
77.3
68.3
69.9
81.7
75.1
69.9
84
54.3
60
89.9
77
85.3
77.6
69.2
75.5
85.7
72.2
79.9
85.3
52.2
61.2
82.4
85.4
78.2
70.2
70.2
69.3
77.5
66.1
69
79.2
56.2
63.3
77.8
92
78.1
65.1
71.1
70.9
72
81.9
70.6
72.5
65.1
54.9
80


Summary of computational transaction
Raw Inputview raw input (R code)
Raw Outputview raw output of R engine
Computing time3 seconds
R Server'Sir Ronald Aylmer Fisher' @ 193.190.124.24

\begin{tabular}{lllllllll}
\hline
Summary of computational transaction \tabularnewline
Raw Input & view raw input (R code)  \tabularnewline
Raw Output & view raw output of R engine  \tabularnewline
Computing time & 3 seconds \tabularnewline
R Server & 'Sir Ronald Aylmer Fisher' @ 193.190.124.24 \tabularnewline
\hline
\end{tabular}
%Source: https://freestatistics.org/blog/index.php?pk=32941&T=0

[TABLE]
[ROW][C]Summary of computational transaction[/C][/ROW]
[ROW][C]Raw Input[/C][C]view raw input (R code) [/C][/ROW]
[ROW][C]Raw Output[/C][C]view raw output of R engine [/C][/ROW]
[ROW][C]Computing time[/C][C]3 seconds[/C][/ROW]
[ROW][C]R Server[/C][C]'Sir Ronald Aylmer Fisher' @ 193.190.124.24[/C][/ROW]
[/TABLE]
Source: https://freestatistics.org/blog/index.php?pk=32941&T=0

Globally Unique Identifier (entire table): ba.freestatistics.org/blog/index.php?pk=32941&T=0

As an alternative you can also use a QR Code:  

The GUIDs for individual cells are displayed in the table below:

Summary of computational transaction
Raw Inputview raw input (R code)
Raw Outputview raw output of R engine
Computing time3 seconds
R Server'Sir Ronald Aylmer Fisher' @ 193.190.124.24


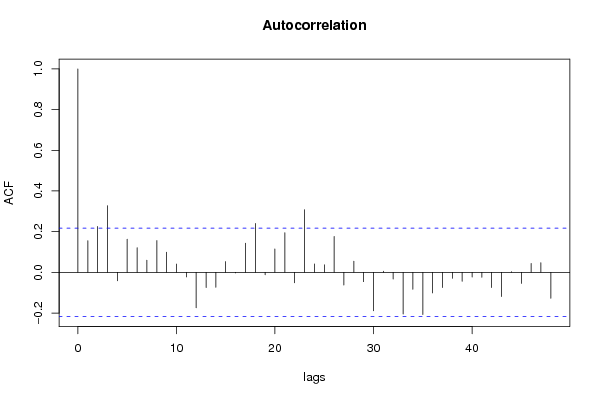
Autocorrelation Function
Time lag kACF(k)T-STATP-value
10.1550931.39580.083289
20.2259632.03370.022629
30.3276952.94930.002081
4-0.041102-0.36990.356206
50.1629111.46620.073233
60.1215021.09350.138704
70.0598790.53890.295714
80.1561171.40510.081914
90.0985360.88680.188899
100.0406190.36560.357817
11-0.022497-0.20250.420028
12-0.174494-1.57040.060105
13-0.074689-0.67220.251683
14-0.073766-0.66390.254321
150.0527520.47480.318114
16-0.002726-0.02450.490244
170.1429531.28660.100953
180.2407032.16630.016613
19-0.012338-0.1110.455928
200.1147321.03260.152435
210.1948651.75380.041625
22-0.051283-0.46150.322821
230.3081042.77290.003446
240.0412560.37130.355692
250.0369450.33250.370183
260.1766481.58980.057884
27-0.061924-0.55730.289423
280.0551990.49680.310342
29-0.04563-0.41070.341198
30-0.188808-1.69930.046553
310.005560.050.480107
32-0.032385-0.29150.38572
33-0.204663-1.8420.03457
34-0.08339-0.75050.227561
35-0.207301-1.86570.032851
36-0.10107-0.90960.182859
37-0.074571-0.67110.25202
38-0.029177-0.26260.396765
39-0.044208-0.39790.345884
40-0.022962-0.20670.418399
41-0.023939-0.21540.414979
42-0.074234-0.66810.252984
43-0.118857-1.06970.143962
440.0029570.02660.489418
45-0.054441-0.490.312742
460.0434630.39120.34835
470.047650.42890.334584
48-0.127746-1.14970.126822

\begin{tabular}{lllllllll}
\hline
Autocorrelation Function \tabularnewline
Time lag k & ACF(k) & T-STAT & P-value \tabularnewline
1 & 0.155093 & 1.3958 & 0.083289 \tabularnewline
2 & 0.225963 & 2.0337 & 0.022629 \tabularnewline
3 & 0.327695 & 2.9493 & 0.002081 \tabularnewline
4 & -0.041102 & -0.3699 & 0.356206 \tabularnewline
5 & 0.162911 & 1.4662 & 0.073233 \tabularnewline
6 & 0.121502 & 1.0935 & 0.138704 \tabularnewline
7 & 0.059879 & 0.5389 & 0.295714 \tabularnewline
8 & 0.156117 & 1.4051 & 0.081914 \tabularnewline
9 & 0.098536 & 0.8868 & 0.188899 \tabularnewline
10 & 0.040619 & 0.3656 & 0.357817 \tabularnewline
11 & -0.022497 & -0.2025 & 0.420028 \tabularnewline
12 & -0.174494 & -1.5704 & 0.060105 \tabularnewline
13 & -0.074689 & -0.6722 & 0.251683 \tabularnewline
14 & -0.073766 & -0.6639 & 0.254321 \tabularnewline
15 & 0.052752 & 0.4748 & 0.318114 \tabularnewline
16 & -0.002726 & -0.0245 & 0.490244 \tabularnewline
17 & 0.142953 & 1.2866 & 0.100953 \tabularnewline
18 & 0.240703 & 2.1663 & 0.016613 \tabularnewline
19 & -0.012338 & -0.111 & 0.455928 \tabularnewline
20 & 0.114732 & 1.0326 & 0.152435 \tabularnewline
21 & 0.194865 & 1.7538 & 0.041625 \tabularnewline
22 & -0.051283 & -0.4615 & 0.322821 \tabularnewline
23 & 0.308104 & 2.7729 & 0.003446 \tabularnewline
24 & 0.041256 & 0.3713 & 0.355692 \tabularnewline
25 & 0.036945 & 0.3325 & 0.370183 \tabularnewline
26 & 0.176648 & 1.5898 & 0.057884 \tabularnewline
27 & -0.061924 & -0.5573 & 0.289423 \tabularnewline
28 & 0.055199 & 0.4968 & 0.310342 \tabularnewline
29 & -0.04563 & -0.4107 & 0.341198 \tabularnewline
30 & -0.188808 & -1.6993 & 0.046553 \tabularnewline
31 & 0.00556 & 0.05 & 0.480107 \tabularnewline
32 & -0.032385 & -0.2915 & 0.38572 \tabularnewline
33 & -0.204663 & -1.842 & 0.03457 \tabularnewline
34 & -0.08339 & -0.7505 & 0.227561 \tabularnewline
35 & -0.207301 & -1.8657 & 0.032851 \tabularnewline
36 & -0.10107 & -0.9096 & 0.182859 \tabularnewline
37 & -0.074571 & -0.6711 & 0.25202 \tabularnewline
38 & -0.029177 & -0.2626 & 0.396765 \tabularnewline
39 & -0.044208 & -0.3979 & 0.345884 \tabularnewline
40 & -0.022962 & -0.2067 & 0.418399 \tabularnewline
41 & -0.023939 & -0.2154 & 0.414979 \tabularnewline
42 & -0.074234 & -0.6681 & 0.252984 \tabularnewline
43 & -0.118857 & -1.0697 & 0.143962 \tabularnewline
44 & 0.002957 & 0.0266 & 0.489418 \tabularnewline
45 & -0.054441 & -0.49 & 0.312742 \tabularnewline
46 & 0.043463 & 0.3912 & 0.34835 \tabularnewline
47 & 0.04765 & 0.4289 & 0.334584 \tabularnewline
48 & -0.127746 & -1.1497 & 0.126822 \tabularnewline
\hline
\end{tabular}
%Source: https://freestatistics.org/blog/index.php?pk=32941&T=1

[TABLE]
[ROW][C]Autocorrelation Function[/C][/ROW]
[ROW][C]Time lag k[/C][C]ACF(k)[/C][C]T-STAT[/C][C]P-value[/C][/ROW]
[ROW][C]1[/C][C]0.155093[/C][C]1.3958[/C][C]0.083289[/C][/ROW]
[ROW][C]2[/C][C]0.225963[/C][C]2.0337[/C][C]0.022629[/C][/ROW]
[ROW][C]3[/C][C]0.327695[/C][C]2.9493[/C][C]0.002081[/C][/ROW]
[ROW][C]4[/C][C]-0.041102[/C][C]-0.3699[/C][C]0.356206[/C][/ROW]
[ROW][C]5[/C][C]0.162911[/C][C]1.4662[/C][C]0.073233[/C][/ROW]
[ROW][C]6[/C][C]0.121502[/C][C]1.0935[/C][C]0.138704[/C][/ROW]
[ROW][C]7[/C][C]0.059879[/C][C]0.5389[/C][C]0.295714[/C][/ROW]
[ROW][C]8[/C][C]0.156117[/C][C]1.4051[/C][C]0.081914[/C][/ROW]
[ROW][C]9[/C][C]0.098536[/C][C]0.8868[/C][C]0.188899[/C][/ROW]
[ROW][C]10[/C][C]0.040619[/C][C]0.3656[/C][C]0.357817[/C][/ROW]
[ROW][C]11[/C][C]-0.022497[/C][C]-0.2025[/C][C]0.420028[/C][/ROW]
[ROW][C]12[/C][C]-0.174494[/C][C]-1.5704[/C][C]0.060105[/C][/ROW]
[ROW][C]13[/C][C]-0.074689[/C][C]-0.6722[/C][C]0.251683[/C][/ROW]
[ROW][C]14[/C][C]-0.073766[/C][C]-0.6639[/C][C]0.254321[/C][/ROW]
[ROW][C]15[/C][C]0.052752[/C][C]0.4748[/C][C]0.318114[/C][/ROW]
[ROW][C]16[/C][C]-0.002726[/C][C]-0.0245[/C][C]0.490244[/C][/ROW]
[ROW][C]17[/C][C]0.142953[/C][C]1.2866[/C][C]0.100953[/C][/ROW]
[ROW][C]18[/C][C]0.240703[/C][C]2.1663[/C][C]0.016613[/C][/ROW]
[ROW][C]19[/C][C]-0.012338[/C][C]-0.111[/C][C]0.455928[/C][/ROW]
[ROW][C]20[/C][C]0.114732[/C][C]1.0326[/C][C]0.152435[/C][/ROW]
[ROW][C]21[/C][C]0.194865[/C][C]1.7538[/C][C]0.041625[/C][/ROW]
[ROW][C]22[/C][C]-0.051283[/C][C]-0.4615[/C][C]0.322821[/C][/ROW]
[ROW][C]23[/C][C]0.308104[/C][C]2.7729[/C][C]0.003446[/C][/ROW]
[ROW][C]24[/C][C]0.041256[/C][C]0.3713[/C][C]0.355692[/C][/ROW]
[ROW][C]25[/C][C]0.036945[/C][C]0.3325[/C][C]0.370183[/C][/ROW]
[ROW][C]26[/C][C]0.176648[/C][C]1.5898[/C][C]0.057884[/C][/ROW]
[ROW][C]27[/C][C]-0.061924[/C][C]-0.5573[/C][C]0.289423[/C][/ROW]
[ROW][C]28[/C][C]0.055199[/C][C]0.4968[/C][C]0.310342[/C][/ROW]
[ROW][C]29[/C][C]-0.04563[/C][C]-0.4107[/C][C]0.341198[/C][/ROW]
[ROW][C]30[/C][C]-0.188808[/C][C]-1.6993[/C][C]0.046553[/C][/ROW]
[ROW][C]31[/C][C]0.00556[/C][C]0.05[/C][C]0.480107[/C][/ROW]
[ROW][C]32[/C][C]-0.032385[/C][C]-0.2915[/C][C]0.38572[/C][/ROW]
[ROW][C]33[/C][C]-0.204663[/C][C]-1.842[/C][C]0.03457[/C][/ROW]
[ROW][C]34[/C][C]-0.08339[/C][C]-0.7505[/C][C]0.227561[/C][/ROW]
[ROW][C]35[/C][C]-0.207301[/C][C]-1.8657[/C][C]0.032851[/C][/ROW]
[ROW][C]36[/C][C]-0.10107[/C][C]-0.9096[/C][C]0.182859[/C][/ROW]
[ROW][C]37[/C][C]-0.074571[/C][C]-0.6711[/C][C]0.25202[/C][/ROW]
[ROW][C]38[/C][C]-0.029177[/C][C]-0.2626[/C][C]0.396765[/C][/ROW]
[ROW][C]39[/C][C]-0.044208[/C][C]-0.3979[/C][C]0.345884[/C][/ROW]
[ROW][C]40[/C][C]-0.022962[/C][C]-0.2067[/C][C]0.418399[/C][/ROW]
[ROW][C]41[/C][C]-0.023939[/C][C]-0.2154[/C][C]0.414979[/C][/ROW]
[ROW][C]42[/C][C]-0.074234[/C][C]-0.6681[/C][C]0.252984[/C][/ROW]
[ROW][C]43[/C][C]-0.118857[/C][C]-1.0697[/C][C]0.143962[/C][/ROW]
[ROW][C]44[/C][C]0.002957[/C][C]0.0266[/C][C]0.489418[/C][/ROW]
[ROW][C]45[/C][C]-0.054441[/C][C]-0.49[/C][C]0.312742[/C][/ROW]
[ROW][C]46[/C][C]0.043463[/C][C]0.3912[/C][C]0.34835[/C][/ROW]
[ROW][C]47[/C][C]0.04765[/C][C]0.4289[/C][C]0.334584[/C][/ROW]
[ROW][C]48[/C][C]-0.127746[/C][C]-1.1497[/C][C]0.126822[/C][/ROW]
[/TABLE]
Source: https://freestatistics.org/blog/index.php?pk=32941&T=1

Globally Unique Identifier (entire table): ba.freestatistics.org/blog/index.php?pk=32941&T=1

As an alternative you can also use a QR Code:  

The GUIDs for individual cells are displayed in the table below:

Autocorrelation Function
Time lag kACF(k)T-STATP-value
10.1550931.39580.083289
20.2259632.03370.022629
30.3276952.94930.002081
4-0.041102-0.36990.356206
50.1629111.46620.073233
60.1215021.09350.138704
70.0598790.53890.295714
80.1561171.40510.081914
90.0985360.88680.188899
100.0406190.36560.357817
11-0.022497-0.20250.420028
12-0.174494-1.57040.060105
13-0.074689-0.67220.251683
14-0.073766-0.66390.254321
150.0527520.47480.318114
16-0.002726-0.02450.490244
170.1429531.28660.100953
180.2407032.16630.016613
19-0.012338-0.1110.455928
200.1147321.03260.152435
210.1948651.75380.041625
22-0.051283-0.46150.322821
230.3081042.77290.003446
240.0412560.37130.355692
250.0369450.33250.370183
260.1766481.58980.057884
27-0.061924-0.55730.289423
280.0551990.49680.310342
29-0.04563-0.41070.341198
30-0.188808-1.69930.046553
310.005560.050.480107
32-0.032385-0.29150.38572
33-0.204663-1.8420.03457
34-0.08339-0.75050.227561
35-0.207301-1.86570.032851
36-0.10107-0.90960.182859
37-0.074571-0.67110.25202
38-0.029177-0.26260.396765
39-0.044208-0.39790.345884
40-0.022962-0.20670.418399
41-0.023939-0.21540.414979
42-0.074234-0.66810.252984
43-0.118857-1.06970.143962
440.0029570.02660.489418
45-0.054441-0.490.312742
460.0434630.39120.34835
470.047650.42890.334584
48-0.127746-1.14970.126822


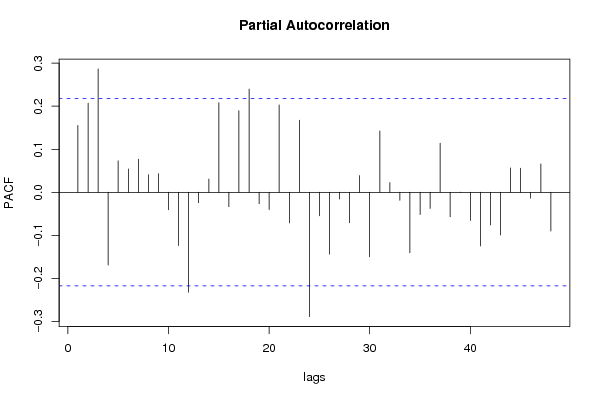
Partial Autocorrelation Function
Time lag kPACF(k)T-STATP-value
10.1550931.39580.083289
20.2068861.8620.033117
30.2866842.58020.00584
4-0.16937-1.52430.06566
50.0730180.65720.256469
60.0539350.48540.314348
70.0768840.6920.245472
80.0406610.3660.357677
90.0430490.38740.349723
10-0.040651-0.36590.357713
11-0.12377-1.11390.134302
12-0.23226-2.09030.019862
13-0.024339-0.21910.41358
140.0305910.27530.391888
150.2081891.87370.032289
16-0.033439-0.3010.38211
170.1894041.70460.046047
180.2398712.15880.016911
19-0.026967-0.24270.404424
20-0.040076-0.36070.359637
210.2030271.82720.035673
22-0.071206-0.64090.261714
230.1676861.50920.067572
24-0.289206-2.60290.005496
25-0.054712-0.49240.311882
26-0.143966-1.29570.099381
27-0.01562-0.14060.444274
28-0.071004-0.6390.262301
290.0387350.34860.36414
30-0.149909-1.34920.090519
310.1425081.28260.10165
320.0224120.20170.420327
33-0.018828-0.16950.43293
34-0.140844-1.26760.104288
35-0.051915-0.46720.320794
36-0.037522-0.33770.368232
370.1142251.0280.153498
38-0.05682-0.51140.305239
39-0.000382-0.00340.498632
40-0.065732-0.59160.277886
41-0.124753-1.12280.132424
42-0.075845-0.68260.248401
43-0.099593-0.89630.186363
440.0564230.50780.306484
450.055710.50140.308728
46-0.013712-0.12340.451045
470.0658430.59260.277556
48-0.090097-0.81090.209907

\begin{tabular}{lllllllll}
\hline
Partial Autocorrelation Function \tabularnewline
Time lag k & PACF(k) & T-STAT & P-value \tabularnewline
1 & 0.155093 & 1.3958 & 0.083289 \tabularnewline
2 & 0.206886 & 1.862 & 0.033117 \tabularnewline
3 & 0.286684 & 2.5802 & 0.00584 \tabularnewline
4 & -0.16937 & -1.5243 & 0.06566 \tabularnewline
5 & 0.073018 & 0.6572 & 0.256469 \tabularnewline
6 & 0.053935 & 0.4854 & 0.314348 \tabularnewline
7 & 0.076884 & 0.692 & 0.245472 \tabularnewline
8 & 0.040661 & 0.366 & 0.357677 \tabularnewline
9 & 0.043049 & 0.3874 & 0.349723 \tabularnewline
10 & -0.040651 & -0.3659 & 0.357713 \tabularnewline
11 & -0.12377 & -1.1139 & 0.134302 \tabularnewline
12 & -0.23226 & -2.0903 & 0.019862 \tabularnewline
13 & -0.024339 & -0.2191 & 0.41358 \tabularnewline
14 & 0.030591 & 0.2753 & 0.391888 \tabularnewline
15 & 0.208189 & 1.8737 & 0.032289 \tabularnewline
16 & -0.033439 & -0.301 & 0.38211 \tabularnewline
17 & 0.189404 & 1.7046 & 0.046047 \tabularnewline
18 & 0.239871 & 2.1588 & 0.016911 \tabularnewline
19 & -0.026967 & -0.2427 & 0.404424 \tabularnewline
20 & -0.040076 & -0.3607 & 0.359637 \tabularnewline
21 & 0.203027 & 1.8272 & 0.035673 \tabularnewline
22 & -0.071206 & -0.6409 & 0.261714 \tabularnewline
23 & 0.167686 & 1.5092 & 0.067572 \tabularnewline
24 & -0.289206 & -2.6029 & 0.005496 \tabularnewline
25 & -0.054712 & -0.4924 & 0.311882 \tabularnewline
26 & -0.143966 & -1.2957 & 0.099381 \tabularnewline
27 & -0.01562 & -0.1406 & 0.444274 \tabularnewline
28 & -0.071004 & -0.639 & 0.262301 \tabularnewline
29 & 0.038735 & 0.3486 & 0.36414 \tabularnewline
30 & -0.149909 & -1.3492 & 0.090519 \tabularnewline
31 & 0.142508 & 1.2826 & 0.10165 \tabularnewline
32 & 0.022412 & 0.2017 & 0.420327 \tabularnewline
33 & -0.018828 & -0.1695 & 0.43293 \tabularnewline
34 & -0.140844 & -1.2676 & 0.104288 \tabularnewline
35 & -0.051915 & -0.4672 & 0.320794 \tabularnewline
36 & -0.037522 & -0.3377 & 0.368232 \tabularnewline
37 & 0.114225 & 1.028 & 0.153498 \tabularnewline
38 & -0.05682 & -0.5114 & 0.305239 \tabularnewline
39 & -0.000382 & -0.0034 & 0.498632 \tabularnewline
40 & -0.065732 & -0.5916 & 0.277886 \tabularnewline
41 & -0.124753 & -1.1228 & 0.132424 \tabularnewline
42 & -0.075845 & -0.6826 & 0.248401 \tabularnewline
43 & -0.099593 & -0.8963 & 0.186363 \tabularnewline
44 & 0.056423 & 0.5078 & 0.306484 \tabularnewline
45 & 0.05571 & 0.5014 & 0.308728 \tabularnewline
46 & -0.013712 & -0.1234 & 0.451045 \tabularnewline
47 & 0.065843 & 0.5926 & 0.277556 \tabularnewline
48 & -0.090097 & -0.8109 & 0.209907 \tabularnewline
\hline
\end{tabular}
%Source: https://freestatistics.org/blog/index.php?pk=32941&T=2

[TABLE]
[ROW][C]Partial Autocorrelation Function[/C][/ROW]
[ROW][C]Time lag k[/C][C]PACF(k)[/C][C]T-STAT[/C][C]P-value[/C][/ROW]
[ROW][C]1[/C][C]0.155093[/C][C]1.3958[/C][C]0.083289[/C][/ROW]
[ROW][C]2[/C][C]0.206886[/C][C]1.862[/C][C]0.033117[/C][/ROW]
[ROW][C]3[/C][C]0.286684[/C][C]2.5802[/C][C]0.00584[/C][/ROW]
[ROW][C]4[/C][C]-0.16937[/C][C]-1.5243[/C][C]0.06566[/C][/ROW]
[ROW][C]5[/C][C]0.073018[/C][C]0.6572[/C][C]0.256469[/C][/ROW]
[ROW][C]6[/C][C]0.053935[/C][C]0.4854[/C][C]0.314348[/C][/ROW]
[ROW][C]7[/C][C]0.076884[/C][C]0.692[/C][C]0.245472[/C][/ROW]
[ROW][C]8[/C][C]0.040661[/C][C]0.366[/C][C]0.357677[/C][/ROW]
[ROW][C]9[/C][C]0.043049[/C][C]0.3874[/C][C]0.349723[/C][/ROW]
[ROW][C]10[/C][C]-0.040651[/C][C]-0.3659[/C][C]0.357713[/C][/ROW]
[ROW][C]11[/C][C]-0.12377[/C][C]-1.1139[/C][C]0.134302[/C][/ROW]
[ROW][C]12[/C][C]-0.23226[/C][C]-2.0903[/C][C]0.019862[/C][/ROW]
[ROW][C]13[/C][C]-0.024339[/C][C]-0.2191[/C][C]0.41358[/C][/ROW]
[ROW][C]14[/C][C]0.030591[/C][C]0.2753[/C][C]0.391888[/C][/ROW]
[ROW][C]15[/C][C]0.208189[/C][C]1.8737[/C][C]0.032289[/C][/ROW]
[ROW][C]16[/C][C]-0.033439[/C][C]-0.301[/C][C]0.38211[/C][/ROW]
[ROW][C]17[/C][C]0.189404[/C][C]1.7046[/C][C]0.046047[/C][/ROW]
[ROW][C]18[/C][C]0.239871[/C][C]2.1588[/C][C]0.016911[/C][/ROW]
[ROW][C]19[/C][C]-0.026967[/C][C]-0.2427[/C][C]0.404424[/C][/ROW]
[ROW][C]20[/C][C]-0.040076[/C][C]-0.3607[/C][C]0.359637[/C][/ROW]
[ROW][C]21[/C][C]0.203027[/C][C]1.8272[/C][C]0.035673[/C][/ROW]
[ROW][C]22[/C][C]-0.071206[/C][C]-0.6409[/C][C]0.261714[/C][/ROW]
[ROW][C]23[/C][C]0.167686[/C][C]1.5092[/C][C]0.067572[/C][/ROW]
[ROW][C]24[/C][C]-0.289206[/C][C]-2.6029[/C][C]0.005496[/C][/ROW]
[ROW][C]25[/C][C]-0.054712[/C][C]-0.4924[/C][C]0.311882[/C][/ROW]
[ROW][C]26[/C][C]-0.143966[/C][C]-1.2957[/C][C]0.099381[/C][/ROW]
[ROW][C]27[/C][C]-0.01562[/C][C]-0.1406[/C][C]0.444274[/C][/ROW]
[ROW][C]28[/C][C]-0.071004[/C][C]-0.639[/C][C]0.262301[/C][/ROW]
[ROW][C]29[/C][C]0.038735[/C][C]0.3486[/C][C]0.36414[/C][/ROW]
[ROW][C]30[/C][C]-0.149909[/C][C]-1.3492[/C][C]0.090519[/C][/ROW]
[ROW][C]31[/C][C]0.142508[/C][C]1.2826[/C][C]0.10165[/C][/ROW]
[ROW][C]32[/C][C]0.022412[/C][C]0.2017[/C][C]0.420327[/C][/ROW]
[ROW][C]33[/C][C]-0.018828[/C][C]-0.1695[/C][C]0.43293[/C][/ROW]
[ROW][C]34[/C][C]-0.140844[/C][C]-1.2676[/C][C]0.104288[/C][/ROW]
[ROW][C]35[/C][C]-0.051915[/C][C]-0.4672[/C][C]0.320794[/C][/ROW]
[ROW][C]36[/C][C]-0.037522[/C][C]-0.3377[/C][C]0.368232[/C][/ROW]
[ROW][C]37[/C][C]0.114225[/C][C]1.028[/C][C]0.153498[/C][/ROW]
[ROW][C]38[/C][C]-0.05682[/C][C]-0.5114[/C][C]0.305239[/C][/ROW]
[ROW][C]39[/C][C]-0.000382[/C][C]-0.0034[/C][C]0.498632[/C][/ROW]
[ROW][C]40[/C][C]-0.065732[/C][C]-0.5916[/C][C]0.277886[/C][/ROW]
[ROW][C]41[/C][C]-0.124753[/C][C]-1.1228[/C][C]0.132424[/C][/ROW]
[ROW][C]42[/C][C]-0.075845[/C][C]-0.6826[/C][C]0.248401[/C][/ROW]
[ROW][C]43[/C][C]-0.099593[/C][C]-0.8963[/C][C]0.186363[/C][/ROW]
[ROW][C]44[/C][C]0.056423[/C][C]0.5078[/C][C]0.306484[/C][/ROW]
[ROW][C]45[/C][C]0.05571[/C][C]0.5014[/C][C]0.308728[/C][/ROW]
[ROW][C]46[/C][C]-0.013712[/C][C]-0.1234[/C][C]0.451045[/C][/ROW]
[ROW][C]47[/C][C]0.065843[/C][C]0.5926[/C][C]0.277556[/C][/ROW]
[ROW][C]48[/C][C]-0.090097[/C][C]-0.8109[/C][C]0.209907[/C][/ROW]
[/TABLE]
Source: https://freestatistics.org/blog/index.php?pk=32941&T=2

Globally Unique Identifier (entire table): ba.freestatistics.org/blog/index.php?pk=32941&T=2

As an alternative you can also use a QR Code:  

The GUIDs for individual cells are displayed in the table below:

Partial Autocorrelation Function
Time lag kPACF(k)T-STATP-value
10.1550931.39580.083289
20.2068861.8620.033117
30.2866842.58020.00584
4-0.16937-1.52430.06566
50.0730180.65720.256469
60.0539350.48540.314348
70.0768840.6920.245472
80.0406610.3660.357677
90.0430490.38740.349723
10-0.040651-0.36590.357713
11-0.12377-1.11390.134302
12-0.23226-2.09030.019862
13-0.024339-0.21910.41358
140.0305910.27530.391888
150.2081891.87370.032289
16-0.033439-0.3010.38211
170.1894041.70460.046047
180.2398712.15880.016911
19-0.026967-0.24270.404424
20-0.040076-0.36070.359637
210.2030271.82720.035673
22-0.071206-0.64090.261714
230.1676861.50920.067572
24-0.289206-2.60290.005496
25-0.054712-0.49240.311882
26-0.143966-1.29570.099381
27-0.01562-0.14060.444274
28-0.071004-0.6390.262301
290.0387350.34860.36414
30-0.149909-1.34920.090519
310.1425081.28260.10165
320.0224120.20170.420327
33-0.018828-0.16950.43293
34-0.140844-1.26760.104288
35-0.051915-0.46720.320794
36-0.037522-0.33770.368232
370.1142251.0280.153498
38-0.05682-0.51140.305239
39-0.000382-0.00340.498632
40-0.065732-0.59160.277886
41-0.124753-1.12280.132424
42-0.075845-0.68260.248401
43-0.099593-0.89630.186363
440.0564230.50780.306484
450.055710.50140.308728
46-0.013712-0.12340.451045
470.0658430.59260.277556
48-0.090097-0.81090.209907


Parameters (Session):
par1 = 48 ; par2 = 1 ; par3 = 0 ; par4 = 0 ; par5 = 12 ;
Parameters (R input):
par1 = 48 ; par2 = 1 ; par3 = 0 ; par4 = 1 ; par5 = 12 ;
R code (references can be found in the software module):
if (par1 == 'Default') {
par1 = 10*log10(length(x))
} else {
par1 <- as.numeric(par1)
}
par2 <- as.numeric(par2)
par3 <- as.numeric(par3)
par4 <- as.numeric(par4)
par5 <- as.numeric(par5)
if (par2 == 0) {
x <- log(x)
} else {
x <- (x ^ par2 - 1) / par2
}
if (par3 > 0) x <- diff(x,lag=1,difference=par3)
if (par4 > 0) x <- diff(x,lag=par5,difference=par4)
bitmap(file='pic1.png')
racf <- acf(x,par1,main='Autocorrelation',xlab='lags',ylab='ACF')
dev.off()
bitmap(file='pic2.png')
rpacf <- pacf(x,par1,main='Partial Autocorrelation',xlab='lags',ylab='PACF')
dev.off()
(myacf <- c(racf$acf))
(mypacf <- c(rpacf$acf))
lengthx <- length(x)
sqrtn <- sqrt(lengthx)
load(file='createtable')
a<-table.start()
a<-table.row.start(a)
a<-table.element(a,'Autocorrelation Function',4,TRUE)
a<-table.row.end(a)
a<-table.row.start(a)
a<-table.element(a,'Time lag k',header=TRUE)
a<-table.element(a,hyperlink('basics.htm','ACF(k)','click here for more information about the Autocorrelation Function'),header=TRUE)
a<-table.element(a,'T-STAT',header=TRUE)
a<-table.element(a,'P-value',header=TRUE)
a<-table.row.end(a)
for (i in 2:(par1+1)) {
a<-table.row.start(a)
a<-table.element(a,i-1,header=TRUE)
a<-table.element(a,round(myacf[i],6))
mytstat <- myacf[i]*sqrtn
a<-table.element(a,round(mytstat,4))
a<-table.element(a,round(1-pt(abs(mytstat),lengthx),6))
a<-table.row.end(a)
}
a<-table.end(a)
table.save(a,file='mytable.tab')
a<-table.start()
a<-table.row.start(a)
a<-table.element(a,'Partial Autocorrelation Function',4,TRUE)
a<-table.row.end(a)
a<-table.row.start(a)
a<-table.element(a,'Time lag k',header=TRUE)
a<-table.element(a,hyperlink('basics.htm','PACF(k)','click here for more information about the Partial Autocorrelation Function'),header=TRUE)
a<-table.element(a,'T-STAT',header=TRUE)
a<-table.element(a,'P-value',header=TRUE)
a<-table.row.end(a)
for (i in 1:par1) {
a<-table.row.start(a)
a<-table.element(a,i,header=TRUE)
a<-table.element(a,round(mypacf[i],6))
mytstat <- mypacf[i]*sqrtn
a<-table.element(a,round(mytstat,4))
a<-table.element(a,round(1-pt(abs(mytstat),lengthx),6))
a<-table.row.end(a)
}
a<-table.end(a)
table.save(a,file='mytable1.tab')