Free Statistics

of Irreproducible Research!

Author's title

Author*The author of this computation has been verified*
R Software Modulerwasp_autocorrelation.wasp
Title produced by software(Partial) Autocorrelation Function
Date of computationFri, 12 Dec 2008 06:35:20 -0700
Cite this page as followsStatistical Computations at FreeStatistics.org, Office for Research Development and Education, URL https://freestatistics.org/blog/index.php?v=date/2008/Dec/12/t1229088952xxzlajv52ug3r43.htm/, Retrieved Fri, 17 May 2024 03:05:15 +0000
Statistical Computations at FreeStatistics.org, Office for Research Development and Education, URL https://freestatistics.org/blog/index.php?pk=32712, Retrieved Fri, 17 May 2024 03:05:15 +0000
QR Codes:

Original text written by user:
IsPrivate?No (this computation is public)
User-defined keywords
Estimated Impact185
Family? (F = Feedback message, R = changed R code, M = changed R Module, P = changed Parameters, D = changed Data)
-     [Univariate Data Series] [Uitvoer.Nederland] [2008-12-03 15:11:10] [988ab43f527fc78aae41c84649095267]
-   P   [Univariate Data Series] [Export From Belgi...] [2008-12-03 15:52:29] [988ab43f527fc78aae41c84649095267]
- RMP     [(Partial) Autocorrelation Function] [Partial Autocorre...] [2008-12-03 16:01:07] [988ab43f527fc78aae41c84649095267]
-   P         [(Partial) Autocorrelation Function] [Partial Autocorre...] [2008-12-12 13:35:20] [5d823194959040fa9b19b8c8302177e6] [Current]
Feedback Forum

Post a new message
Dataseries X:
2236
2084.9
2409.5
2199.3
2203.5
2254.1
1975.8
1742.2
2520.6
2438.1
2126.3
2267.5
2201.1
2128.5
2596
2458.2
2210.5
2621.2
2231.4
2103.6
2685.8
2539.3
2462.4
2693.3
2307.7
2385.9
2737.6
2653.9
2545.4
2848.8
2359.5
2488.3
2861.1
2717.9
2844
2749
2652.9
2660.2
3187.1
2774.1
3158.2
3244.6
2665.5
2820.8
2983.4
3077.4
3024.8
2731.8
3046.2
2834.8
3292.8
2946.1
3196.9
3284.2
3003
2979
3137.4
3630.2
3270.7
2942.3


Summary of computational transaction
Raw Inputview raw input (R code)
Raw Outputview raw output of R engine
Computing time1 seconds
R Server'Gwilym Jenkins' @ 72.249.127.135

\begin{tabular}{lllllllll}
\hline
Summary of computational transaction \tabularnewline
Raw Input & view raw input (R code)  \tabularnewline
Raw Output & view raw output of R engine  \tabularnewline
Computing time & 1 seconds \tabularnewline
R Server & 'Gwilym Jenkins' @ 72.249.127.135 \tabularnewline
\hline
\end{tabular}
%Source: https://freestatistics.org/blog/index.php?pk=32712&T=0

[TABLE]
[ROW][C]Summary of computational transaction[/C][/ROW]
[ROW][C]Raw Input[/C][C]view raw input (R code) [/C][/ROW]
[ROW][C]Raw Output[/C][C]view raw output of R engine [/C][/ROW]
[ROW][C]Computing time[/C][C]1 seconds[/C][/ROW]
[ROW][C]R Server[/C][C]'Gwilym Jenkins' @ 72.249.127.135[/C][/ROW]
[/TABLE]
Source: https://freestatistics.org/blog/index.php?pk=32712&T=0

Globally Unique Identifier (entire table): ba.freestatistics.org/blog/index.php?pk=32712&T=0

As an alternative you can also use a QR Code:  

The GUIDs for individual cells are displayed in the table below:

Summary of computational transaction
Raw Inputview raw input (R code)
Raw Outputview raw output of R engine
Computing time1 seconds
R Server'Gwilym Jenkins' @ 72.249.127.135


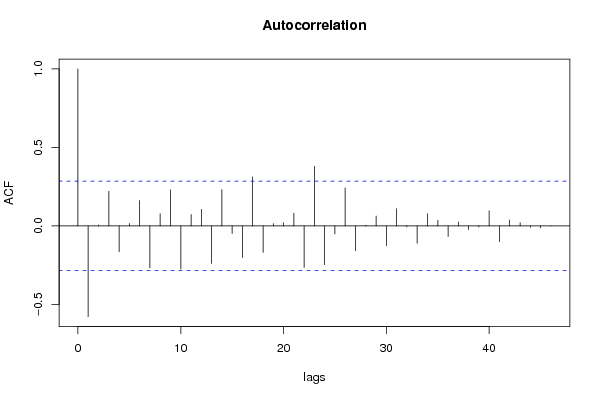
Autocorrelation Function
Time lag kACF(k)T-STATP-value
1-0.57845-3.96570.000124
20.0057570.03950.484341
30.2203371.51060.068798
4-0.165153-1.13220.13164
50.0156210.10710.457587
60.1612781.10570.137249
7-0.267522-1.8340.036492
80.0772830.52980.299365
90.2295741.57390.061112
10-0.275122-1.88610.032732
110.0722410.49530.311361
120.1058650.72580.235789
13-0.23901-1.63860.05399
140.2307321.58180.060199
15-0.04836-0.33150.370855
16-0.201953-1.38450.086369
170.3119972.13890.018833
18-0.169215-1.16010.125938
190.0140840.09660.461745
200.0207010.14190.443876
210.0802440.55010.292419
22-0.26447-1.81310.038102
230.3798352.6040.006147
24-0.247507-1.69680.048172
25-0.051593-0.35370.362571
260.2417871.65760.052029
27-0.15808-1.08370.142003
280.0045550.03120.48761
290.0624110.42790.33535
30-0.126776-0.86910.194596
310.1089470.74690.229422
32-0.007055-0.04840.480816
33-0.111346-0.76330.224536
340.0771010.52860.299793
350.035090.24060.405469
36-0.067157-0.46040.323675
370.0247730.16980.432934
38-0.023359-0.16010.436728
39-0.007651-0.05240.479196
400.0958050.65680.257255
41-0.100447-0.68860.247222
420.0367330.25180.401136
430.0203790.13970.444742
44-0.007996-0.05480.478259
45-0.013499-0.09250.46333
46-0.001412-0.00970.49616
47NANANA
48NANANA

\begin{tabular}{lllllllll}
\hline
Autocorrelation Function \tabularnewline
Time lag k & ACF(k) & T-STAT & P-value \tabularnewline
1 & -0.57845 & -3.9657 & 0.000124 \tabularnewline
2 & 0.005757 & 0.0395 & 0.484341 \tabularnewline
3 & 0.220337 & 1.5106 & 0.068798 \tabularnewline
4 & -0.165153 & -1.1322 & 0.13164 \tabularnewline
5 & 0.015621 & 0.1071 & 0.457587 \tabularnewline
6 & 0.161278 & 1.1057 & 0.137249 \tabularnewline
7 & -0.267522 & -1.834 & 0.036492 \tabularnewline
8 & 0.077283 & 0.5298 & 0.299365 \tabularnewline
9 & 0.229574 & 1.5739 & 0.061112 \tabularnewline
10 & -0.275122 & -1.8861 & 0.032732 \tabularnewline
11 & 0.072241 & 0.4953 & 0.311361 \tabularnewline
12 & 0.105865 & 0.7258 & 0.235789 \tabularnewline
13 & -0.23901 & -1.6386 & 0.05399 \tabularnewline
14 & 0.230732 & 1.5818 & 0.060199 \tabularnewline
15 & -0.04836 & -0.3315 & 0.370855 \tabularnewline
16 & -0.201953 & -1.3845 & 0.086369 \tabularnewline
17 & 0.311997 & 2.1389 & 0.018833 \tabularnewline
18 & -0.169215 & -1.1601 & 0.125938 \tabularnewline
19 & 0.014084 & 0.0966 & 0.461745 \tabularnewline
20 & 0.020701 & 0.1419 & 0.443876 \tabularnewline
21 & 0.080244 & 0.5501 & 0.292419 \tabularnewline
22 & -0.26447 & -1.8131 & 0.038102 \tabularnewline
23 & 0.379835 & 2.604 & 0.006147 \tabularnewline
24 & -0.247507 & -1.6968 & 0.048172 \tabularnewline
25 & -0.051593 & -0.3537 & 0.362571 \tabularnewline
26 & 0.241787 & 1.6576 & 0.052029 \tabularnewline
27 & -0.15808 & -1.0837 & 0.142003 \tabularnewline
28 & 0.004555 & 0.0312 & 0.48761 \tabularnewline
29 & 0.062411 & 0.4279 & 0.33535 \tabularnewline
30 & -0.126776 & -0.8691 & 0.194596 \tabularnewline
31 & 0.108947 & 0.7469 & 0.229422 \tabularnewline
32 & -0.007055 & -0.0484 & 0.480816 \tabularnewline
33 & -0.111346 & -0.7633 & 0.224536 \tabularnewline
34 & 0.077101 & 0.5286 & 0.299793 \tabularnewline
35 & 0.03509 & 0.2406 & 0.405469 \tabularnewline
36 & -0.067157 & -0.4604 & 0.323675 \tabularnewline
37 & 0.024773 & 0.1698 & 0.432934 \tabularnewline
38 & -0.023359 & -0.1601 & 0.436728 \tabularnewline
39 & -0.007651 & -0.0524 & 0.479196 \tabularnewline
40 & 0.095805 & 0.6568 & 0.257255 \tabularnewline
41 & -0.100447 & -0.6886 & 0.247222 \tabularnewline
42 & 0.036733 & 0.2518 & 0.401136 \tabularnewline
43 & 0.020379 & 0.1397 & 0.444742 \tabularnewline
44 & -0.007996 & -0.0548 & 0.478259 \tabularnewline
45 & -0.013499 & -0.0925 & 0.46333 \tabularnewline
46 & -0.001412 & -0.0097 & 0.49616 \tabularnewline
47 & NA & NA & NA \tabularnewline
48 & NA & NA & NA \tabularnewline
\hline
\end{tabular}
%Source: https://freestatistics.org/blog/index.php?pk=32712&T=1

[TABLE]
[ROW][C]Autocorrelation Function[/C][/ROW]
[ROW][C]Time lag k[/C][C]ACF(k)[/C][C]T-STAT[/C][C]P-value[/C][/ROW]
[ROW][C]1[/C][C]-0.57845[/C][C]-3.9657[/C][C]0.000124[/C][/ROW]
[ROW][C]2[/C][C]0.005757[/C][C]0.0395[/C][C]0.484341[/C][/ROW]
[ROW][C]3[/C][C]0.220337[/C][C]1.5106[/C][C]0.068798[/C][/ROW]
[ROW][C]4[/C][C]-0.165153[/C][C]-1.1322[/C][C]0.13164[/C][/ROW]
[ROW][C]5[/C][C]0.015621[/C][C]0.1071[/C][C]0.457587[/C][/ROW]
[ROW][C]6[/C][C]0.161278[/C][C]1.1057[/C][C]0.137249[/C][/ROW]
[ROW][C]7[/C][C]-0.267522[/C][C]-1.834[/C][C]0.036492[/C][/ROW]
[ROW][C]8[/C][C]0.077283[/C][C]0.5298[/C][C]0.299365[/C][/ROW]
[ROW][C]9[/C][C]0.229574[/C][C]1.5739[/C][C]0.061112[/C][/ROW]
[ROW][C]10[/C][C]-0.275122[/C][C]-1.8861[/C][C]0.032732[/C][/ROW]
[ROW][C]11[/C][C]0.072241[/C][C]0.4953[/C][C]0.311361[/C][/ROW]
[ROW][C]12[/C][C]0.105865[/C][C]0.7258[/C][C]0.235789[/C][/ROW]
[ROW][C]13[/C][C]-0.23901[/C][C]-1.6386[/C][C]0.05399[/C][/ROW]
[ROW][C]14[/C][C]0.230732[/C][C]1.5818[/C][C]0.060199[/C][/ROW]
[ROW][C]15[/C][C]-0.04836[/C][C]-0.3315[/C][C]0.370855[/C][/ROW]
[ROW][C]16[/C][C]-0.201953[/C][C]-1.3845[/C][C]0.086369[/C][/ROW]
[ROW][C]17[/C][C]0.311997[/C][C]2.1389[/C][C]0.018833[/C][/ROW]
[ROW][C]18[/C][C]-0.169215[/C][C]-1.1601[/C][C]0.125938[/C][/ROW]
[ROW][C]19[/C][C]0.014084[/C][C]0.0966[/C][C]0.461745[/C][/ROW]
[ROW][C]20[/C][C]0.020701[/C][C]0.1419[/C][C]0.443876[/C][/ROW]
[ROW][C]21[/C][C]0.080244[/C][C]0.5501[/C][C]0.292419[/C][/ROW]
[ROW][C]22[/C][C]-0.26447[/C][C]-1.8131[/C][C]0.038102[/C][/ROW]
[ROW][C]23[/C][C]0.379835[/C][C]2.604[/C][C]0.006147[/C][/ROW]
[ROW][C]24[/C][C]-0.247507[/C][C]-1.6968[/C][C]0.048172[/C][/ROW]
[ROW][C]25[/C][C]-0.051593[/C][C]-0.3537[/C][C]0.362571[/C][/ROW]
[ROW][C]26[/C][C]0.241787[/C][C]1.6576[/C][C]0.052029[/C][/ROW]
[ROW][C]27[/C][C]-0.15808[/C][C]-1.0837[/C][C]0.142003[/C][/ROW]
[ROW][C]28[/C][C]0.004555[/C][C]0.0312[/C][C]0.48761[/C][/ROW]
[ROW][C]29[/C][C]0.062411[/C][C]0.4279[/C][C]0.33535[/C][/ROW]
[ROW][C]30[/C][C]-0.126776[/C][C]-0.8691[/C][C]0.194596[/C][/ROW]
[ROW][C]31[/C][C]0.108947[/C][C]0.7469[/C][C]0.229422[/C][/ROW]
[ROW][C]32[/C][C]-0.007055[/C][C]-0.0484[/C][C]0.480816[/C][/ROW]
[ROW][C]33[/C][C]-0.111346[/C][C]-0.7633[/C][C]0.224536[/C][/ROW]
[ROW][C]34[/C][C]0.077101[/C][C]0.5286[/C][C]0.299793[/C][/ROW]
[ROW][C]35[/C][C]0.03509[/C][C]0.2406[/C][C]0.405469[/C][/ROW]
[ROW][C]36[/C][C]-0.067157[/C][C]-0.4604[/C][C]0.323675[/C][/ROW]
[ROW][C]37[/C][C]0.024773[/C][C]0.1698[/C][C]0.432934[/C][/ROW]
[ROW][C]38[/C][C]-0.023359[/C][C]-0.1601[/C][C]0.436728[/C][/ROW]
[ROW][C]39[/C][C]-0.007651[/C][C]-0.0524[/C][C]0.479196[/C][/ROW]
[ROW][C]40[/C][C]0.095805[/C][C]0.6568[/C][C]0.257255[/C][/ROW]
[ROW][C]41[/C][C]-0.100447[/C][C]-0.6886[/C][C]0.247222[/C][/ROW]
[ROW][C]42[/C][C]0.036733[/C][C]0.2518[/C][C]0.401136[/C][/ROW]
[ROW][C]43[/C][C]0.020379[/C][C]0.1397[/C][C]0.444742[/C][/ROW]
[ROW][C]44[/C][C]-0.007996[/C][C]-0.0548[/C][C]0.478259[/C][/ROW]
[ROW][C]45[/C][C]-0.013499[/C][C]-0.0925[/C][C]0.46333[/C][/ROW]
[ROW][C]46[/C][C]-0.001412[/C][C]-0.0097[/C][C]0.49616[/C][/ROW]
[ROW][C]47[/C][C]NA[/C][C]NA[/C][C]NA[/C][/ROW]
[ROW][C]48[/C][C]NA[/C][C]NA[/C][C]NA[/C][/ROW]
[/TABLE]
Source: https://freestatistics.org/blog/index.php?pk=32712&T=1

Globally Unique Identifier (entire table): ba.freestatistics.org/blog/index.php?pk=32712&T=1

As an alternative you can also use a QR Code:  

The GUIDs for individual cells are displayed in the table below:

Autocorrelation Function
Time lag kACF(k)T-STATP-value
1-0.57845-3.96570.000124
20.0057570.03950.484341
30.2203371.51060.068798
4-0.165153-1.13220.13164
50.0156210.10710.457587
60.1612781.10570.137249
7-0.267522-1.8340.036492
80.0772830.52980.299365
90.2295741.57390.061112
10-0.275122-1.88610.032732
110.0722410.49530.311361
120.1058650.72580.235789
13-0.23901-1.63860.05399
140.2307321.58180.060199
15-0.04836-0.33150.370855
16-0.201953-1.38450.086369
170.3119972.13890.018833
18-0.169215-1.16010.125938
190.0140840.09660.461745
200.0207010.14190.443876
210.0802440.55010.292419
22-0.26447-1.81310.038102
230.3798352.6040.006147
24-0.247507-1.69680.048172
25-0.051593-0.35370.362571
260.2417871.65760.052029
27-0.15808-1.08370.142003
280.0045550.03120.48761
290.0624110.42790.33535
30-0.126776-0.86910.194596
310.1089470.74690.229422
32-0.007055-0.04840.480816
33-0.111346-0.76330.224536
340.0771010.52860.299793
350.035090.24060.405469
36-0.067157-0.46040.323675
370.0247730.16980.432934
38-0.023359-0.16010.436728
39-0.007651-0.05240.479196
400.0958050.65680.257255
41-0.100447-0.68860.247222
420.0367330.25180.401136
430.0203790.13970.444742
44-0.007996-0.05480.478259
45-0.013499-0.09250.46333
46-0.001412-0.00970.49616
47NANANA
48NANANA


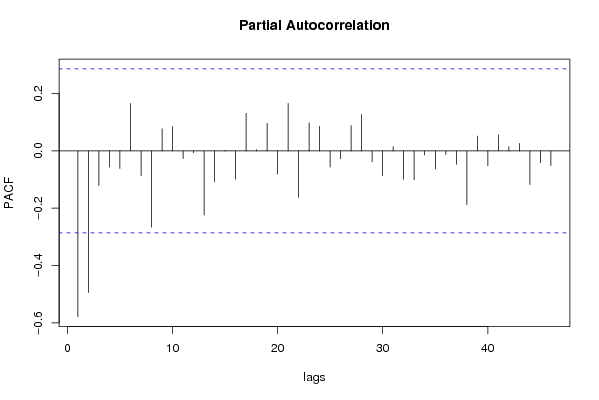
Partial Autocorrelation Function
Time lag kPACF(k)T-STATP-value
1-0.57845-3.96570.000124
2-0.494213-3.38820.000716
3-0.120436-0.82570.206582
4-0.05613-0.38480.351058
5-0.061373-0.42080.337926
60.1654371.13420.131236
7-0.08601-0.58970.279122
8-0.266473-1.82680.037038
90.0770420.52820.299932
100.0842530.57760.283143
11-0.026983-0.1850.427019
12-0.006371-0.04370.482673
13-0.223827-1.53450.065808
14-0.108345-0.74280.230656
150.0021890.0150.494045
16-0.098475-0.67510.251456
170.1310870.89870.1867
180.0043590.02990.488144
190.0960430.65840.256734
20-0.081284-0.55730.289998
210.1654071.1340.131278
22-0.162484-1.11390.135485
230.0975110.66850.253541
240.0862890.59160.278487
25-0.056317-0.38610.350585
26-0.027879-0.19110.424624
270.0879440.60290.274733
280.1270440.8710.1941
29-0.037876-0.25970.398128
30-0.086272-0.59150.278526
310.0146680.10060.460163
32-0.099524-0.68230.249198
33-0.10078-0.69090.246508
34-0.014114-0.09680.461663
35-0.062918-0.43130.334095
36-0.012098-0.08290.467125
37-0.047013-0.32230.374325
38-0.187747-1.28710.102176
390.0518790.35570.361843
40-0.051802-0.35510.362038
410.0557340.38210.352057
420.0143510.09840.461022
430.0260910.17890.429405
44-0.116998-0.80210.213267
45-0.041766-0.28630.387941
46-0.051283-0.35160.363364
47NANANA
48NANANA

\begin{tabular}{lllllllll}
\hline
Partial Autocorrelation Function \tabularnewline
Time lag k & PACF(k) & T-STAT & P-value \tabularnewline
1 & -0.57845 & -3.9657 & 0.000124 \tabularnewline
2 & -0.494213 & -3.3882 & 0.000716 \tabularnewline
3 & -0.120436 & -0.8257 & 0.206582 \tabularnewline
4 & -0.05613 & -0.3848 & 0.351058 \tabularnewline
5 & -0.061373 & -0.4208 & 0.337926 \tabularnewline
6 & 0.165437 & 1.1342 & 0.131236 \tabularnewline
7 & -0.08601 & -0.5897 & 0.279122 \tabularnewline
8 & -0.266473 & -1.8268 & 0.037038 \tabularnewline
9 & 0.077042 & 0.5282 & 0.299932 \tabularnewline
10 & 0.084253 & 0.5776 & 0.283143 \tabularnewline
11 & -0.026983 & -0.185 & 0.427019 \tabularnewline
12 & -0.006371 & -0.0437 & 0.482673 \tabularnewline
13 & -0.223827 & -1.5345 & 0.065808 \tabularnewline
14 & -0.108345 & -0.7428 & 0.230656 \tabularnewline
15 & 0.002189 & 0.015 & 0.494045 \tabularnewline
16 & -0.098475 & -0.6751 & 0.251456 \tabularnewline
17 & 0.131087 & 0.8987 & 0.1867 \tabularnewline
18 & 0.004359 & 0.0299 & 0.488144 \tabularnewline
19 & 0.096043 & 0.6584 & 0.256734 \tabularnewline
20 & -0.081284 & -0.5573 & 0.289998 \tabularnewline
21 & 0.165407 & 1.134 & 0.131278 \tabularnewline
22 & -0.162484 & -1.1139 & 0.135485 \tabularnewline
23 & 0.097511 & 0.6685 & 0.253541 \tabularnewline
24 & 0.086289 & 0.5916 & 0.278487 \tabularnewline
25 & -0.056317 & -0.3861 & 0.350585 \tabularnewline
26 & -0.027879 & -0.1911 & 0.424624 \tabularnewline
27 & 0.087944 & 0.6029 & 0.274733 \tabularnewline
28 & 0.127044 & 0.871 & 0.1941 \tabularnewline
29 & -0.037876 & -0.2597 & 0.398128 \tabularnewline
30 & -0.086272 & -0.5915 & 0.278526 \tabularnewline
31 & 0.014668 & 0.1006 & 0.460163 \tabularnewline
32 & -0.099524 & -0.6823 & 0.249198 \tabularnewline
33 & -0.10078 & -0.6909 & 0.246508 \tabularnewline
34 & -0.014114 & -0.0968 & 0.461663 \tabularnewline
35 & -0.062918 & -0.4313 & 0.334095 \tabularnewline
36 & -0.012098 & -0.0829 & 0.467125 \tabularnewline
37 & -0.047013 & -0.3223 & 0.374325 \tabularnewline
38 & -0.187747 & -1.2871 & 0.102176 \tabularnewline
39 & 0.051879 & 0.3557 & 0.361843 \tabularnewline
40 & -0.051802 & -0.3551 & 0.362038 \tabularnewline
41 & 0.055734 & 0.3821 & 0.352057 \tabularnewline
42 & 0.014351 & 0.0984 & 0.461022 \tabularnewline
43 & 0.026091 & 0.1789 & 0.429405 \tabularnewline
44 & -0.116998 & -0.8021 & 0.213267 \tabularnewline
45 & -0.041766 & -0.2863 & 0.387941 \tabularnewline
46 & -0.051283 & -0.3516 & 0.363364 \tabularnewline
47 & NA & NA & NA \tabularnewline
48 & NA & NA & NA \tabularnewline
\hline
\end{tabular}
%Source: https://freestatistics.org/blog/index.php?pk=32712&T=2

[TABLE]
[ROW][C]Partial Autocorrelation Function[/C][/ROW]
[ROW][C]Time lag k[/C][C]PACF(k)[/C][C]T-STAT[/C][C]P-value[/C][/ROW]
[ROW][C]1[/C][C]-0.57845[/C][C]-3.9657[/C][C]0.000124[/C][/ROW]
[ROW][C]2[/C][C]-0.494213[/C][C]-3.3882[/C][C]0.000716[/C][/ROW]
[ROW][C]3[/C][C]-0.120436[/C][C]-0.8257[/C][C]0.206582[/C][/ROW]
[ROW][C]4[/C][C]-0.05613[/C][C]-0.3848[/C][C]0.351058[/C][/ROW]
[ROW][C]5[/C][C]-0.061373[/C][C]-0.4208[/C][C]0.337926[/C][/ROW]
[ROW][C]6[/C][C]0.165437[/C][C]1.1342[/C][C]0.131236[/C][/ROW]
[ROW][C]7[/C][C]-0.08601[/C][C]-0.5897[/C][C]0.279122[/C][/ROW]
[ROW][C]8[/C][C]-0.266473[/C][C]-1.8268[/C][C]0.037038[/C][/ROW]
[ROW][C]9[/C][C]0.077042[/C][C]0.5282[/C][C]0.299932[/C][/ROW]
[ROW][C]10[/C][C]0.084253[/C][C]0.5776[/C][C]0.283143[/C][/ROW]
[ROW][C]11[/C][C]-0.026983[/C][C]-0.185[/C][C]0.427019[/C][/ROW]
[ROW][C]12[/C][C]-0.006371[/C][C]-0.0437[/C][C]0.482673[/C][/ROW]
[ROW][C]13[/C][C]-0.223827[/C][C]-1.5345[/C][C]0.065808[/C][/ROW]
[ROW][C]14[/C][C]-0.108345[/C][C]-0.7428[/C][C]0.230656[/C][/ROW]
[ROW][C]15[/C][C]0.002189[/C][C]0.015[/C][C]0.494045[/C][/ROW]
[ROW][C]16[/C][C]-0.098475[/C][C]-0.6751[/C][C]0.251456[/C][/ROW]
[ROW][C]17[/C][C]0.131087[/C][C]0.8987[/C][C]0.1867[/C][/ROW]
[ROW][C]18[/C][C]0.004359[/C][C]0.0299[/C][C]0.488144[/C][/ROW]
[ROW][C]19[/C][C]0.096043[/C][C]0.6584[/C][C]0.256734[/C][/ROW]
[ROW][C]20[/C][C]-0.081284[/C][C]-0.5573[/C][C]0.289998[/C][/ROW]
[ROW][C]21[/C][C]0.165407[/C][C]1.134[/C][C]0.131278[/C][/ROW]
[ROW][C]22[/C][C]-0.162484[/C][C]-1.1139[/C][C]0.135485[/C][/ROW]
[ROW][C]23[/C][C]0.097511[/C][C]0.6685[/C][C]0.253541[/C][/ROW]
[ROW][C]24[/C][C]0.086289[/C][C]0.5916[/C][C]0.278487[/C][/ROW]
[ROW][C]25[/C][C]-0.056317[/C][C]-0.3861[/C][C]0.350585[/C][/ROW]
[ROW][C]26[/C][C]-0.027879[/C][C]-0.1911[/C][C]0.424624[/C][/ROW]
[ROW][C]27[/C][C]0.087944[/C][C]0.6029[/C][C]0.274733[/C][/ROW]
[ROW][C]28[/C][C]0.127044[/C][C]0.871[/C][C]0.1941[/C][/ROW]
[ROW][C]29[/C][C]-0.037876[/C][C]-0.2597[/C][C]0.398128[/C][/ROW]
[ROW][C]30[/C][C]-0.086272[/C][C]-0.5915[/C][C]0.278526[/C][/ROW]
[ROW][C]31[/C][C]0.014668[/C][C]0.1006[/C][C]0.460163[/C][/ROW]
[ROW][C]32[/C][C]-0.099524[/C][C]-0.6823[/C][C]0.249198[/C][/ROW]
[ROW][C]33[/C][C]-0.10078[/C][C]-0.6909[/C][C]0.246508[/C][/ROW]
[ROW][C]34[/C][C]-0.014114[/C][C]-0.0968[/C][C]0.461663[/C][/ROW]
[ROW][C]35[/C][C]-0.062918[/C][C]-0.4313[/C][C]0.334095[/C][/ROW]
[ROW][C]36[/C][C]-0.012098[/C][C]-0.0829[/C][C]0.467125[/C][/ROW]
[ROW][C]37[/C][C]-0.047013[/C][C]-0.3223[/C][C]0.374325[/C][/ROW]
[ROW][C]38[/C][C]-0.187747[/C][C]-1.2871[/C][C]0.102176[/C][/ROW]
[ROW][C]39[/C][C]0.051879[/C][C]0.3557[/C][C]0.361843[/C][/ROW]
[ROW][C]40[/C][C]-0.051802[/C][C]-0.3551[/C][C]0.362038[/C][/ROW]
[ROW][C]41[/C][C]0.055734[/C][C]0.3821[/C][C]0.352057[/C][/ROW]
[ROW][C]42[/C][C]0.014351[/C][C]0.0984[/C][C]0.461022[/C][/ROW]
[ROW][C]43[/C][C]0.026091[/C][C]0.1789[/C][C]0.429405[/C][/ROW]
[ROW][C]44[/C][C]-0.116998[/C][C]-0.8021[/C][C]0.213267[/C][/ROW]
[ROW][C]45[/C][C]-0.041766[/C][C]-0.2863[/C][C]0.387941[/C][/ROW]
[ROW][C]46[/C][C]-0.051283[/C][C]-0.3516[/C][C]0.363364[/C][/ROW]
[ROW][C]47[/C][C]NA[/C][C]NA[/C][C]NA[/C][/ROW]
[ROW][C]48[/C][C]NA[/C][C]NA[/C][C]NA[/C][/ROW]
[/TABLE]
Source: https://freestatistics.org/blog/index.php?pk=32712&T=2

Globally Unique Identifier (entire table): ba.freestatistics.org/blog/index.php?pk=32712&T=2

As an alternative you can also use a QR Code:  

The GUIDs for individual cells are displayed in the table below:

Partial Autocorrelation Function
Time lag kPACF(k)T-STATP-value
1-0.57845-3.96570.000124
2-0.494213-3.38820.000716
3-0.120436-0.82570.206582
4-0.05613-0.38480.351058
5-0.061373-0.42080.337926
60.1654371.13420.131236
7-0.08601-0.58970.279122
8-0.266473-1.82680.037038
90.0770420.52820.299932
100.0842530.57760.283143
11-0.026983-0.1850.427019
12-0.006371-0.04370.482673
13-0.223827-1.53450.065808
14-0.108345-0.74280.230656
150.0021890.0150.494045
16-0.098475-0.67510.251456
170.1310870.89870.1867
180.0043590.02990.488144
190.0960430.65840.256734
20-0.081284-0.55730.289998
210.1654071.1340.131278
22-0.162484-1.11390.135485
230.0975110.66850.253541
240.0862890.59160.278487
25-0.056317-0.38610.350585
26-0.027879-0.19110.424624
270.0879440.60290.274733
280.1270440.8710.1941
29-0.037876-0.25970.398128
30-0.086272-0.59150.278526
310.0146680.10060.460163
32-0.099524-0.68230.249198
33-0.10078-0.69090.246508
34-0.014114-0.09680.461663
35-0.062918-0.43130.334095
36-0.012098-0.08290.467125
37-0.047013-0.32230.374325
38-0.187747-1.28710.102176
390.0518790.35570.361843
40-0.051802-0.35510.362038
410.0557340.38210.352057
420.0143510.09840.461022
430.0260910.17890.429405
44-0.116998-0.80210.213267
45-0.041766-0.28630.387941
46-0.051283-0.35160.363364
47NANANA
48NANANA


Parameters (Session):
par1 = 12 ;
Parameters (R input):
par1 = 48 ; par2 = 1 ; par3 = 1 ; par4 = 1 ; par5 = 12 ;
R code (references can be found in the software module):
if (par1 == 'Default') {
par1 = 10*log10(length(x))
} else {
par1 <- as.numeric(par1)
}
par2 <- as.numeric(par2)
par3 <- as.numeric(par3)
par4 <- as.numeric(par4)
par5 <- as.numeric(par5)
if (par2 == 0) {
x <- log(x)
} else {
x <- (x ^ par2 - 1) / par2
}
if (par3 > 0) x <- diff(x,lag=1,difference=par3)
if (par4 > 0) x <- diff(x,lag=par5,difference=par4)
bitmap(file='pic1.png')
racf <- acf(x,par1,main='Autocorrelation',xlab='lags',ylab='ACF')
dev.off()
bitmap(file='pic2.png')
rpacf <- pacf(x,par1,main='Partial Autocorrelation',xlab='lags',ylab='PACF')
dev.off()
(myacf <- c(racf$acf))
(mypacf <- c(rpacf$acf))
lengthx <- length(x)
sqrtn <- sqrt(lengthx)
load(file='createtable')
a<-table.start()
a<-table.row.start(a)
a<-table.element(a,'Autocorrelation Function',4,TRUE)
a<-table.row.end(a)
a<-table.row.start(a)
a<-table.element(a,'Time lag k',header=TRUE)
a<-table.element(a,hyperlink('basics.htm','ACF(k)','click here for more information about the Autocorrelation Function'),header=TRUE)
a<-table.element(a,'T-STAT',header=TRUE)
a<-table.element(a,'P-value',header=TRUE)
a<-table.row.end(a)
for (i in 2:(par1+1)) {
a<-table.row.start(a)
a<-table.element(a,i-1,header=TRUE)
a<-table.element(a,round(myacf[i],6))
mytstat <- myacf[i]*sqrtn
a<-table.element(a,round(mytstat,4))
a<-table.element(a,round(1-pt(abs(mytstat),lengthx),6))
a<-table.row.end(a)
}
a<-table.end(a)
table.save(a,file='mytable.tab')
a<-table.start()
a<-table.row.start(a)
a<-table.element(a,'Partial Autocorrelation Function',4,TRUE)
a<-table.row.end(a)
a<-table.row.start(a)
a<-table.element(a,'Time lag k',header=TRUE)
a<-table.element(a,hyperlink('basics.htm','PACF(k)','click here for more information about the Partial Autocorrelation Function'),header=TRUE)
a<-table.element(a,'T-STAT',header=TRUE)
a<-table.element(a,'P-value',header=TRUE)
a<-table.row.end(a)
for (i in 1:par1) {
a<-table.row.start(a)
a<-table.element(a,i,header=TRUE)
a<-table.element(a,round(mypacf[i],6))
mytstat <- mypacf[i]*sqrtn
a<-table.element(a,round(mytstat,4))
a<-table.element(a,round(1-pt(abs(mytstat),lengthx),6))
a<-table.row.end(a)
}
a<-table.end(a)
table.save(a,file='mytable1.tab')