Free Statistics

of Irreproducible Research!

Author's title

Author*Unverified author*
R Software Modulerwasp_autocorrelation.wasp
Title produced by software(Partial) Autocorrelation Function
Date of computationThu, 11 Dec 2008 11:05:06 -0700
Cite this page as followsStatistical Computations at FreeStatistics.org, Office for Research Development and Education, URL https://freestatistics.org/blog/index.php?v=date/2008/Dec/11/t1229018817x6tlicdyuny4qbo.htm/, Retrieved Fri, 17 May 2024 04:19:29 +0000
Statistical Computations at FreeStatistics.org, Office for Research Development and Education, URL https://freestatistics.org/blog/index.php?pk=32413, Retrieved Fri, 17 May 2024 04:19:29 +0000
QR Codes:

Original text written by user:
IsPrivate?No (this computation is public)
User-defined keywords
Estimated Impact171
Family? (F = Feedback message, R = changed R code, M = changed R Module, P = changed Parameters, D = changed Data)
-       [(Partial) Autocorrelation Function] [Nick Follens MAR 203] [2008-12-11 18:05:06] [b3b27f5ee34edf98a28c70ba0002bc05] [Current]
Feedback Forum

Post a new message
Dataseries X:
1.4369
1.4975
1.577
1.5553
1.5557
1.575
1.5527
1.4748
1.4718
1.457
1.4684
1.4227
1.3896
1.3622
1.3716
1.3419
1.3511
1.3516
1.3242
1.3074
1.2999
1.3213
1.2881
1.2611
1.2727
1.2811
1.2684
1.265
1.277
1.2271
1.202
1.1938
1.2103
1.1856
1.1786
1.2015
1.2256
1.2292
1.2037
1.2165
1.2694
1.2938
1.3201
1.3014
1.3119
1.3408
1.2991
1.249
1.2218
1.2176
1.2266
1.2138
1.2007
1.1985
1.2262
1.2646
1.2613
1.2286
1.1702
1.1692
1.1222
1.1139
1.1372
1.1663
1.1582
1.0848
1.0807
1.0773
1.0622
1.0183
1.0014
0.9811


Summary of computational transaction
Raw Inputview raw input (R code)
Raw Outputview raw output of R engine
Computing time1 seconds
R Server'George Udny Yule' @ 72.249.76.132

\begin{tabular}{lllllllll}
\hline
Summary of computational transaction \tabularnewline
Raw Input & view raw input (R code)  \tabularnewline
Raw Output & view raw output of R engine  \tabularnewline
Computing time & 1 seconds \tabularnewline
R Server & 'George Udny Yule' @ 72.249.76.132 \tabularnewline
\hline
\end{tabular}
%Source: https://freestatistics.org/blog/index.php?pk=32413&T=0

[TABLE]
[ROW][C]Summary of computational transaction[/C][/ROW]
[ROW][C]Raw Input[/C][C]view raw input (R code) [/C][/ROW]
[ROW][C]Raw Output[/C][C]view raw output of R engine [/C][/ROW]
[ROW][C]Computing time[/C][C]1 seconds[/C][/ROW]
[ROW][C]R Server[/C][C]'George Udny Yule' @ 72.249.76.132[/C][/ROW]
[/TABLE]
Source: https://freestatistics.org/blog/index.php?pk=32413&T=0

Globally Unique Identifier (entire table): ba.freestatistics.org/blog/index.php?pk=32413&T=0

As an alternative you can also use a QR Code:  

The GUIDs for individual cells are displayed in the table below:

Summary of computational transaction
Raw Inputview raw input (R code)
Raw Outputview raw output of R engine
Computing time1 seconds
R Server'George Udny Yule' @ 72.249.76.132


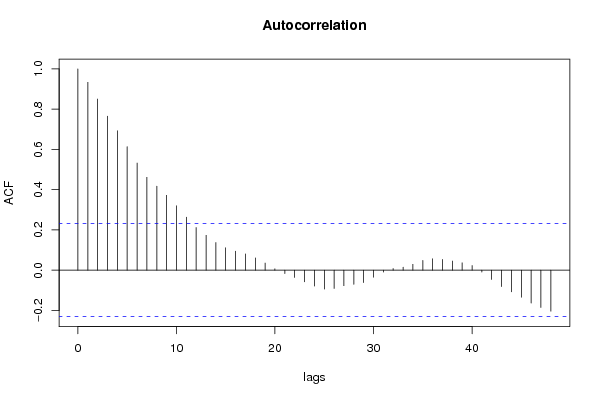
Autocorrelation Function
Time lag kACF(k)T-STATP-value
10.9334377.92050
20.8505057.21680
30.76516.49210
40.6927835.87850
50.6134785.20551e-06
60.5321134.51511.2e-05
70.4612173.91360.000102
80.4175483.5430.000349
90.3721263.15760.001162
100.3198082.71370.00416
110.263132.23270.014338
120.2118981.7980.038184
130.1730411.46830.073189
140.1373421.16540.123854
150.1110440.94220.174611
160.0945790.80250.212443
170.0807350.68510.247752
180.0607680.51560.303844
190.0353640.30010.382493
200.0070710.060.47616
21-0.016938-0.14370.443059
22-0.036433-0.30910.379054
23-0.057913-0.49140.312315
24-0.079207-0.67210.251836
25-0.093727-0.79530.214526
26-0.090717-0.76980.221981
27-0.077146-0.65460.257403
28-0.070149-0.59520.276778
29-0.061427-0.52120.301904
30-0.035022-0.29720.383596
31-0.009457-0.08020.468133
320.0082840.07030.472078
330.015040.12760.449402
340.0291860.24760.402556
350.0481430.40850.342057
360.0567530.48160.315789
370.0531120.45070.326791
380.0452730.38420.350998
390.036520.30990.378772
400.0231730.19660.422335
41-0.009615-0.08160.467603
42-0.045744-0.38820.349524
43-0.081696-0.69320.245203
44-0.107269-0.91020.182875
45-0.13396-1.13670.129718
46-0.16327-1.38540.085105
47-0.185015-1.56990.060411
48-0.203848-1.72970.043984

\begin{tabular}{lllllllll}
\hline
Autocorrelation Function \tabularnewline
Time lag k & ACF(k) & T-STAT & P-value \tabularnewline
1 & 0.933437 & 7.9205 & 0 \tabularnewline
2 & 0.850505 & 7.2168 & 0 \tabularnewline
3 & 0.7651 & 6.4921 & 0 \tabularnewline
4 & 0.692783 & 5.8785 & 0 \tabularnewline
5 & 0.613478 & 5.2055 & 1e-06 \tabularnewline
6 & 0.532113 & 4.5151 & 1.2e-05 \tabularnewline
7 & 0.461217 & 3.9136 & 0.000102 \tabularnewline
8 & 0.417548 & 3.543 & 0.000349 \tabularnewline
9 & 0.372126 & 3.1576 & 0.001162 \tabularnewline
10 & 0.319808 & 2.7137 & 0.00416 \tabularnewline
11 & 0.26313 & 2.2327 & 0.014338 \tabularnewline
12 & 0.211898 & 1.798 & 0.038184 \tabularnewline
13 & 0.173041 & 1.4683 & 0.073189 \tabularnewline
14 & 0.137342 & 1.1654 & 0.123854 \tabularnewline
15 & 0.111044 & 0.9422 & 0.174611 \tabularnewline
16 & 0.094579 & 0.8025 & 0.212443 \tabularnewline
17 & 0.080735 & 0.6851 & 0.247752 \tabularnewline
18 & 0.060768 & 0.5156 & 0.303844 \tabularnewline
19 & 0.035364 & 0.3001 & 0.382493 \tabularnewline
20 & 0.007071 & 0.06 & 0.47616 \tabularnewline
21 & -0.016938 & -0.1437 & 0.443059 \tabularnewline
22 & -0.036433 & -0.3091 & 0.379054 \tabularnewline
23 & -0.057913 & -0.4914 & 0.312315 \tabularnewline
24 & -0.079207 & -0.6721 & 0.251836 \tabularnewline
25 & -0.093727 & -0.7953 & 0.214526 \tabularnewline
26 & -0.090717 & -0.7698 & 0.221981 \tabularnewline
27 & -0.077146 & -0.6546 & 0.257403 \tabularnewline
28 & -0.070149 & -0.5952 & 0.276778 \tabularnewline
29 & -0.061427 & -0.5212 & 0.301904 \tabularnewline
30 & -0.035022 & -0.2972 & 0.383596 \tabularnewline
31 & -0.009457 & -0.0802 & 0.468133 \tabularnewline
32 & 0.008284 & 0.0703 & 0.472078 \tabularnewline
33 & 0.01504 & 0.1276 & 0.449402 \tabularnewline
34 & 0.029186 & 0.2476 & 0.402556 \tabularnewline
35 & 0.048143 & 0.4085 & 0.342057 \tabularnewline
36 & 0.056753 & 0.4816 & 0.315789 \tabularnewline
37 & 0.053112 & 0.4507 & 0.326791 \tabularnewline
38 & 0.045273 & 0.3842 & 0.350998 \tabularnewline
39 & 0.03652 & 0.3099 & 0.378772 \tabularnewline
40 & 0.023173 & 0.1966 & 0.422335 \tabularnewline
41 & -0.009615 & -0.0816 & 0.467603 \tabularnewline
42 & -0.045744 & -0.3882 & 0.349524 \tabularnewline
43 & -0.081696 & -0.6932 & 0.245203 \tabularnewline
44 & -0.107269 & -0.9102 & 0.182875 \tabularnewline
45 & -0.13396 & -1.1367 & 0.129718 \tabularnewline
46 & -0.16327 & -1.3854 & 0.085105 \tabularnewline
47 & -0.185015 & -1.5699 & 0.060411 \tabularnewline
48 & -0.203848 & -1.7297 & 0.043984 \tabularnewline
\hline
\end{tabular}
%Source: https://freestatistics.org/blog/index.php?pk=32413&T=1

[TABLE]
[ROW][C]Autocorrelation Function[/C][/ROW]
[ROW][C]Time lag k[/C][C]ACF(k)[/C][C]T-STAT[/C][C]P-value[/C][/ROW]
[ROW][C]1[/C][C]0.933437[/C][C]7.9205[/C][C]0[/C][/ROW]
[ROW][C]2[/C][C]0.850505[/C][C]7.2168[/C][C]0[/C][/ROW]
[ROW][C]3[/C][C]0.7651[/C][C]6.4921[/C][C]0[/C][/ROW]
[ROW][C]4[/C][C]0.692783[/C][C]5.8785[/C][C]0[/C][/ROW]
[ROW][C]5[/C][C]0.613478[/C][C]5.2055[/C][C]1e-06[/C][/ROW]
[ROW][C]6[/C][C]0.532113[/C][C]4.5151[/C][C]1.2e-05[/C][/ROW]
[ROW][C]7[/C][C]0.461217[/C][C]3.9136[/C][C]0.000102[/C][/ROW]
[ROW][C]8[/C][C]0.417548[/C][C]3.543[/C][C]0.000349[/C][/ROW]
[ROW][C]9[/C][C]0.372126[/C][C]3.1576[/C][C]0.001162[/C][/ROW]
[ROW][C]10[/C][C]0.319808[/C][C]2.7137[/C][C]0.00416[/C][/ROW]
[ROW][C]11[/C][C]0.26313[/C][C]2.2327[/C][C]0.014338[/C][/ROW]
[ROW][C]12[/C][C]0.211898[/C][C]1.798[/C][C]0.038184[/C][/ROW]
[ROW][C]13[/C][C]0.173041[/C][C]1.4683[/C][C]0.073189[/C][/ROW]
[ROW][C]14[/C][C]0.137342[/C][C]1.1654[/C][C]0.123854[/C][/ROW]
[ROW][C]15[/C][C]0.111044[/C][C]0.9422[/C][C]0.174611[/C][/ROW]
[ROW][C]16[/C][C]0.094579[/C][C]0.8025[/C][C]0.212443[/C][/ROW]
[ROW][C]17[/C][C]0.080735[/C][C]0.6851[/C][C]0.247752[/C][/ROW]
[ROW][C]18[/C][C]0.060768[/C][C]0.5156[/C][C]0.303844[/C][/ROW]
[ROW][C]19[/C][C]0.035364[/C][C]0.3001[/C][C]0.382493[/C][/ROW]
[ROW][C]20[/C][C]0.007071[/C][C]0.06[/C][C]0.47616[/C][/ROW]
[ROW][C]21[/C][C]-0.016938[/C][C]-0.1437[/C][C]0.443059[/C][/ROW]
[ROW][C]22[/C][C]-0.036433[/C][C]-0.3091[/C][C]0.379054[/C][/ROW]
[ROW][C]23[/C][C]-0.057913[/C][C]-0.4914[/C][C]0.312315[/C][/ROW]
[ROW][C]24[/C][C]-0.079207[/C][C]-0.6721[/C][C]0.251836[/C][/ROW]
[ROW][C]25[/C][C]-0.093727[/C][C]-0.7953[/C][C]0.214526[/C][/ROW]
[ROW][C]26[/C][C]-0.090717[/C][C]-0.7698[/C][C]0.221981[/C][/ROW]
[ROW][C]27[/C][C]-0.077146[/C][C]-0.6546[/C][C]0.257403[/C][/ROW]
[ROW][C]28[/C][C]-0.070149[/C][C]-0.5952[/C][C]0.276778[/C][/ROW]
[ROW][C]29[/C][C]-0.061427[/C][C]-0.5212[/C][C]0.301904[/C][/ROW]
[ROW][C]30[/C][C]-0.035022[/C][C]-0.2972[/C][C]0.383596[/C][/ROW]
[ROW][C]31[/C][C]-0.009457[/C][C]-0.0802[/C][C]0.468133[/C][/ROW]
[ROW][C]32[/C][C]0.008284[/C][C]0.0703[/C][C]0.472078[/C][/ROW]
[ROW][C]33[/C][C]0.01504[/C][C]0.1276[/C][C]0.449402[/C][/ROW]
[ROW][C]34[/C][C]0.029186[/C][C]0.2476[/C][C]0.402556[/C][/ROW]
[ROW][C]35[/C][C]0.048143[/C][C]0.4085[/C][C]0.342057[/C][/ROW]
[ROW][C]36[/C][C]0.056753[/C][C]0.4816[/C][C]0.315789[/C][/ROW]
[ROW][C]37[/C][C]0.053112[/C][C]0.4507[/C][C]0.326791[/C][/ROW]
[ROW][C]38[/C][C]0.045273[/C][C]0.3842[/C][C]0.350998[/C][/ROW]
[ROW][C]39[/C][C]0.03652[/C][C]0.3099[/C][C]0.378772[/C][/ROW]
[ROW][C]40[/C][C]0.023173[/C][C]0.1966[/C][C]0.422335[/C][/ROW]
[ROW][C]41[/C][C]-0.009615[/C][C]-0.0816[/C][C]0.467603[/C][/ROW]
[ROW][C]42[/C][C]-0.045744[/C][C]-0.3882[/C][C]0.349524[/C][/ROW]
[ROW][C]43[/C][C]-0.081696[/C][C]-0.6932[/C][C]0.245203[/C][/ROW]
[ROW][C]44[/C][C]-0.107269[/C][C]-0.9102[/C][C]0.182875[/C][/ROW]
[ROW][C]45[/C][C]-0.13396[/C][C]-1.1367[/C][C]0.129718[/C][/ROW]
[ROW][C]46[/C][C]-0.16327[/C][C]-1.3854[/C][C]0.085105[/C][/ROW]
[ROW][C]47[/C][C]-0.185015[/C][C]-1.5699[/C][C]0.060411[/C][/ROW]
[ROW][C]48[/C][C]-0.203848[/C][C]-1.7297[/C][C]0.043984[/C][/ROW]
[/TABLE]
Source: https://freestatistics.org/blog/index.php?pk=32413&T=1

Globally Unique Identifier (entire table): ba.freestatistics.org/blog/index.php?pk=32413&T=1

As an alternative you can also use a QR Code:  

The GUIDs for individual cells are displayed in the table below:

Autocorrelation Function
Time lag kACF(k)T-STATP-value
10.9334377.92050
20.8505057.21680
30.76516.49210
40.6927835.87850
50.6134785.20551e-06
60.5321134.51511.2e-05
70.4612173.91360.000102
80.4175483.5430.000349
90.3721263.15760.001162
100.3198082.71370.00416
110.263132.23270.014338
120.2118981.7980.038184
130.1730411.46830.073189
140.1373421.16540.123854
150.1110440.94220.174611
160.0945790.80250.212443
170.0807350.68510.247752
180.0607680.51560.303844
190.0353640.30010.382493
200.0070710.060.47616
21-0.016938-0.14370.443059
22-0.036433-0.30910.379054
23-0.057913-0.49140.312315
24-0.079207-0.67210.251836
25-0.093727-0.79530.214526
26-0.090717-0.76980.221981
27-0.077146-0.65460.257403
28-0.070149-0.59520.276778
29-0.061427-0.52120.301904
30-0.035022-0.29720.383596
31-0.009457-0.08020.468133
320.0082840.07030.472078
330.015040.12760.449402
340.0291860.24760.402556
350.0481430.40850.342057
360.0567530.48160.315789
370.0531120.45070.326791
380.0452730.38420.350998
390.036520.30990.378772
400.0231730.19660.422335
41-0.009615-0.08160.467603
42-0.045744-0.38820.349524
43-0.081696-0.69320.245203
44-0.107269-0.91020.182875
45-0.13396-1.13670.129718
46-0.16327-1.38540.085105
47-0.185015-1.56990.060411
48-0.203848-1.72970.043984


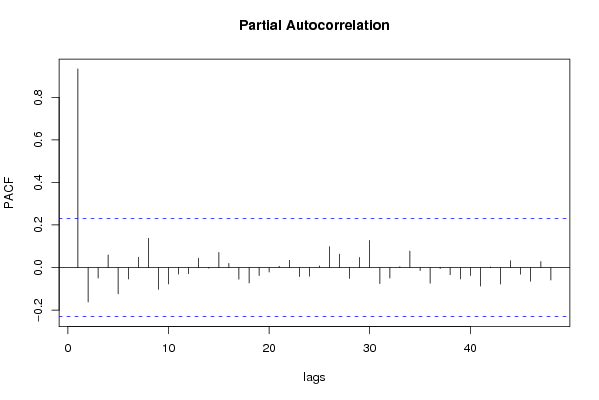
Partial Autocorrelation Function
Time lag kPACF(k)T-STATP-value
10.9334377.92050
2-0.161627-1.37140.087247
3-0.049774-0.42240.337014
40.0588580.49940.309501
5-0.123423-1.04730.149237
6-0.053448-0.45350.325769
70.0487670.41380.340125
80.1375361.1670.123524
9-0.102455-0.86940.19377
10-0.077146-0.65460.257405
11-0.030951-0.26260.396792
12-0.028823-0.24460.403741
130.0436030.370.35624
14-0.002901-0.02460.490215
150.0710210.60260.274324
160.0194450.1650.434705
17-0.054781-0.46480.321726
18-0.072734-0.61720.269536
19-0.037922-0.32180.374276
20-0.021626-0.18350.427459
210.0060280.05110.479675
220.0337170.28610.387811
23-0.042382-0.35960.36009
24-0.041037-0.34820.36435
250.0072270.06130.475636
260.0981110.83250.203939
270.0629910.53450.297324
28-0.051409-0.43620.331993
290.0475310.40330.343956
300.1274071.08110.141633
31-0.075491-0.64060.26192
32-0.049808-0.42260.336911
330.0041620.03530.485963
340.0770750.6540.257597
35-0.014184-0.12040.452269
36-0.073845-0.62660.266453
37-0.004926-0.04180.483389
38-0.033834-0.28710.387435
39-0.053861-0.4570.324513
40-0.037632-0.31930.375207
41-0.087267-0.74050.230706
420.0024820.02110.491628
43-0.077255-0.65550.257107
440.0318270.27010.393943
45-0.031672-0.26870.394448
46-0.064354-0.54610.293354
470.0282450.23970.405635
48-0.058898-0.49980.309382

\begin{tabular}{lllllllll}
\hline
Partial Autocorrelation Function \tabularnewline
Time lag k & PACF(k) & T-STAT & P-value \tabularnewline
1 & 0.933437 & 7.9205 & 0 \tabularnewline
2 & -0.161627 & -1.3714 & 0.087247 \tabularnewline
3 & -0.049774 & -0.4224 & 0.337014 \tabularnewline
4 & 0.058858 & 0.4994 & 0.309501 \tabularnewline
5 & -0.123423 & -1.0473 & 0.149237 \tabularnewline
6 & -0.053448 & -0.4535 & 0.325769 \tabularnewline
7 & 0.048767 & 0.4138 & 0.340125 \tabularnewline
8 & 0.137536 & 1.167 & 0.123524 \tabularnewline
9 & -0.102455 & -0.8694 & 0.19377 \tabularnewline
10 & -0.077146 & -0.6546 & 0.257405 \tabularnewline
11 & -0.030951 & -0.2626 & 0.396792 \tabularnewline
12 & -0.028823 & -0.2446 & 0.403741 \tabularnewline
13 & 0.043603 & 0.37 & 0.35624 \tabularnewline
14 & -0.002901 & -0.0246 & 0.490215 \tabularnewline
15 & 0.071021 & 0.6026 & 0.274324 \tabularnewline
16 & 0.019445 & 0.165 & 0.434705 \tabularnewline
17 & -0.054781 & -0.4648 & 0.321726 \tabularnewline
18 & -0.072734 & -0.6172 & 0.269536 \tabularnewline
19 & -0.037922 & -0.3218 & 0.374276 \tabularnewline
20 & -0.021626 & -0.1835 & 0.427459 \tabularnewline
21 & 0.006028 & 0.0511 & 0.479675 \tabularnewline
22 & 0.033717 & 0.2861 & 0.387811 \tabularnewline
23 & -0.042382 & -0.3596 & 0.36009 \tabularnewline
24 & -0.041037 & -0.3482 & 0.36435 \tabularnewline
25 & 0.007227 & 0.0613 & 0.475636 \tabularnewline
26 & 0.098111 & 0.8325 & 0.203939 \tabularnewline
27 & 0.062991 & 0.5345 & 0.297324 \tabularnewline
28 & -0.051409 & -0.4362 & 0.331993 \tabularnewline
29 & 0.047531 & 0.4033 & 0.343956 \tabularnewline
30 & 0.127407 & 1.0811 & 0.141633 \tabularnewline
31 & -0.075491 & -0.6406 & 0.26192 \tabularnewline
32 & -0.049808 & -0.4226 & 0.336911 \tabularnewline
33 & 0.004162 & 0.0353 & 0.485963 \tabularnewline
34 & 0.077075 & 0.654 & 0.257597 \tabularnewline
35 & -0.014184 & -0.1204 & 0.452269 \tabularnewline
36 & -0.073845 & -0.6266 & 0.266453 \tabularnewline
37 & -0.004926 & -0.0418 & 0.483389 \tabularnewline
38 & -0.033834 & -0.2871 & 0.387435 \tabularnewline
39 & -0.053861 & -0.457 & 0.324513 \tabularnewline
40 & -0.037632 & -0.3193 & 0.375207 \tabularnewline
41 & -0.087267 & -0.7405 & 0.230706 \tabularnewline
42 & 0.002482 & 0.0211 & 0.491628 \tabularnewline
43 & -0.077255 & -0.6555 & 0.257107 \tabularnewline
44 & 0.031827 & 0.2701 & 0.393943 \tabularnewline
45 & -0.031672 & -0.2687 & 0.394448 \tabularnewline
46 & -0.064354 & -0.5461 & 0.293354 \tabularnewline
47 & 0.028245 & 0.2397 & 0.405635 \tabularnewline
48 & -0.058898 & -0.4998 & 0.309382 \tabularnewline
\hline
\end{tabular}
%Source: https://freestatistics.org/blog/index.php?pk=32413&T=2

[TABLE]
[ROW][C]Partial Autocorrelation Function[/C][/ROW]
[ROW][C]Time lag k[/C][C]PACF(k)[/C][C]T-STAT[/C][C]P-value[/C][/ROW]
[ROW][C]1[/C][C]0.933437[/C][C]7.9205[/C][C]0[/C][/ROW]
[ROW][C]2[/C][C]-0.161627[/C][C]-1.3714[/C][C]0.087247[/C][/ROW]
[ROW][C]3[/C][C]-0.049774[/C][C]-0.4224[/C][C]0.337014[/C][/ROW]
[ROW][C]4[/C][C]0.058858[/C][C]0.4994[/C][C]0.309501[/C][/ROW]
[ROW][C]5[/C][C]-0.123423[/C][C]-1.0473[/C][C]0.149237[/C][/ROW]
[ROW][C]6[/C][C]-0.053448[/C][C]-0.4535[/C][C]0.325769[/C][/ROW]
[ROW][C]7[/C][C]0.048767[/C][C]0.4138[/C][C]0.340125[/C][/ROW]
[ROW][C]8[/C][C]0.137536[/C][C]1.167[/C][C]0.123524[/C][/ROW]
[ROW][C]9[/C][C]-0.102455[/C][C]-0.8694[/C][C]0.19377[/C][/ROW]
[ROW][C]10[/C][C]-0.077146[/C][C]-0.6546[/C][C]0.257405[/C][/ROW]
[ROW][C]11[/C][C]-0.030951[/C][C]-0.2626[/C][C]0.396792[/C][/ROW]
[ROW][C]12[/C][C]-0.028823[/C][C]-0.2446[/C][C]0.403741[/C][/ROW]
[ROW][C]13[/C][C]0.043603[/C][C]0.37[/C][C]0.35624[/C][/ROW]
[ROW][C]14[/C][C]-0.002901[/C][C]-0.0246[/C][C]0.490215[/C][/ROW]
[ROW][C]15[/C][C]0.071021[/C][C]0.6026[/C][C]0.274324[/C][/ROW]
[ROW][C]16[/C][C]0.019445[/C][C]0.165[/C][C]0.434705[/C][/ROW]
[ROW][C]17[/C][C]-0.054781[/C][C]-0.4648[/C][C]0.321726[/C][/ROW]
[ROW][C]18[/C][C]-0.072734[/C][C]-0.6172[/C][C]0.269536[/C][/ROW]
[ROW][C]19[/C][C]-0.037922[/C][C]-0.3218[/C][C]0.374276[/C][/ROW]
[ROW][C]20[/C][C]-0.021626[/C][C]-0.1835[/C][C]0.427459[/C][/ROW]
[ROW][C]21[/C][C]0.006028[/C][C]0.0511[/C][C]0.479675[/C][/ROW]
[ROW][C]22[/C][C]0.033717[/C][C]0.2861[/C][C]0.387811[/C][/ROW]
[ROW][C]23[/C][C]-0.042382[/C][C]-0.3596[/C][C]0.36009[/C][/ROW]
[ROW][C]24[/C][C]-0.041037[/C][C]-0.3482[/C][C]0.36435[/C][/ROW]
[ROW][C]25[/C][C]0.007227[/C][C]0.0613[/C][C]0.475636[/C][/ROW]
[ROW][C]26[/C][C]0.098111[/C][C]0.8325[/C][C]0.203939[/C][/ROW]
[ROW][C]27[/C][C]0.062991[/C][C]0.5345[/C][C]0.297324[/C][/ROW]
[ROW][C]28[/C][C]-0.051409[/C][C]-0.4362[/C][C]0.331993[/C][/ROW]
[ROW][C]29[/C][C]0.047531[/C][C]0.4033[/C][C]0.343956[/C][/ROW]
[ROW][C]30[/C][C]0.127407[/C][C]1.0811[/C][C]0.141633[/C][/ROW]
[ROW][C]31[/C][C]-0.075491[/C][C]-0.6406[/C][C]0.26192[/C][/ROW]
[ROW][C]32[/C][C]-0.049808[/C][C]-0.4226[/C][C]0.336911[/C][/ROW]
[ROW][C]33[/C][C]0.004162[/C][C]0.0353[/C][C]0.485963[/C][/ROW]
[ROW][C]34[/C][C]0.077075[/C][C]0.654[/C][C]0.257597[/C][/ROW]
[ROW][C]35[/C][C]-0.014184[/C][C]-0.1204[/C][C]0.452269[/C][/ROW]
[ROW][C]36[/C][C]-0.073845[/C][C]-0.6266[/C][C]0.266453[/C][/ROW]
[ROW][C]37[/C][C]-0.004926[/C][C]-0.0418[/C][C]0.483389[/C][/ROW]
[ROW][C]38[/C][C]-0.033834[/C][C]-0.2871[/C][C]0.387435[/C][/ROW]
[ROW][C]39[/C][C]-0.053861[/C][C]-0.457[/C][C]0.324513[/C][/ROW]
[ROW][C]40[/C][C]-0.037632[/C][C]-0.3193[/C][C]0.375207[/C][/ROW]
[ROW][C]41[/C][C]-0.087267[/C][C]-0.7405[/C][C]0.230706[/C][/ROW]
[ROW][C]42[/C][C]0.002482[/C][C]0.0211[/C][C]0.491628[/C][/ROW]
[ROW][C]43[/C][C]-0.077255[/C][C]-0.6555[/C][C]0.257107[/C][/ROW]
[ROW][C]44[/C][C]0.031827[/C][C]0.2701[/C][C]0.393943[/C][/ROW]
[ROW][C]45[/C][C]-0.031672[/C][C]-0.2687[/C][C]0.394448[/C][/ROW]
[ROW][C]46[/C][C]-0.064354[/C][C]-0.5461[/C][C]0.293354[/C][/ROW]
[ROW][C]47[/C][C]0.028245[/C][C]0.2397[/C][C]0.405635[/C][/ROW]
[ROW][C]48[/C][C]-0.058898[/C][C]-0.4998[/C][C]0.309382[/C][/ROW]
[/TABLE]
Source: https://freestatistics.org/blog/index.php?pk=32413&T=2

Globally Unique Identifier (entire table): ba.freestatistics.org/blog/index.php?pk=32413&T=2

As an alternative you can also use a QR Code:  

The GUIDs for individual cells are displayed in the table below:

Partial Autocorrelation Function
Time lag kPACF(k)T-STATP-value
10.9334377.92050
2-0.161627-1.37140.087247
3-0.049774-0.42240.337014
40.0588580.49940.309501
5-0.123423-1.04730.149237
6-0.053448-0.45350.325769
70.0487670.41380.340125
80.1375361.1670.123524
9-0.102455-0.86940.19377
10-0.077146-0.65460.257405
11-0.030951-0.26260.396792
12-0.028823-0.24460.403741
130.0436030.370.35624
14-0.002901-0.02460.490215
150.0710210.60260.274324
160.0194450.1650.434705
17-0.054781-0.46480.321726
18-0.072734-0.61720.269536
19-0.037922-0.32180.374276
20-0.021626-0.18350.427459
210.0060280.05110.479675
220.0337170.28610.387811
23-0.042382-0.35960.36009
24-0.041037-0.34820.36435
250.0072270.06130.475636
260.0981110.83250.203939
270.0629910.53450.297324
28-0.051409-0.43620.331993
290.0475310.40330.343956
300.1274071.08110.141633
31-0.075491-0.64060.26192
32-0.049808-0.42260.336911
330.0041620.03530.485963
340.0770750.6540.257597
35-0.014184-0.12040.452269
36-0.073845-0.62660.266453
37-0.004926-0.04180.483389
38-0.033834-0.28710.387435
39-0.053861-0.4570.324513
40-0.037632-0.31930.375207
41-0.087267-0.74050.230706
420.0024820.02110.491628
43-0.077255-0.65550.257107
440.0318270.27010.393943
45-0.031672-0.26870.394448
46-0.064354-0.54610.293354
470.0282450.23970.405635
48-0.058898-0.49980.309382


Parameters (Session):
par1 = 48 ; par2 = 1 ; par3 = 0 ; par4 = 0 ; par5 = 12 ;
Parameters (R input):
par1 = 48 ; par2 = 1 ; par3 = 0 ; par4 = 0 ; par5 = 12 ;
R code (references can be found in the software module):
if (par1 == 'Default') {
par1 = 10*log10(length(x))
} else {
par1 <- as.numeric(par1)
}
par2 <- as.numeric(par2)
par3 <- as.numeric(par3)
par4 <- as.numeric(par4)
par5 <- as.numeric(par5)
if (par2 == 0) {
x <- log(x)
} else {
x <- (x ^ par2 - 1) / par2
}
if (par3 > 0) x <- diff(x,lag=1,difference=par3)
if (par4 > 0) x <- diff(x,lag=par5,difference=par4)
bitmap(file='pic1.png')
racf <- acf(x,par1,main='Autocorrelation',xlab='lags',ylab='ACF')
dev.off()
bitmap(file='pic2.png')
rpacf <- pacf(x,par1,main='Partial Autocorrelation',xlab='lags',ylab='PACF')
dev.off()
(myacf <- c(racf$acf))
(mypacf <- c(rpacf$acf))
lengthx <- length(x)
sqrtn <- sqrt(lengthx)
load(file='createtable')
a<-table.start()
a<-table.row.start(a)
a<-table.element(a,'Autocorrelation Function',4,TRUE)
a<-table.row.end(a)
a<-table.row.start(a)
a<-table.element(a,'Time lag k',header=TRUE)
a<-table.element(a,hyperlink('basics.htm','ACF(k)','click here for more information about the Autocorrelation Function'),header=TRUE)
a<-table.element(a,'T-STAT',header=TRUE)
a<-table.element(a,'P-value',header=TRUE)
a<-table.row.end(a)
for (i in 2:(par1+1)) {
a<-table.row.start(a)
a<-table.element(a,i-1,header=TRUE)
a<-table.element(a,round(myacf[i],6))
mytstat <- myacf[i]*sqrtn
a<-table.element(a,round(mytstat,4))
a<-table.element(a,round(1-pt(abs(mytstat),lengthx),6))
a<-table.row.end(a)
}
a<-table.end(a)
table.save(a,file='mytable.tab')
a<-table.start()
a<-table.row.start(a)
a<-table.element(a,'Partial Autocorrelation Function',4,TRUE)
a<-table.row.end(a)
a<-table.row.start(a)
a<-table.element(a,'Time lag k',header=TRUE)
a<-table.element(a,hyperlink('basics.htm','PACF(k)','click here for more information about the Partial Autocorrelation Function'),header=TRUE)
a<-table.element(a,'T-STAT',header=TRUE)
a<-table.element(a,'P-value',header=TRUE)
a<-table.row.end(a)
for (i in 1:par1) {
a<-table.row.start(a)
a<-table.element(a,i,header=TRUE)
a<-table.element(a,round(mypacf[i],6))
mytstat <- mypacf[i]*sqrtn
a<-table.element(a,round(mytstat,4))
a<-table.element(a,round(1-pt(abs(mytstat),lengthx),6))
a<-table.row.end(a)
}
a<-table.end(a)
table.save(a,file='mytable1.tab')