Free Statistics

of Irreproducible Research!

Author's title

Author*The author of this computation has been verified*
R Software Modulerwasp_arimabackwardselection.wasp
Title produced by softwareARIMA Backward Selection
Date of computationThu, 11 Dec 2008 09:11:26 -0700
Cite this page as followsStatistical Computations at FreeStatistics.org, Office for Research Development and Education, URL https://freestatistics.org/blog/index.php?v=date/2008/Dec/11/t122901193715d72aiegwee7gc.htm/, Retrieved Fri, 17 May 2024 01:41:03 +0000
Statistical Computations at FreeStatistics.org, Office for Research Development and Education, URL https://freestatistics.org/blog/index.php?pk=32328, Retrieved Fri, 17 May 2024 01:41:03 +0000
QR Codes:

Original text written by user:
IsPrivate?No (this computation is public)
User-defined keywords
Estimated Impact200
Family? (F = Feedback message, R = changed R code, M = changed R Module, P = changed Parameters, D = changed Data)
-     [Univariate Data Series] [Uitvoer.Nederland] [2008-12-03 15:11:10] [988ab43f527fc78aae41c84649095267]
-   P   [Univariate Data Series] [Export From Belgi...] [2008-12-03 15:52:29] [988ab43f527fc78aae41c84649095267]
- RMP     [Variance Reduction Matrix] [Variance Reductio...] [2008-12-03 15:56:08] [988ab43f527fc78aae41c84649095267]
- RMP       [(Partial) Autocorrelation Function] [Partial Autocorre...] [2008-12-03 16:40:39] [988ab43f527fc78aae41c84649095267]
- RMP         [ARIMA Backward Selection] [ARMA backward sel...] [2008-12-11 15:57:30] [988ab43f527fc78aae41c84649095267]
-   P             [ARIMA Backward Selection] [ARMA backward sel...] [2008-12-11 16:11:26] [5d823194959040fa9b19b8c8302177e6] [Current]
-   PD              [ARIMA Backward Selection] [ARMA backward sel...] [2008-12-11 17:31:33] [988ab43f527fc78aae41c84649095267]
-   PD                [ARIMA Backward Selection] [ARMA backward sel...] [2008-12-12 19:07:08] [988ab43f527fc78aae41c84649095267]
-   PD                [ARIMA Backward Selection] [ARMA backward sel...] [2008-12-12 19:09:17] [988ab43f527fc78aae41c84649095267]
Feedback Forum

Post a new message
Dataseries X:
2236
2084.9
2409.5
2199.3
2203.5
2254.1
1975.8
1742.2
2520.6
2438.1
2126.3
2267.5
2201.1
2128.5
2596
2458.2
2210.5
2621.2
2231.4
2103.6
2685.8
2539.3
2462.4
2693.3
2307.7
2385.9
2737.6
2653.9
2545.4
2848.8
2359.5
2488.3
2861.1
2717.9
2844
2749
2652.9
2660.2
3187.1
2774.1
3158.2
3244.6
2665.5
2820.8
2983.4
3077.4
3024.8
2731.8
3046.2
2834.8
3292.8
2946.1
3196.9
3284.2
3003
2979
3137.4
3630.2
3270.7
2942.3


Summary of computational transaction
Raw Inputview raw input (R code)
Raw Outputview raw output of R engine
Computing time3 seconds
R Server'George Udny Yule' @ 72.249.76.132

\begin{tabular}{lllllllll}
\hline
Summary of computational transaction \tabularnewline
Raw Input & view raw input (R code)  \tabularnewline
Raw Output & view raw output of R engine  \tabularnewline
Computing time & 3 seconds \tabularnewline
R Server & 'George Udny Yule' @ 72.249.76.132 \tabularnewline
\hline
\end{tabular}
%Source: https://freestatistics.org/blog/index.php?pk=32328&T=0

[TABLE]
[ROW][C]Summary of computational transaction[/C][/ROW]
[ROW][C]Raw Input[/C][C]view raw input (R code) [/C][/ROW]
[ROW][C]Raw Output[/C][C]view raw output of R engine [/C][/ROW]
[ROW][C]Computing time[/C][C]3 seconds[/C][/ROW]
[ROW][C]R Server[/C][C]'George Udny Yule' @ 72.249.76.132[/C][/ROW]
[/TABLE]
Source: https://freestatistics.org/blog/index.php?pk=32328&T=0

Globally Unique Identifier (entire table): ba.freestatistics.org/blog/index.php?pk=32328&T=0

As an alternative you can also use a QR Code:  

The GUIDs for individual cells are displayed in the table below:

Summary of computational transaction
Raw Inputview raw input (R code)
Raw Outputview raw output of R engine
Computing time3 seconds
R Server'George Udny Yule' @ 72.249.76.132


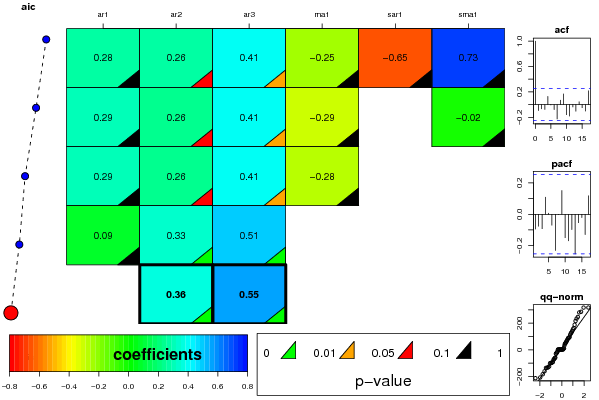
ARIMA Parameter Estimation and Backward Selection
Iterationar1ar2ar3ma1sar1sma1
Estimates ( 1 )0.28140.25750.4054-0.2454-0.64550.7257
(p-val)(0.2907 )(0.0872 )(0.0354 )(0.4169 )(0.5969 )(0.5501 )
Estimates ( 2 )0.29170.25530.4083-0.2890-0.0239
(p-val)(0.2471 )(0.0838 )(0.0345 )(0.2974 )(NA )(0.927 )
Estimates ( 3 )0.2920.25510.4059-0.283600
(p-val)(0.2494 )(0.0846 )(0.0335 )(0.2985 )(NA )(NA )
Estimates ( 4 )0.08620.32730.5064000
(p-val)(0.4926 )(0.0057 )(2e-04 )(NA )(NA )(NA )
Estimates ( 5 )00.35950.5538000
(p-val)(NA )(0.0011 )(0 )(NA )(NA )(NA )
Estimates ( 6 )NANANANANANA
(p-val)(NA )(NA )(NA )(NA )(NA )(NA )
Estimates ( 7 )NANANANANANA
(p-val)(NA )(NA )(NA )(NA )(NA )(NA )
Estimates ( 8 )NANANANANANA
(p-val)(NA )(NA )(NA )(NA )(NA )(NA )
Estimates ( 9 )NANANANANANA
(p-val)(NA )(NA )(NA )(NA )(NA )(NA )
Estimates ( 10 )NANANANANANA
(p-val)(NA )(NA )(NA )(NA )(NA )(NA )
Estimates ( 11 )NANANANANANA
(p-val)(NA )(NA )(NA )(NA )(NA )(NA )

\begin{tabular}{lllllllll}
\hline
ARIMA Parameter Estimation and Backward Selection \tabularnewline
Iteration & ar1 & ar2 & ar3 & ma1 & sar1 & sma1 \tabularnewline
Estimates ( 1 ) & 0.2814 & 0.2575 & 0.4054 & -0.2454 & -0.6455 & 0.7257 \tabularnewline
(p-val) & (0.2907 ) & (0.0872 ) & (0.0354 ) & (0.4169 ) & (0.5969 ) & (0.5501 ) \tabularnewline
Estimates ( 2 ) & 0.2917 & 0.2553 & 0.4083 & -0.289 & 0 & -0.0239 \tabularnewline
(p-val) & (0.2471 ) & (0.0838 ) & (0.0345 ) & (0.2974 ) & (NA ) & (0.927 ) \tabularnewline
Estimates ( 3 ) & 0.292 & 0.2551 & 0.4059 & -0.2836 & 0 & 0 \tabularnewline
(p-val) & (0.2494 ) & (0.0846 ) & (0.0335 ) & (0.2985 ) & (NA ) & (NA ) \tabularnewline
Estimates ( 4 ) & 0.0862 & 0.3273 & 0.5064 & 0 & 0 & 0 \tabularnewline
(p-val) & (0.4926 ) & (0.0057 ) & (2e-04 ) & (NA ) & (NA ) & (NA ) \tabularnewline
Estimates ( 5 ) & 0 & 0.3595 & 0.5538 & 0 & 0 & 0 \tabularnewline
(p-val) & (NA ) & (0.0011 ) & (0 ) & (NA ) & (NA ) & (NA ) \tabularnewline
Estimates ( 6 ) & NA & NA & NA & NA & NA & NA \tabularnewline
(p-val) & (NA ) & (NA ) & (NA ) & (NA ) & (NA ) & (NA ) \tabularnewline
Estimates ( 7 ) & NA & NA & NA & NA & NA & NA \tabularnewline
(p-val) & (NA ) & (NA ) & (NA ) & (NA ) & (NA ) & (NA ) \tabularnewline
Estimates ( 8 ) & NA & NA & NA & NA & NA & NA \tabularnewline
(p-val) & (NA ) & (NA ) & (NA ) & (NA ) & (NA ) & (NA ) \tabularnewline
Estimates ( 9 ) & NA & NA & NA & NA & NA & NA \tabularnewline
(p-val) & (NA ) & (NA ) & (NA ) & (NA ) & (NA ) & (NA ) \tabularnewline
Estimates ( 10 ) & NA & NA & NA & NA & NA & NA \tabularnewline
(p-val) & (NA ) & (NA ) & (NA ) & (NA ) & (NA ) & (NA ) \tabularnewline
Estimates ( 11 ) & NA & NA & NA & NA & NA & NA \tabularnewline
(p-val) & (NA ) & (NA ) & (NA ) & (NA ) & (NA ) & (NA ) \tabularnewline
\hline
\end{tabular}
%Source: https://freestatistics.org/blog/index.php?pk=32328&T=1

[TABLE]
[ROW][C]ARIMA Parameter Estimation and Backward Selection[/C][/ROW]
[ROW][C]Iteration[/C][C]ar1[/C][C]ar2[/C][C]ar3[/C][C]ma1[/C][C]sar1[/C][C]sma1[/C][/ROW]
[ROW][C]Estimates ( 1 )[/C][C]0.2814[/C][C]0.2575[/C][C]0.4054[/C][C]-0.2454[/C][C]-0.6455[/C][C]0.7257[/C][/ROW]
[ROW][C](p-val)[/C][C](0.2907 )[/C][C](0.0872 )[/C][C](0.0354 )[/C][C](0.4169 )[/C][C](0.5969 )[/C][C](0.5501 )[/C][/ROW]
[ROW][C]Estimates ( 2 )[/C][C]0.2917[/C][C]0.2553[/C][C]0.4083[/C][C]-0.289[/C][C]0[/C][C]-0.0239[/C][/ROW]
[ROW][C](p-val)[/C][C](0.2471 )[/C][C](0.0838 )[/C][C](0.0345 )[/C][C](0.2974 )[/C][C](NA )[/C][C](0.927 )[/C][/ROW]
[ROW][C]Estimates ( 3 )[/C][C]0.292[/C][C]0.2551[/C][C]0.4059[/C][C]-0.2836[/C][C]0[/C][C]0[/C][/ROW]
[ROW][C](p-val)[/C][C](0.2494 )[/C][C](0.0846 )[/C][C](0.0335 )[/C][C](0.2985 )[/C][C](NA )[/C][C](NA )[/C][/ROW]
[ROW][C]Estimates ( 4 )[/C][C]0.0862[/C][C]0.3273[/C][C]0.5064[/C][C]0[/C][C]0[/C][C]0[/C][/ROW]
[ROW][C](p-val)[/C][C](0.4926 )[/C][C](0.0057 )[/C][C](2e-04 )[/C][C](NA )[/C][C](NA )[/C][C](NA )[/C][/ROW]
[ROW][C]Estimates ( 5 )[/C][C]0[/C][C]0.3595[/C][C]0.5538[/C][C]0[/C][C]0[/C][C]0[/C][/ROW]
[ROW][C](p-val)[/C][C](NA )[/C][C](0.0011 )[/C][C](0 )[/C][C](NA )[/C][C](NA )[/C][C](NA )[/C][/ROW]
[ROW][C]Estimates ( 6 )[/C][C]NA[/C][C]NA[/C][C]NA[/C][C]NA[/C][C]NA[/C][C]NA[/C][/ROW]
[ROW][C](p-val)[/C][C](NA )[/C][C](NA )[/C][C](NA )[/C][C](NA )[/C][C](NA )[/C][C](NA )[/C][/ROW]
[ROW][C]Estimates ( 7 )[/C][C]NA[/C][C]NA[/C][C]NA[/C][C]NA[/C][C]NA[/C][C]NA[/C][/ROW]
[ROW][C](p-val)[/C][C](NA )[/C][C](NA )[/C][C](NA )[/C][C](NA )[/C][C](NA )[/C][C](NA )[/C][/ROW]
[ROW][C]Estimates ( 8 )[/C][C]NA[/C][C]NA[/C][C]NA[/C][C]NA[/C][C]NA[/C][C]NA[/C][/ROW]
[ROW][C](p-val)[/C][C](NA )[/C][C](NA )[/C][C](NA )[/C][C](NA )[/C][C](NA )[/C][C](NA )[/C][/ROW]
[ROW][C]Estimates ( 9 )[/C][C]NA[/C][C]NA[/C][C]NA[/C][C]NA[/C][C]NA[/C][C]NA[/C][/ROW]
[ROW][C](p-val)[/C][C](NA )[/C][C](NA )[/C][C](NA )[/C][C](NA )[/C][C](NA )[/C][C](NA )[/C][/ROW]
[ROW][C]Estimates ( 10 )[/C][C]NA[/C][C]NA[/C][C]NA[/C][C]NA[/C][C]NA[/C][C]NA[/C][/ROW]
[ROW][C](p-val)[/C][C](NA )[/C][C](NA )[/C][C](NA )[/C][C](NA )[/C][C](NA )[/C][C](NA )[/C][/ROW]
[ROW][C]Estimates ( 11 )[/C][C]NA[/C][C]NA[/C][C]NA[/C][C]NA[/C][C]NA[/C][C]NA[/C][/ROW]
[ROW][C](p-val)[/C][C](NA )[/C][C](NA )[/C][C](NA )[/C][C](NA )[/C][C](NA )[/C][C](NA )[/C][/ROW]
[/TABLE]
Source: https://freestatistics.org/blog/index.php?pk=32328&T=1

Globally Unique Identifier (entire table): ba.freestatistics.org/blog/index.php?pk=32328&T=1

As an alternative you can also use a QR Code:  

The GUIDs for individual cells are displayed in the table below:

ARIMA Parameter Estimation and Backward Selection
Iterationar1ar2ar3ma1sar1sma1
Estimates ( 1 )0.28140.25750.4054-0.2454-0.64550.7257
(p-val)(0.2907 )(0.0872 )(0.0354 )(0.4169 )(0.5969 )(0.5501 )
Estimates ( 2 )0.29170.25530.4083-0.2890-0.0239
(p-val)(0.2471 )(0.0838 )(0.0345 )(0.2974 )(NA )(0.927 )
Estimates ( 3 )0.2920.25510.4059-0.283600
(p-val)(0.2494 )(0.0846 )(0.0335 )(0.2985 )(NA )(NA )
Estimates ( 4 )0.08620.32730.5064000
(p-val)(0.4926 )(0.0057 )(2e-04 )(NA )(NA )(NA )
Estimates ( 5 )00.35950.5538000
(p-val)(NA )(0.0011 )(0 )(NA )(NA )(NA )
Estimates ( 6 )NANANANANANA
(p-val)(NA )(NA )(NA )(NA )(NA )(NA )
Estimates ( 7 )NANANANANANA
(p-val)(NA )(NA )(NA )(NA )(NA )(NA )
Estimates ( 8 )NANANANANANA
(p-val)(NA )(NA )(NA )(NA )(NA )(NA )
Estimates ( 9 )NANANANANANA
(p-val)(NA )(NA )(NA )(NA )(NA )(NA )
Estimates ( 10 )NANANANANANA
(p-val)(NA )(NA )(NA )(NA )(NA )(NA )
Estimates ( 11 )NANANANANANA
(p-val)(NA )(NA )(NA )(NA )(NA )(NA )


Estimated ARIMA Residuals
Value
2.26744428769327
-19.2434592389049
50.2050977601009
163.084233690106
246.235082744252
-98.4346121033896
187.298055712106
90.5628564463122
215.668730531505
-135.518844008273
-160.778839882955
90.276621741411
280.052406867658
-91.3544635488268
-61.3792392346085
-131.113925255356
45.2573820415537
141.330175611163
62.9746489369855
-100.244580673001
129.554056483021
-15.0421321628601
-27.3043968444154
114.001982949489
-124.418506998697
125.039125923928
33.0678156899357
284.662482770190
-183.139189747079
316.389396824240
76.0120136199921
10.4340294914618
-133.771417928051
-206.961591579273
85.1524731934146
-58.5983820315864
-212.392024003651
153.533216168779
54.7803347306949
-29.3729524029341
-93.4435744989145
-99.1430875835367
-73.5669851636376
234.312106204276
96.5607442374666
9.83933375261723
316.822967629571
67.7443430246208
-69.6289464497968

\begin{tabular}{lllllllll}
\hline
Estimated ARIMA Residuals \tabularnewline
Value \tabularnewline
2.26744428769327 \tabularnewline
-19.2434592389049 \tabularnewline
50.2050977601009 \tabularnewline
163.084233690106 \tabularnewline
246.235082744252 \tabularnewline
-98.4346121033896 \tabularnewline
187.298055712106 \tabularnewline
90.5628564463122 \tabularnewline
215.668730531505 \tabularnewline
-135.518844008273 \tabularnewline
-160.778839882955 \tabularnewline
90.276621741411 \tabularnewline
280.052406867658 \tabularnewline
-91.3544635488268 \tabularnewline
-61.3792392346085 \tabularnewline
-131.113925255356 \tabularnewline
45.2573820415537 \tabularnewline
141.330175611163 \tabularnewline
62.9746489369855 \tabularnewline
-100.244580673001 \tabularnewline
129.554056483021 \tabularnewline
-15.0421321628601 \tabularnewline
-27.3043968444154 \tabularnewline
114.001982949489 \tabularnewline
-124.418506998697 \tabularnewline
125.039125923928 \tabularnewline
33.0678156899357 \tabularnewline
284.662482770190 \tabularnewline
-183.139189747079 \tabularnewline
316.389396824240 \tabularnewline
76.0120136199921 \tabularnewline
10.4340294914618 \tabularnewline
-133.771417928051 \tabularnewline
-206.961591579273 \tabularnewline
85.1524731934146 \tabularnewline
-58.5983820315864 \tabularnewline
-212.392024003651 \tabularnewline
153.533216168779 \tabularnewline
54.7803347306949 \tabularnewline
-29.3729524029341 \tabularnewline
-93.4435744989145 \tabularnewline
-99.1430875835367 \tabularnewline
-73.5669851636376 \tabularnewline
234.312106204276 \tabularnewline
96.5607442374666 \tabularnewline
9.83933375261723 \tabularnewline
316.822967629571 \tabularnewline
67.7443430246208 \tabularnewline
-69.6289464497968 \tabularnewline
\hline
\end{tabular}
%Source: https://freestatistics.org/blog/index.php?pk=32328&T=2

[TABLE]
[ROW][C]Estimated ARIMA Residuals[/C][/ROW]
[ROW][C]Value[/C][/ROW]
[ROW][C]2.26744428769327[/C][/ROW]
[ROW][C]-19.2434592389049[/C][/ROW]
[ROW][C]50.2050977601009[/C][/ROW]
[ROW][C]163.084233690106[/C][/ROW]
[ROW][C]246.235082744252[/C][/ROW]
[ROW][C]-98.4346121033896[/C][/ROW]
[ROW][C]187.298055712106[/C][/ROW]
[ROW][C]90.5628564463122[/C][/ROW]
[ROW][C]215.668730531505[/C][/ROW]
[ROW][C]-135.518844008273[/C][/ROW]
[ROW][C]-160.778839882955[/C][/ROW]
[ROW][C]90.276621741411[/C][/ROW]
[ROW][C]280.052406867658[/C][/ROW]
[ROW][C]-91.3544635488268[/C][/ROW]
[ROW][C]-61.3792392346085[/C][/ROW]
[ROW][C]-131.113925255356[/C][/ROW]
[ROW][C]45.2573820415537[/C][/ROW]
[ROW][C]141.330175611163[/C][/ROW]
[ROW][C]62.9746489369855[/C][/ROW]
[ROW][C]-100.244580673001[/C][/ROW]
[ROW][C]129.554056483021[/C][/ROW]
[ROW][C]-15.0421321628601[/C][/ROW]
[ROW][C]-27.3043968444154[/C][/ROW]
[ROW][C]114.001982949489[/C][/ROW]
[ROW][C]-124.418506998697[/C][/ROW]
[ROW][C]125.039125923928[/C][/ROW]
[ROW][C]33.0678156899357[/C][/ROW]
[ROW][C]284.662482770190[/C][/ROW]
[ROW][C]-183.139189747079[/C][/ROW]
[ROW][C]316.389396824240[/C][/ROW]
[ROW][C]76.0120136199921[/C][/ROW]
[ROW][C]10.4340294914618[/C][/ROW]
[ROW][C]-133.771417928051[/C][/ROW]
[ROW][C]-206.961591579273[/C][/ROW]
[ROW][C]85.1524731934146[/C][/ROW]
[ROW][C]-58.5983820315864[/C][/ROW]
[ROW][C]-212.392024003651[/C][/ROW]
[ROW][C]153.533216168779[/C][/ROW]
[ROW][C]54.7803347306949[/C][/ROW]
[ROW][C]-29.3729524029341[/C][/ROW]
[ROW][C]-93.4435744989145[/C][/ROW]
[ROW][C]-99.1430875835367[/C][/ROW]
[ROW][C]-73.5669851636376[/C][/ROW]
[ROW][C]234.312106204276[/C][/ROW]
[ROW][C]96.5607442374666[/C][/ROW]
[ROW][C]9.83933375261723[/C][/ROW]
[ROW][C]316.822967629571[/C][/ROW]
[ROW][C]67.7443430246208[/C][/ROW]
[ROW][C]-69.6289464497968[/C][/ROW]
[/TABLE]
Source: https://freestatistics.org/blog/index.php?pk=32328&T=2

Globally Unique Identifier (entire table): ba.freestatistics.org/blog/index.php?pk=32328&T=2

As an alternative you can also use a QR Code:  

The GUIDs for individual cells are displayed in the table below:

Estimated ARIMA Residuals
Value
2.26744428769327
-19.2434592389049
50.2050977601009
163.084233690106
246.235082744252
-98.4346121033896
187.298055712106
90.5628564463122
215.668730531505
-135.518844008273
-160.778839882955
90.276621741411
280.052406867658
-91.3544635488268
-61.3792392346085
-131.113925255356
45.2573820415537
141.330175611163
62.9746489369855
-100.244580673001
129.554056483021
-15.0421321628601
-27.3043968444154
114.001982949489
-124.418506998697
125.039125923928
33.0678156899357
284.662482770190
-183.139189747079
316.389396824240
76.0120136199921
10.4340294914618
-133.771417928051
-206.961591579273
85.1524731934146
-58.5983820315864
-212.392024003651
153.533216168779
54.7803347306949
-29.3729524029341
-93.4435744989145
-99.1430875835367
-73.5669851636376
234.312106204276
96.5607442374666
9.83933375261723
316.822967629571
67.7443430246208
-69.6289464497968


Parameters (Session):
par1 = FALSE ; par2 = 1 ; par3 = 0 ; par4 = 1 ; par5 = 12 ; par6 = 3 ; par7 = 1 ; par8 = 1 ; par9 = 1 ;
Parameters (R input):
par1 = FALSE ; par2 = 1 ; par3 = 0 ; par4 = 1 ; par5 = 12 ; par6 = 3 ; par7 = 1 ; par8 = 1 ; par9 = 1 ;
R code (references can be found in the software module):
library(lattice)
if (par1 == 'TRUE') par1 <- TRUE
if (par1 == 'FALSE') par1 <- FALSE
par2 <- as.numeric(par2) #Box-Cox lambda transformation parameter
par3 <- as.numeric(par3) #degree of non-seasonal differencing
par4 <- as.numeric(par4) #degree of seasonal differencing
par5 <- as.numeric(par5) #seasonal period
par6 <- as.numeric(par6) #degree (p) of the non-seasonal AR(p) polynomial
par7 <- as.numeric(par7) #degree (q) of the non-seasonal MA(q) polynomial
par8 <- as.numeric(par8) #degree (P) of the seasonal AR(P) polynomial
par9 <- as.numeric(par9) #degree (Q) of the seasonal MA(Q) polynomial
armaGR <- function(arima.out, names, n){
try1 <- arima.out$coef
try2 <- sqrt(diag(arima.out$var.coef))
try.data.frame <- data.frame(matrix(NA,ncol=4,nrow=length(names)))
dimnames(try.data.frame) <- list(names,c('coef','std','tstat','pv'))
try.data.frame[,1] <- try1
for(i in 1:length(try2)) try.data.frame[which(rownames(try.data.frame)==names(try2)[i]),2] <- try2[i]
try.data.frame[,3] <- try.data.frame[,1] / try.data.frame[,2]
try.data.frame[,4] <- round((1-pt(abs(try.data.frame[,3]),df=n-(length(try2)+1)))*2,5)
vector <- rep(NA,length(names))
vector[is.na(try.data.frame[,4])] <- 0
maxi <- which.max(try.data.frame[,4])
continue <- max(try.data.frame[,4],na.rm=TRUE) > .05
vector[maxi] <- 0
list(summary=try.data.frame,next.vector=vector,continue=continue)
}
arimaSelect <- function(series, order=c(13,0,0), seasonal=list(order=c(2,0,0),period=12), include.mean=F){
nrc <- order[1]+order[3]+seasonal$order[1]+seasonal$order[3]
coeff <- matrix(NA, nrow=nrc*2, ncol=nrc)
pval <- matrix(NA, nrow=nrc*2, ncol=nrc)
mylist <- rep(list(NULL), nrc)
names <- NULL
if(order[1] > 0) names <- paste('ar',1:order[1],sep='')
if(order[3] > 0) names <- c( names , paste('ma',1:order[3],sep='') )
if(seasonal$order[1] > 0) names <- c(names, paste('sar',1:seasonal$order[1],sep=''))
if(seasonal$order[3] > 0) names <- c(names, paste('sma',1:seasonal$order[3],sep=''))
arima.out <- arima(series, order=order, seasonal=seasonal, include.mean=include.mean, method='ML')
mylist[[1]] <- arima.out
last.arma <- armaGR(arima.out, names, length(series))
mystop <- FALSE
i <- 1
coeff[i,] <- last.arma[[1]][,1]
pval [i,] <- last.arma[[1]][,4]
i <- 2
aic <- arima.out$aic
while(!mystop){
mylist[[i]] <- arima.out
arima.out <- arima(series, order=order, seasonal=seasonal, include.mean=include.mean, method='ML', fixed=last.arma$next.vector)
aic <- c(aic, arima.out$aic)
last.arma <- armaGR(arima.out, names, length(series))
mystop <- !last.arma$continue
coeff[i,] <- last.arma[[1]][,1]
pval [i,] <- last.arma[[1]][,4]
i <- i+1
}
list(coeff, pval, mylist, aic=aic)
}
arimaSelectplot <- function(arimaSelect.out,noms,choix){
noms <- names(arimaSelect.out[[3]][[1]]$coef)
coeff <- arimaSelect.out[[1]]
k <- min(which(is.na(coeff[,1])))-1
coeff <- coeff[1:k,]
pval <- arimaSelect.out[[2]][1:k,]
aic <- arimaSelect.out$aic[1:k]
coeff[coeff==0] <- NA
n <- ncol(coeff)
if(missing(choix)) choix <- k
layout(matrix(c(1,1,1,2,
3,3,3,2,
3,3,3,4,
5,6,7,7),nr=4),
widths=c(10,35,45,15),
heights=c(30,30,15,15))
couleurs <- rainbow(75)[1:50]#(50)
ticks <- pretty(coeff)
par(mar=c(1,1,3,1))
plot(aic,k:1-.5,type='o',pch=21,bg='blue',cex=2,axes=F,lty=2,xpd=NA)
points(aic[choix],k-choix+.5,pch=21,cex=4,bg=2,xpd=NA)
title('aic',line=2)
par(mar=c(3,0,0,0))
plot(0,axes=F,xlab='',ylab='',xlim=range(ticks),ylim=c(.1,1))
rect(xleft = min(ticks) + (0:49)/50*(max(ticks)-min(ticks)),
xright = min(ticks) + (1:50)/50*(max(ticks)-min(ticks)),
ytop = rep(1,50),
ybottom= rep(0,50),col=couleurs,border=NA)
axis(1,ticks)
rect(xleft=min(ticks),xright=max(ticks),ytop=1,ybottom=0)
text(mean(coeff,na.rm=T),.5,'coefficients',cex=2,font=2)
par(mar=c(1,1,3,1))
image(1:n,1:k,t(coeff[k:1,]),axes=F,col=couleurs,zlim=range(ticks))
for(i in 1:n) for(j in 1:k) if(!is.na(coeff[j,i])) {
if(pval[j,i]<.01) symb = 'green'
else if( (pval[j,i]<.05) & (pval[j,i]>=.01)) symb = 'orange'
else if( (pval[j,i]<.1) & (pval[j,i]>=.05)) symb = 'red'
else symb = 'black'
polygon(c(i+.5 ,i+.2 ,i+.5 ,i+.5),
c(k-j+0.5,k-j+0.5,k-j+0.8,k-j+0.5),
col=symb)
if(j==choix) {
rect(xleft=i-.5,
xright=i+.5,
ybottom=k-j+1.5,
ytop=k-j+.5,
lwd=4)
text(i,
k-j+1,
round(coeff[j,i],2),
cex=1.2,
font=2)
}
else{
rect(xleft=i-.5,xright=i+.5,ybottom=k-j+1.5,ytop=k-j+.5)
text(i,k-j+1,round(coeff[j,i],2),cex=1.2,font=1)
}
}
axis(3,1:n,noms)
par(mar=c(0.5,0,0,0.5))
plot(0,axes=F,xlab='',ylab='',type='n',xlim=c(0,8),ylim=c(-.2,.8))
cols <- c('green','orange','red','black')
niv <- c('0','0.01','0.05','0.1')
for(i in 0:3){
polygon(c(1+2*i ,1+2*i ,1+2*i-.5 ,1+2*i),
c(.4 ,.7 , .4 , .4),
col=cols[i+1])
text(2*i,0.5,niv[i+1],cex=1.5)
}
text(8,.5,1,cex=1.5)
text(4,0,'p-value',cex=2)
box()
residus <- arimaSelect.out[[3]][[choix]]$res
par(mar=c(1,2,4,1))
acf(residus,main='')
title('acf',line=.5)
par(mar=c(1,2,4,1))
pacf(residus,main='')
title('pacf',line=.5)
par(mar=c(2,2,4,1))
qqnorm(residus,main='')
title('qq-norm',line=.5)
qqline(residus)
residus
}
if (par2 == 0) x <- log(x)
if (par2 != 0) x <- x^par2
(selection <- arimaSelect(x, order=c(par6,par3,par7), seasonal=list(order=c(par8,par4,par9), period=par5)))
bitmap(file='test1.png')
resid <- arimaSelectplot(selection)
dev.off()
resid
bitmap(file='test2.png')
acf(resid,length(resid)/2, main='Residual Autocorrelation Function')
dev.off()
bitmap(file='test3.png')
pacf(resid,length(resid)/2, main='Residual Partial Autocorrelation Function')
dev.off()
bitmap(file='test4.png')
cpgram(resid, main='Residual Cumulative Periodogram')
dev.off()
bitmap(file='test5.png')
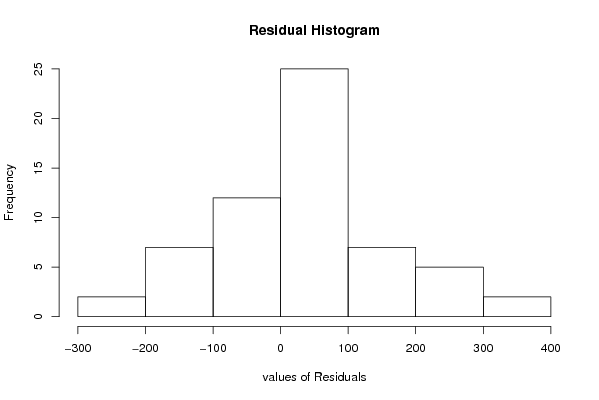
hist(resid, main='Residual Histogram', xlab='values of Residuals')
dev.off()
bitmap(file='test6.png')
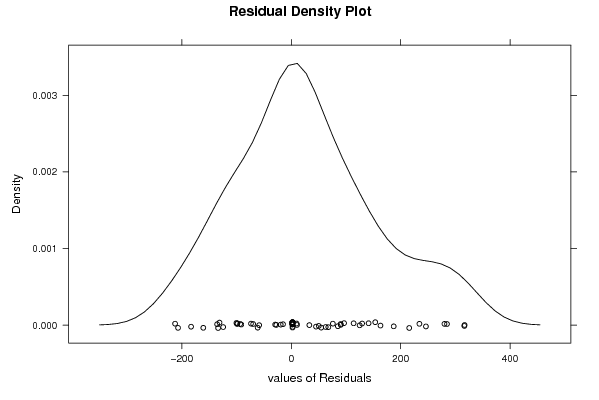
densityplot(~resid,col='black',main='Residual Density Plot', xlab='values of Residuals')
dev.off()
bitmap(file='test7.png')
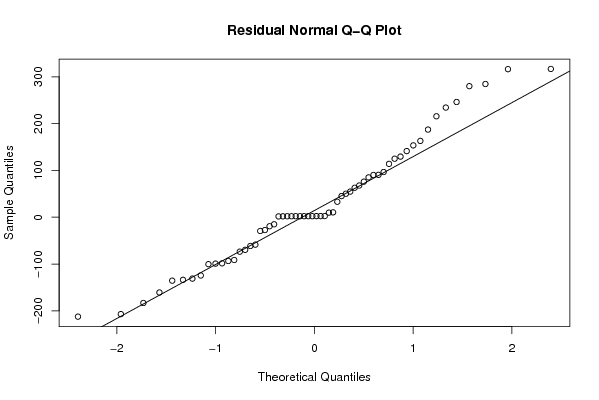
qqnorm(resid, main='Residual Normal Q-Q Plot')
qqline(resid)
dev.off()
ncols <- length(selection[[1]][1,])
nrows <- length(selection[[2]][,1])-1
load(file='createtable')
a<-table.start()
a<-table.row.start(a)
a<-table.element(a,'ARIMA Parameter Estimation and Backward Selection', ncols+1,TRUE)
a<-table.row.end(a)
a<-table.row.start(a)
a<-table.element(a,'Iteration', header=TRUE)
for (i in 1:ncols) {
a<-table.element(a,names(selection[[3]][[1]]$coef)[i],header=TRUE)
}
a<-table.row.end(a)
for (j in 1:nrows) {
a<-table.row.start(a)
mydum <- 'Estimates ('
mydum <- paste(mydum,j)
mydum <- paste(mydum,')')
a<-table.element(a,mydum, header=TRUE)
for (i in 1:ncols) {
a<-table.element(a,round(selection[[1]][j,i],4))
}
a<-table.row.end(a)
a<-table.row.start(a)
a<-table.element(a,'(p-val)', header=TRUE)
for (i in 1:ncols) {
mydum <- '('
mydum <- paste(mydum,round(selection[[2]][j,i],4),sep='')
mydum <- paste(mydum,')')
a<-table.element(a,mydum)
}
a<-table.row.end(a)
}
a<-table.end(a)
table.save(a,file='mytable.tab')
a<-table.start()
a<-table.row.start(a)
a<-table.element(a,'Estimated ARIMA Residuals', 1,TRUE)
a<-table.row.end(a)
a<-table.row.start(a)
a<-table.element(a,'Value', 1,TRUE)
a<-table.row.end(a)
for (i in (par4*par5+par3):length(resid)) {
a<-table.row.start(a)
a<-table.element(a,resid[i])
a<-table.row.end(a)
}
a<-table.end(a)
table.save(a,file='mytable1.tab')