Free Statistics

of Irreproducible Research!

Author's title

Author*Unverified author*
R Software Modulerwasp_autocorrelation.wasp
Title produced by software(Partial) Autocorrelation Function
Date of computationThu, 11 Dec 2008 04:20:34 -0700
Cite this page as followsStatistical Computations at FreeStatistics.org, Office for Research Development and Education, URL https://freestatistics.org/blog/index.php?v=date/2008/Dec/11/t1228994515fv5goq8575ke1mq.htm/, Retrieved Fri, 17 May 2024 03:04:41 +0000
Statistical Computations at FreeStatistics.org, Office for Research Development and Education, URL https://freestatistics.org/blog/index.php?pk=32168, Retrieved Fri, 17 May 2024 03:04:41 +0000
QR Codes:

Original text written by user:
IsPrivate?No (this computation is public)
User-defined keywords
Estimated Impact226
Family? (F = Feedback message, R = changed R code, M = changed R Module, P = changed Parameters, D = changed Data)
F     [(Partial) Autocorrelation Function] [step acf] [2008-12-09 15:39:34] [74be16979710d4c4e7c6647856088456]
-   P   [(Partial) Autocorrelation Function] [step 3 acf] [2008-12-09 18:41:47] [74be16979710d4c4e7c6647856088456]
-   P       [(Partial) Autocorrelation Function] [sdsdsd] [2008-12-11 11:20:34] [d41d8cd98f00b204e9800998ecf8427e] [Current]
Feedback Forum

Post a new message
Dataseries X:
105.2
91.5
75.3
60.5
80.4
84.5
93.9
78
92.3
90
72.1
76.9
76
88.7
55.4
46.6
90.9
84.9
89
90.2
72.3
83
71.6
75.4
85.1
81.2
68.7
68.4
93.7
96.6
101.8
93.6
88.9
114.1
82.3
96.4
104
88.2
85.2
87.1
85.5
89.1
105.2
82.9
86.8
112
97.4
88.9
109.4
87.8
90.5
79.3
114.9
118.8
125
96.1
116.7
119.5
104.1
121
127.3
117.7
108
89.4
137.4
142
137.3
122.8
126.1
147.6
115.7
139.2
151.2
123.8
109
112.1
136.4
135.5
138.7
137.5
141.5
143.6
146.5
200.7
196.2


Summary of computational transaction
Raw Inputview raw input (R code)
Raw Outputview raw output of R engine
Computing time3 seconds
R Server'Sir Ronald Aylmer Fisher' @ 193.190.124.24

\begin{tabular}{lllllllll}
\hline
Summary of computational transaction \tabularnewline
Raw Input & view raw input (R code)  \tabularnewline
Raw Output & view raw output of R engine  \tabularnewline
Computing time & 3 seconds \tabularnewline
R Server & 'Sir Ronald Aylmer Fisher' @ 193.190.124.24 \tabularnewline
\hline
\end{tabular}
%Source: https://freestatistics.org/blog/index.php?pk=32168&T=0

[TABLE]
[ROW][C]Summary of computational transaction[/C][/ROW]
[ROW][C]Raw Input[/C][C]view raw input (R code) [/C][/ROW]
[ROW][C]Raw Output[/C][C]view raw output of R engine [/C][/ROW]
[ROW][C]Computing time[/C][C]3 seconds[/C][/ROW]
[ROW][C]R Server[/C][C]'Sir Ronald Aylmer Fisher' @ 193.190.124.24[/C][/ROW]
[/TABLE]
Source: https://freestatistics.org/blog/index.php?pk=32168&T=0

Globally Unique Identifier (entire table): ba.freestatistics.org/blog/index.php?pk=32168&T=0

As an alternative you can also use a QR Code:  

The GUIDs for individual cells are displayed in the table below:

Summary of computational transaction
Raw Inputview raw input (R code)
Raw Outputview raw output of R engine
Computing time3 seconds
R Server'Sir Ronald Aylmer Fisher' @ 193.190.124.24


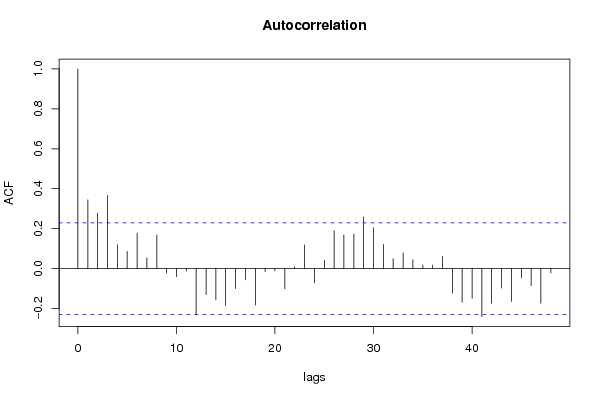
Autocorrelation Function
Time lag kACF(k)T-STATP-value
10.3441412.94030.002194
20.2770832.36740.010283
30.3656953.12450.001278
40.1194291.02040.155454
50.0856250.73160.233384
60.1775841.51730.066757
70.0525070.44860.327517
80.1682321.43740.077442
9-0.02201-0.18810.425677
10-0.041174-0.35180.363004
11-0.012311-0.10520.45826
12-0.233362-1.99380.024952
13-0.130291-1.11320.134636
14-0.156897-1.34050.092116
15-0.185458-1.58460.058695
16-0.099968-0.85410.197915
17-0.0567-0.48440.31476
18-0.183202-1.56530.060922
19-0.014983-0.1280.449246
20-0.01105-0.09440.462521
21-0.101273-0.86530.194861
220.0092010.07860.468778
230.118171.00960.158
24-0.071171-0.60810.27251
250.0416810.35610.361389
260.1887971.61310.055521
270.1686341.44080.076957
280.1732511.48030.071554
290.2581922.2060.015266
300.2042281.74490.042603
310.1205431.02990.153224
320.0487910.41690.338997
330.078450.67030.252398
340.0435370.3720.355493
350.018120.15480.438697
360.0172450.14730.441633
370.0610220.52140.301844
38-0.122996-1.05090.148391
39-0.169151-1.44520.076336
40-0.148915-1.27230.103647
41-0.241048-2.05950.021506
42-0.173344-1.48110.071448
43-0.097958-0.8370.202674
44-0.16472-1.40740.081781
45-0.047669-0.40730.342495
46-0.084655-0.72330.235905
47-0.174088-1.48740.070607
48-0.022017-0.18810.425654

\begin{tabular}{lllllllll}
\hline
Autocorrelation Function \tabularnewline
Time lag k & ACF(k) & T-STAT & P-value \tabularnewline
1 & 0.344141 & 2.9403 & 0.002194 \tabularnewline
2 & 0.277083 & 2.3674 & 0.010283 \tabularnewline
3 & 0.365695 & 3.1245 & 0.001278 \tabularnewline
4 & 0.119429 & 1.0204 & 0.155454 \tabularnewline
5 & 0.085625 & 0.7316 & 0.233384 \tabularnewline
6 & 0.177584 & 1.5173 & 0.066757 \tabularnewline
7 & 0.052507 & 0.4486 & 0.327517 \tabularnewline
8 & 0.168232 & 1.4374 & 0.077442 \tabularnewline
9 & -0.02201 & -0.1881 & 0.425677 \tabularnewline
10 & -0.041174 & -0.3518 & 0.363004 \tabularnewline
11 & -0.012311 & -0.1052 & 0.45826 \tabularnewline
12 & -0.233362 & -1.9938 & 0.024952 \tabularnewline
13 & -0.130291 & -1.1132 & 0.134636 \tabularnewline
14 & -0.156897 & -1.3405 & 0.092116 \tabularnewline
15 & -0.185458 & -1.5846 & 0.058695 \tabularnewline
16 & -0.099968 & -0.8541 & 0.197915 \tabularnewline
17 & -0.0567 & -0.4844 & 0.31476 \tabularnewline
18 & -0.183202 & -1.5653 & 0.060922 \tabularnewline
19 & -0.014983 & -0.128 & 0.449246 \tabularnewline
20 & -0.01105 & -0.0944 & 0.462521 \tabularnewline
21 & -0.101273 & -0.8653 & 0.194861 \tabularnewline
22 & 0.009201 & 0.0786 & 0.468778 \tabularnewline
23 & 0.11817 & 1.0096 & 0.158 \tabularnewline
24 & -0.071171 & -0.6081 & 0.27251 \tabularnewline
25 & 0.041681 & 0.3561 & 0.361389 \tabularnewline
26 & 0.188797 & 1.6131 & 0.055521 \tabularnewline
27 & 0.168634 & 1.4408 & 0.076957 \tabularnewline
28 & 0.173251 & 1.4803 & 0.071554 \tabularnewline
29 & 0.258192 & 2.206 & 0.015266 \tabularnewline
30 & 0.204228 & 1.7449 & 0.042603 \tabularnewline
31 & 0.120543 & 1.0299 & 0.153224 \tabularnewline
32 & 0.048791 & 0.4169 & 0.338997 \tabularnewline
33 & 0.07845 & 0.6703 & 0.252398 \tabularnewline
34 & 0.043537 & 0.372 & 0.355493 \tabularnewline
35 & 0.01812 & 0.1548 & 0.438697 \tabularnewline
36 & 0.017245 & 0.1473 & 0.441633 \tabularnewline
37 & 0.061022 & 0.5214 & 0.301844 \tabularnewline
38 & -0.122996 & -1.0509 & 0.148391 \tabularnewline
39 & -0.169151 & -1.4452 & 0.076336 \tabularnewline
40 & -0.148915 & -1.2723 & 0.103647 \tabularnewline
41 & -0.241048 & -2.0595 & 0.021506 \tabularnewline
42 & -0.173344 & -1.4811 & 0.071448 \tabularnewline
43 & -0.097958 & -0.837 & 0.202674 \tabularnewline
44 & -0.16472 & -1.4074 & 0.081781 \tabularnewline
45 & -0.047669 & -0.4073 & 0.342495 \tabularnewline
46 & -0.084655 & -0.7233 & 0.235905 \tabularnewline
47 & -0.174088 & -1.4874 & 0.070607 \tabularnewline
48 & -0.022017 & -0.1881 & 0.425654 \tabularnewline
\hline
\end{tabular}
%Source: https://freestatistics.org/blog/index.php?pk=32168&T=1

[TABLE]
[ROW][C]Autocorrelation Function[/C][/ROW]
[ROW][C]Time lag k[/C][C]ACF(k)[/C][C]T-STAT[/C][C]P-value[/C][/ROW]
[ROW][C]1[/C][C]0.344141[/C][C]2.9403[/C][C]0.002194[/C][/ROW]
[ROW][C]2[/C][C]0.277083[/C][C]2.3674[/C][C]0.010283[/C][/ROW]
[ROW][C]3[/C][C]0.365695[/C][C]3.1245[/C][C]0.001278[/C][/ROW]
[ROW][C]4[/C][C]0.119429[/C][C]1.0204[/C][C]0.155454[/C][/ROW]
[ROW][C]5[/C][C]0.085625[/C][C]0.7316[/C][C]0.233384[/C][/ROW]
[ROW][C]6[/C][C]0.177584[/C][C]1.5173[/C][C]0.066757[/C][/ROW]
[ROW][C]7[/C][C]0.052507[/C][C]0.4486[/C][C]0.327517[/C][/ROW]
[ROW][C]8[/C][C]0.168232[/C][C]1.4374[/C][C]0.077442[/C][/ROW]
[ROW][C]9[/C][C]-0.02201[/C][C]-0.1881[/C][C]0.425677[/C][/ROW]
[ROW][C]10[/C][C]-0.041174[/C][C]-0.3518[/C][C]0.363004[/C][/ROW]
[ROW][C]11[/C][C]-0.012311[/C][C]-0.1052[/C][C]0.45826[/C][/ROW]
[ROW][C]12[/C][C]-0.233362[/C][C]-1.9938[/C][C]0.024952[/C][/ROW]
[ROW][C]13[/C][C]-0.130291[/C][C]-1.1132[/C][C]0.134636[/C][/ROW]
[ROW][C]14[/C][C]-0.156897[/C][C]-1.3405[/C][C]0.092116[/C][/ROW]
[ROW][C]15[/C][C]-0.185458[/C][C]-1.5846[/C][C]0.058695[/C][/ROW]
[ROW][C]16[/C][C]-0.099968[/C][C]-0.8541[/C][C]0.197915[/C][/ROW]
[ROW][C]17[/C][C]-0.0567[/C][C]-0.4844[/C][C]0.31476[/C][/ROW]
[ROW][C]18[/C][C]-0.183202[/C][C]-1.5653[/C][C]0.060922[/C][/ROW]
[ROW][C]19[/C][C]-0.014983[/C][C]-0.128[/C][C]0.449246[/C][/ROW]
[ROW][C]20[/C][C]-0.01105[/C][C]-0.0944[/C][C]0.462521[/C][/ROW]
[ROW][C]21[/C][C]-0.101273[/C][C]-0.8653[/C][C]0.194861[/C][/ROW]
[ROW][C]22[/C][C]0.009201[/C][C]0.0786[/C][C]0.468778[/C][/ROW]
[ROW][C]23[/C][C]0.11817[/C][C]1.0096[/C][C]0.158[/C][/ROW]
[ROW][C]24[/C][C]-0.071171[/C][C]-0.6081[/C][C]0.27251[/C][/ROW]
[ROW][C]25[/C][C]0.041681[/C][C]0.3561[/C][C]0.361389[/C][/ROW]
[ROW][C]26[/C][C]0.188797[/C][C]1.6131[/C][C]0.055521[/C][/ROW]
[ROW][C]27[/C][C]0.168634[/C][C]1.4408[/C][C]0.076957[/C][/ROW]
[ROW][C]28[/C][C]0.173251[/C][C]1.4803[/C][C]0.071554[/C][/ROW]
[ROW][C]29[/C][C]0.258192[/C][C]2.206[/C][C]0.015266[/C][/ROW]
[ROW][C]30[/C][C]0.204228[/C][C]1.7449[/C][C]0.042603[/C][/ROW]
[ROW][C]31[/C][C]0.120543[/C][C]1.0299[/C][C]0.153224[/C][/ROW]
[ROW][C]32[/C][C]0.048791[/C][C]0.4169[/C][C]0.338997[/C][/ROW]
[ROW][C]33[/C][C]0.07845[/C][C]0.6703[/C][C]0.252398[/C][/ROW]
[ROW][C]34[/C][C]0.043537[/C][C]0.372[/C][C]0.355493[/C][/ROW]
[ROW][C]35[/C][C]0.01812[/C][C]0.1548[/C][C]0.438697[/C][/ROW]
[ROW][C]36[/C][C]0.017245[/C][C]0.1473[/C][C]0.441633[/C][/ROW]
[ROW][C]37[/C][C]0.061022[/C][C]0.5214[/C][C]0.301844[/C][/ROW]
[ROW][C]38[/C][C]-0.122996[/C][C]-1.0509[/C][C]0.148391[/C][/ROW]
[ROW][C]39[/C][C]-0.169151[/C][C]-1.4452[/C][C]0.076336[/C][/ROW]
[ROW][C]40[/C][C]-0.148915[/C][C]-1.2723[/C][C]0.103647[/C][/ROW]
[ROW][C]41[/C][C]-0.241048[/C][C]-2.0595[/C][C]0.021506[/C][/ROW]
[ROW][C]42[/C][C]-0.173344[/C][C]-1.4811[/C][C]0.071448[/C][/ROW]
[ROW][C]43[/C][C]-0.097958[/C][C]-0.837[/C][C]0.202674[/C][/ROW]
[ROW][C]44[/C][C]-0.16472[/C][C]-1.4074[/C][C]0.081781[/C][/ROW]
[ROW][C]45[/C][C]-0.047669[/C][C]-0.4073[/C][C]0.342495[/C][/ROW]
[ROW][C]46[/C][C]-0.084655[/C][C]-0.7233[/C][C]0.235905[/C][/ROW]
[ROW][C]47[/C][C]-0.174088[/C][C]-1.4874[/C][C]0.070607[/C][/ROW]
[ROW][C]48[/C][C]-0.022017[/C][C]-0.1881[/C][C]0.425654[/C][/ROW]
[/TABLE]
Source: https://freestatistics.org/blog/index.php?pk=32168&T=1

Globally Unique Identifier (entire table): ba.freestatistics.org/blog/index.php?pk=32168&T=1

As an alternative you can also use a QR Code:  

The GUIDs for individual cells are displayed in the table below:

Autocorrelation Function
Time lag kACF(k)T-STATP-value
10.3441412.94030.002194
20.2770832.36740.010283
30.3656953.12450.001278
40.1194291.02040.155454
50.0856250.73160.233384
60.1775841.51730.066757
70.0525070.44860.327517
80.1682321.43740.077442
9-0.02201-0.18810.425677
10-0.041174-0.35180.363004
11-0.012311-0.10520.45826
12-0.233362-1.99380.024952
13-0.130291-1.11320.134636
14-0.156897-1.34050.092116
15-0.185458-1.58460.058695
16-0.099968-0.85410.197915
17-0.0567-0.48440.31476
18-0.183202-1.56530.060922
19-0.014983-0.1280.449246
20-0.01105-0.09440.462521
21-0.101273-0.86530.194861
220.0092010.07860.468778
230.118171.00960.158
24-0.071171-0.60810.27251
250.0416810.35610.361389
260.1887971.61310.055521
270.1686341.44080.076957
280.1732511.48030.071554
290.2581922.2060.015266
300.2042281.74490.042603
310.1205431.02990.153224
320.0487910.41690.338997
330.078450.67030.252398
340.0435370.3720.355493
350.018120.15480.438697
360.0172450.14730.441633
370.0610220.52140.301844
38-0.122996-1.05090.148391
39-0.169151-1.44520.076336
40-0.148915-1.27230.103647
41-0.241048-2.05950.021506
42-0.173344-1.48110.071448
43-0.097958-0.8370.202674
44-0.16472-1.40740.081781
45-0.047669-0.40730.342495
46-0.084655-0.72330.235905
47-0.174088-1.48740.070607
48-0.022017-0.18810.425654


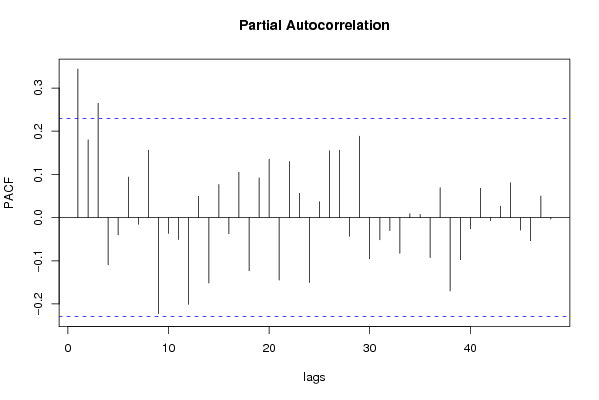
Partial Autocorrelation Function
Time lag kPACF(k)T-STATP-value
10.3441412.94030.002194
20.1799641.53760.064234
30.2644342.25930.013424
4-0.109105-0.93220.177155
5-0.040031-0.3420.366658
60.0937440.80090.21288
7-0.015277-0.13050.448253
80.1560051.33290.093354
9-0.222023-1.8970.030894
10-0.036709-0.31360.377343
11-0.050741-0.43350.332952
12-0.20092-1.71670.045141
130.049550.42340.336639
14-0.151698-1.29610.09951
150.0764240.6530.257914
16-0.037319-0.31890.375374
170.1049170.89640.18649
18-0.12312-1.05190.148148
190.0914980.78180.218442
200.1349311.15290.126366
21-0.144642-1.23580.110243
220.1298931.10980.135362
230.0562750.48080.316045
24-0.150489-1.28580.101293
250.0369210.31550.376659
260.1547871.32250.095066
270.1557851.3310.093661
28-0.043088-0.36810.356916
290.1882061.6080.056072
30-0.095341-0.81460.208978
31-0.051388-0.43910.330959
32-0.030056-0.25680.399027
33-0.082871-0.70810.240583
340.0090740.07750.469208
350.0072710.06210.475316
36-0.092464-0.790.21604
370.0689640.58920.278762
38-0.16984-1.45110.075516
39-0.097511-0.83310.203743
40-0.026002-0.22220.412406
410.0678370.57960.281985
42-0.006685-0.05710.477304
430.0262570.22430.411561
440.0806960.68950.246356
45-0.028868-0.24670.402935
46-0.053882-0.46040.323311
470.0502480.42930.334479
48-0.003426-0.02930.488363

\begin{tabular}{lllllllll}
\hline
Partial Autocorrelation Function \tabularnewline
Time lag k & PACF(k) & T-STAT & P-value \tabularnewline
1 & 0.344141 & 2.9403 & 0.002194 \tabularnewline
2 & 0.179964 & 1.5376 & 0.064234 \tabularnewline
3 & 0.264434 & 2.2593 & 0.013424 \tabularnewline
4 & -0.109105 & -0.9322 & 0.177155 \tabularnewline
5 & -0.040031 & -0.342 & 0.366658 \tabularnewline
6 & 0.093744 & 0.8009 & 0.21288 \tabularnewline
7 & -0.015277 & -0.1305 & 0.448253 \tabularnewline
8 & 0.156005 & 1.3329 & 0.093354 \tabularnewline
9 & -0.222023 & -1.897 & 0.030894 \tabularnewline
10 & -0.036709 & -0.3136 & 0.377343 \tabularnewline
11 & -0.050741 & -0.4335 & 0.332952 \tabularnewline
12 & -0.20092 & -1.7167 & 0.045141 \tabularnewline
13 & 0.04955 & 0.4234 & 0.336639 \tabularnewline
14 & -0.151698 & -1.2961 & 0.09951 \tabularnewline
15 & 0.076424 & 0.653 & 0.257914 \tabularnewline
16 & -0.037319 & -0.3189 & 0.375374 \tabularnewline
17 & 0.104917 & 0.8964 & 0.18649 \tabularnewline
18 & -0.12312 & -1.0519 & 0.148148 \tabularnewline
19 & 0.091498 & 0.7818 & 0.218442 \tabularnewline
20 & 0.134931 & 1.1529 & 0.126366 \tabularnewline
21 & -0.144642 & -1.2358 & 0.110243 \tabularnewline
22 & 0.129893 & 1.1098 & 0.135362 \tabularnewline
23 & 0.056275 & 0.4808 & 0.316045 \tabularnewline
24 & -0.150489 & -1.2858 & 0.101293 \tabularnewline
25 & 0.036921 & 0.3155 & 0.376659 \tabularnewline
26 & 0.154787 & 1.3225 & 0.095066 \tabularnewline
27 & 0.155785 & 1.331 & 0.093661 \tabularnewline
28 & -0.043088 & -0.3681 & 0.356916 \tabularnewline
29 & 0.188206 & 1.608 & 0.056072 \tabularnewline
30 & -0.095341 & -0.8146 & 0.208978 \tabularnewline
31 & -0.051388 & -0.4391 & 0.330959 \tabularnewline
32 & -0.030056 & -0.2568 & 0.399027 \tabularnewline
33 & -0.082871 & -0.7081 & 0.240583 \tabularnewline
34 & 0.009074 & 0.0775 & 0.469208 \tabularnewline
35 & 0.007271 & 0.0621 & 0.475316 \tabularnewline
36 & -0.092464 & -0.79 & 0.21604 \tabularnewline
37 & 0.068964 & 0.5892 & 0.278762 \tabularnewline
38 & -0.16984 & -1.4511 & 0.075516 \tabularnewline
39 & -0.097511 & -0.8331 & 0.203743 \tabularnewline
40 & -0.026002 & -0.2222 & 0.412406 \tabularnewline
41 & 0.067837 & 0.5796 & 0.281985 \tabularnewline
42 & -0.006685 & -0.0571 & 0.477304 \tabularnewline
43 & 0.026257 & 0.2243 & 0.411561 \tabularnewline
44 & 0.080696 & 0.6895 & 0.246356 \tabularnewline
45 & -0.028868 & -0.2467 & 0.402935 \tabularnewline
46 & -0.053882 & -0.4604 & 0.323311 \tabularnewline
47 & 0.050248 & 0.4293 & 0.334479 \tabularnewline
48 & -0.003426 & -0.0293 & 0.488363 \tabularnewline
\hline
\end{tabular}
%Source: https://freestatistics.org/blog/index.php?pk=32168&T=2

[TABLE]
[ROW][C]Partial Autocorrelation Function[/C][/ROW]
[ROW][C]Time lag k[/C][C]PACF(k)[/C][C]T-STAT[/C][C]P-value[/C][/ROW]
[ROW][C]1[/C][C]0.344141[/C][C]2.9403[/C][C]0.002194[/C][/ROW]
[ROW][C]2[/C][C]0.179964[/C][C]1.5376[/C][C]0.064234[/C][/ROW]
[ROW][C]3[/C][C]0.264434[/C][C]2.2593[/C][C]0.013424[/C][/ROW]
[ROW][C]4[/C][C]-0.109105[/C][C]-0.9322[/C][C]0.177155[/C][/ROW]
[ROW][C]5[/C][C]-0.040031[/C][C]-0.342[/C][C]0.366658[/C][/ROW]
[ROW][C]6[/C][C]0.093744[/C][C]0.8009[/C][C]0.21288[/C][/ROW]
[ROW][C]7[/C][C]-0.015277[/C][C]-0.1305[/C][C]0.448253[/C][/ROW]
[ROW][C]8[/C][C]0.156005[/C][C]1.3329[/C][C]0.093354[/C][/ROW]
[ROW][C]9[/C][C]-0.222023[/C][C]-1.897[/C][C]0.030894[/C][/ROW]
[ROW][C]10[/C][C]-0.036709[/C][C]-0.3136[/C][C]0.377343[/C][/ROW]
[ROW][C]11[/C][C]-0.050741[/C][C]-0.4335[/C][C]0.332952[/C][/ROW]
[ROW][C]12[/C][C]-0.20092[/C][C]-1.7167[/C][C]0.045141[/C][/ROW]
[ROW][C]13[/C][C]0.04955[/C][C]0.4234[/C][C]0.336639[/C][/ROW]
[ROW][C]14[/C][C]-0.151698[/C][C]-1.2961[/C][C]0.09951[/C][/ROW]
[ROW][C]15[/C][C]0.076424[/C][C]0.653[/C][C]0.257914[/C][/ROW]
[ROW][C]16[/C][C]-0.037319[/C][C]-0.3189[/C][C]0.375374[/C][/ROW]
[ROW][C]17[/C][C]0.104917[/C][C]0.8964[/C][C]0.18649[/C][/ROW]
[ROW][C]18[/C][C]-0.12312[/C][C]-1.0519[/C][C]0.148148[/C][/ROW]
[ROW][C]19[/C][C]0.091498[/C][C]0.7818[/C][C]0.218442[/C][/ROW]
[ROW][C]20[/C][C]0.134931[/C][C]1.1529[/C][C]0.126366[/C][/ROW]
[ROW][C]21[/C][C]-0.144642[/C][C]-1.2358[/C][C]0.110243[/C][/ROW]
[ROW][C]22[/C][C]0.129893[/C][C]1.1098[/C][C]0.135362[/C][/ROW]
[ROW][C]23[/C][C]0.056275[/C][C]0.4808[/C][C]0.316045[/C][/ROW]
[ROW][C]24[/C][C]-0.150489[/C][C]-1.2858[/C][C]0.101293[/C][/ROW]
[ROW][C]25[/C][C]0.036921[/C][C]0.3155[/C][C]0.376659[/C][/ROW]
[ROW][C]26[/C][C]0.154787[/C][C]1.3225[/C][C]0.095066[/C][/ROW]
[ROW][C]27[/C][C]0.155785[/C][C]1.331[/C][C]0.093661[/C][/ROW]
[ROW][C]28[/C][C]-0.043088[/C][C]-0.3681[/C][C]0.356916[/C][/ROW]
[ROW][C]29[/C][C]0.188206[/C][C]1.608[/C][C]0.056072[/C][/ROW]
[ROW][C]30[/C][C]-0.095341[/C][C]-0.8146[/C][C]0.208978[/C][/ROW]
[ROW][C]31[/C][C]-0.051388[/C][C]-0.4391[/C][C]0.330959[/C][/ROW]
[ROW][C]32[/C][C]-0.030056[/C][C]-0.2568[/C][C]0.399027[/C][/ROW]
[ROW][C]33[/C][C]-0.082871[/C][C]-0.7081[/C][C]0.240583[/C][/ROW]
[ROW][C]34[/C][C]0.009074[/C][C]0.0775[/C][C]0.469208[/C][/ROW]
[ROW][C]35[/C][C]0.007271[/C][C]0.0621[/C][C]0.475316[/C][/ROW]
[ROW][C]36[/C][C]-0.092464[/C][C]-0.79[/C][C]0.21604[/C][/ROW]
[ROW][C]37[/C][C]0.068964[/C][C]0.5892[/C][C]0.278762[/C][/ROW]
[ROW][C]38[/C][C]-0.16984[/C][C]-1.4511[/C][C]0.075516[/C][/ROW]
[ROW][C]39[/C][C]-0.097511[/C][C]-0.8331[/C][C]0.203743[/C][/ROW]
[ROW][C]40[/C][C]-0.026002[/C][C]-0.2222[/C][C]0.412406[/C][/ROW]
[ROW][C]41[/C][C]0.067837[/C][C]0.5796[/C][C]0.281985[/C][/ROW]
[ROW][C]42[/C][C]-0.006685[/C][C]-0.0571[/C][C]0.477304[/C][/ROW]
[ROW][C]43[/C][C]0.026257[/C][C]0.2243[/C][C]0.411561[/C][/ROW]
[ROW][C]44[/C][C]0.080696[/C][C]0.6895[/C][C]0.246356[/C][/ROW]
[ROW][C]45[/C][C]-0.028868[/C][C]-0.2467[/C][C]0.402935[/C][/ROW]
[ROW][C]46[/C][C]-0.053882[/C][C]-0.4604[/C][C]0.323311[/C][/ROW]
[ROW][C]47[/C][C]0.050248[/C][C]0.4293[/C][C]0.334479[/C][/ROW]
[ROW][C]48[/C][C]-0.003426[/C][C]-0.0293[/C][C]0.488363[/C][/ROW]
[/TABLE]
Source: https://freestatistics.org/blog/index.php?pk=32168&T=2

Globally Unique Identifier (entire table): ba.freestatistics.org/blog/index.php?pk=32168&T=2

As an alternative you can also use a QR Code:  

The GUIDs for individual cells are displayed in the table below:

Partial Autocorrelation Function
Time lag kPACF(k)T-STATP-value
10.3441412.94030.002194
20.1799641.53760.064234
30.2644342.25930.013424
4-0.109105-0.93220.177155
5-0.040031-0.3420.366658
60.0937440.80090.21288
7-0.015277-0.13050.448253
80.1560051.33290.093354
9-0.222023-1.8970.030894
10-0.036709-0.31360.377343
11-0.050741-0.43350.332952
12-0.20092-1.71670.045141
130.049550.42340.336639
14-0.151698-1.29610.09951
150.0764240.6530.257914
16-0.037319-0.31890.375374
170.1049170.89640.18649
18-0.12312-1.05190.148148
190.0914980.78180.218442
200.1349311.15290.126366
21-0.144642-1.23580.110243
220.1298931.10980.135362
230.0562750.48080.316045
24-0.150489-1.28580.101293
250.0369210.31550.376659
260.1547871.32250.095066
270.1557851.3310.093661
28-0.043088-0.36810.356916
290.1882061.6080.056072
30-0.095341-0.81460.208978
31-0.051388-0.43910.330959
32-0.030056-0.25680.399027
33-0.082871-0.70810.240583
340.0090740.07750.469208
350.0072710.06210.475316
36-0.092464-0.790.21604
370.0689640.58920.278762
38-0.16984-1.45110.075516
39-0.097511-0.83310.203743
40-0.026002-0.22220.412406
410.0678370.57960.281985
42-0.006685-0.05710.477304
430.0262570.22430.411561
440.0806960.68950.246356
45-0.028868-0.24670.402935
46-0.053882-0.46040.323311
470.0502480.42930.334479
48-0.003426-0.02930.488363


Parameters (Session):
par1 = 48 ; par2 = 0.1 ; par3 = 0 ; par4 = 1 ; par5 = 12 ;
Parameters (R input):
par1 = 48 ; par2 = 0.1 ; par3 = 0 ; par4 = 1 ; par5 = 12 ;
R code (references can be found in the software module):
if (par1 == 'Default') {
par1 = 10*log10(length(x))
} else {
par1 <- as.numeric(par1)
}
par2 <- as.numeric(par2)
par3 <- as.numeric(par3)
par4 <- as.numeric(par4)
par5 <- as.numeric(par5)
if (par2 == 0) {
x <- log(x)
} else {
x <- (x ^ par2 - 1) / par2
}
if (par3 > 0) x <- diff(x,lag=1,difference=par3)
if (par4 > 0) x <- diff(x,lag=par5,difference=par4)
bitmap(file='pic1.png')
racf <- acf(x,par1,main='Autocorrelation',xlab='lags',ylab='ACF')
dev.off()
bitmap(file='pic2.png')
rpacf <- pacf(x,par1,main='Partial Autocorrelation',xlab='lags',ylab='PACF')
dev.off()
(myacf <- c(racf$acf))
(mypacf <- c(rpacf$acf))
lengthx <- length(x)
sqrtn <- sqrt(lengthx)
load(file='createtable')
a<-table.start()
a<-table.row.start(a)
a<-table.element(a,'Autocorrelation Function',4,TRUE)
a<-table.row.end(a)
a<-table.row.start(a)
a<-table.element(a,'Time lag k',header=TRUE)
a<-table.element(a,hyperlink('basics.htm','ACF(k)','click here for more information about the Autocorrelation Function'),header=TRUE)
a<-table.element(a,'T-STAT',header=TRUE)
a<-table.element(a,'P-value',header=TRUE)
a<-table.row.end(a)
for (i in 2:(par1+1)) {
a<-table.row.start(a)
a<-table.element(a,i-1,header=TRUE)
a<-table.element(a,round(myacf[i],6))
mytstat <- myacf[i]*sqrtn
a<-table.element(a,round(mytstat,4))
a<-table.element(a,round(1-pt(abs(mytstat),lengthx),6))
a<-table.row.end(a)
}
a<-table.end(a)
table.save(a,file='mytable.tab')
a<-table.start()
a<-table.row.start(a)
a<-table.element(a,'Partial Autocorrelation Function',4,TRUE)
a<-table.row.end(a)
a<-table.row.start(a)
a<-table.element(a,'Time lag k',header=TRUE)
a<-table.element(a,hyperlink('basics.htm','PACF(k)','click here for more information about the Partial Autocorrelation Function'),header=TRUE)
a<-table.element(a,'T-STAT',header=TRUE)
a<-table.element(a,'P-value',header=TRUE)
a<-table.row.end(a)
for (i in 1:par1) {
a<-table.row.start(a)
a<-table.element(a,i,header=TRUE)
a<-table.element(a,round(mypacf[i],6))
mytstat <- mypacf[i]*sqrtn
a<-table.element(a,round(mytstat,4))
a<-table.element(a,round(1-pt(abs(mytstat),lengthx),6))
a<-table.row.end(a)
}
a<-table.end(a)
table.save(a,file='mytable1.tab')