Free Statistics

of Irreproducible Research!

Author's title

Author*The author of this computation has been verified*
R Software Modulerwasp_arimaforecasting.wasp
Title produced by softwareARIMA Forecasting
Date of computationWed, 10 Dec 2008 11:17:06 -0700
Cite this page as followsStatistical Computations at FreeStatistics.org, Office for Research Development and Education, URL https://freestatistics.org/blog/index.php?v=date/2008/Dec/10/t1228933070qa0724xifztk6kv.htm/, Retrieved Fri, 17 May 2024 02:39:36 +0000
Statistical Computations at FreeStatistics.org, Office for Research Development and Education, URL https://freestatistics.org/blog/index.php?pk=32058, Retrieved Fri, 17 May 2024 02:39:36 +0000
QR Codes:

Original text written by user:
IsPrivate?No (this computation is public)
User-defined keywords
Estimated Impact169
Family? (F = Feedback message, R = changed R code, M = changed R Module, P = changed Parameters, D = changed Data)
F       [ARIMA Forecasting] [Q1 Arima Forecast...] [2008-12-10 18:17:06] [8da7502cfecb272886bc60b3f290b8b8] [Current]
Feedback Forum
2008-12-19 11:13:43 [Dana Molenberghs] [reply
2008-12-19 11:16:37 [Dana Molenberghs] [reply
de kleine p-value van observatie is kleiner dan 5 % namelijk 0,0026 of 0,26%.
(niet: 2,6 zoals jij zegt in je opdracht)
Dit wil zeggen dat slechts 0.26% aan toeval te wijten kan zijn.
2008-12-19 11:21:16 [Dana Molenberghs] [reply
het had ook interessant geweest als je de voorspelde standaardfout had vergeleken met de werkelijke voorspellingsfout (PE)
2008-12-22 20:01:24 [An De Koninck] [reply
Ik heb inderdaad een foutje gemaakt, zoals Dana reeds had gezegd. De p-waarde bij observatie 68 is niet 2,6, maar 0,26%.

SE is de voorspellingsfout en bij PE zien we dan de werkelijke fout. De werkelijke fout is bij 4 observaties groter dan de voorspellingfout. Bij de overige 5 is de voorspellingsfout groter. Dit is een goed teken, want in werkelijkheid worden er dus minder fouten verwacht.
2008-12-22 20:10:36 [An De Koninck] [reply
Bij stap 2 heb ik niets gezegd over de seizonaliteit.
We zien erg veel schommelingen, maar deze hebben niet onmiddellijk met seizonaliteit te maken aangezien ze niet op de lags 12, 24, 36, 48 en 60 vallen. Ook is er niet direct een patroon in te herkennen.
2008-12-22 20:15:53 [An De Koninck] [reply
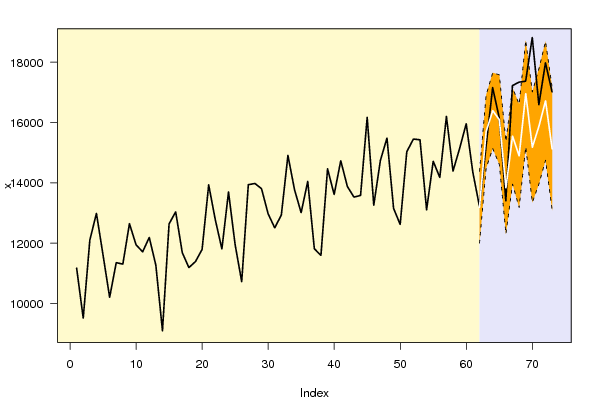
Ik heb niets gezegd over de ARIMA extrapolation Forecast.
In het begin is het model erg goed, daar is het verloop vrij gelijk met de voorspellingen. Pas vanaf waarde 66 begint de curve verschillend te lopen.
Tussen 67 en 68 en tussen 69,5 en 70,5 loopt de curve zelfs buiten het betrouwbaarheidsinterval.
Hieruit kan ik besluiten dat er bij deze observaties een significant verschil is tussen de werkelijke en de voorspelde waarde.

Post a new message
Dataseries X:
11178.4
9516.4
12102.8
12989.0
11610.2
10205.5
11356.2
11307.1
12648.6
11947.2
11714.1
12192.5
11268.8
9097.4
12639.8
13040.1
11687.3
11191.7
11391.9
11793.1
13933.2
12778.1
11810.3
13698.4
11956.6
10723.8
13938.9
13979.8
13807.4
12973.9
12509.8
12934.1
14908.3
13772.1
13012.6
14049.9
11816.5
11593.2
14466.2
13615.9
14733.9
13880.7
13527.5
13584.0
16170.2
13260.6
14741.9
15486.5
13154.5
12621.2
15031.6
15452.4
15428
13105.9
14716.8
14180.0
16202.2
14392.4
15140.6
15960.1
14351.3
13230.2
15202.1
17157.3
16159.1
13405.7
17224.7
17338.4
17370.6
18817.8
16593.2
17979.5
17015.2


Summary of computational transaction
Raw Inputview raw input (R code)
Raw Outputview raw output of R engine
Computing time1 seconds
R Server'George Udny Yule' @ 72.249.76.132

\begin{tabular}{lllllllll}
\hline
Summary of computational transaction \tabularnewline
Raw Input & view raw input (R code)  \tabularnewline
Raw Output & view raw output of R engine  \tabularnewline
Computing time & 1 seconds \tabularnewline
R Server & 'George Udny Yule' @ 72.249.76.132 \tabularnewline
\hline
\end{tabular}
%Source: https://freestatistics.org/blog/index.php?pk=32058&T=0

[TABLE]
[ROW][C]Summary of computational transaction[/C][/ROW]
[ROW][C]Raw Input[/C][C]view raw input (R code) [/C][/ROW]
[ROW][C]Raw Output[/C][C]view raw output of R engine [/C][/ROW]
[ROW][C]Computing time[/C][C]1 seconds[/C][/ROW]
[ROW][C]R Server[/C][C]'George Udny Yule' @ 72.249.76.132[/C][/ROW]
[/TABLE]
Source: https://freestatistics.org/blog/index.php?pk=32058&T=0

Globally Unique Identifier (entire table): ba.freestatistics.org/blog/index.php?pk=32058&T=0

As an alternative you can also use a QR Code:  

The GUIDs for individual cells are displayed in the table below:

Summary of computational transaction
Raw Inputview raw input (R code)
Raw Outputview raw output of R engine
Computing time1 seconds
R Server'George Udny Yule' @ 72.249.76.132


Univariate ARIMA Extrapolation Forecast
timeY[t]F[t]95% LB95% UBp-value(H0: Y[t] = F[t])P(F[t]>Y[t-1])P(F[t]>Y[t-s])P(F[t]>Y[61])
4913154.5-------
5012621.2-------
5115031.6-------
5215452.4-------
5315428-------
5413105.9-------
5514716.8-------
5614180-------
5716202.2-------
5814392.4-------
5915140.6-------
6015960.1-------
6114351.3-------
6213230.213192.809712002.791314382.8280.47540.02820.82680.0282
6315202.115698.128814485.904516910.35320.211310.85940.9853
6417157.316395.944315139.345317652.54320.11750.96870.92950.9993
6516159.116094.621314608.899417580.34330.46610.08050.81040.9893
6613405.713839.060212309.389915368.73050.28940.00150.82620.2558
6717224.715552.920913958.877617146.96410.01990.99590.8480.9302
6817338.414895.51913184.135116606.90290.00260.00380.79370.7334
6917370.616956.695115191.003818722.38640.3230.33590.79890.9981
7018817.815183.677713351.881817015.47351e-040.00960.80140.8134
7116593.215880.195113967.23917793.15110.23250.00130.77570.9414
7217979.516720.548314750.705918690.39070.10520.55040.77540.9908
7317015.215124.166113091.973217156.35910.03410.00290.7720.772

\begin{tabular}{lllllllll}
\hline
Univariate ARIMA Extrapolation Forecast \tabularnewline
time & Y[t] & F[t] & 95% LB & 95% UB & p-value(H0: Y[t] = F[t]) & P(F[t]>Y[t-1]) & P(F[t]>Y[t-s]) & P(F[t]>Y[61]) \tabularnewline
49 & 13154.5 & - & - & - & - & - & - & - \tabularnewline
50 & 12621.2 & - & - & - & - & - & - & - \tabularnewline
51 & 15031.6 & - & - & - & - & - & - & - \tabularnewline
52 & 15452.4 & - & - & - & - & - & - & - \tabularnewline
53 & 15428 & - & - & - & - & - & - & - \tabularnewline
54 & 13105.9 & - & - & - & - & - & - & - \tabularnewline
55 & 14716.8 & - & - & - & - & - & - & - \tabularnewline
56 & 14180 & - & - & - & - & - & - & - \tabularnewline
57 & 16202.2 & - & - & - & - & - & - & - \tabularnewline
58 & 14392.4 & - & - & - & - & - & - & - \tabularnewline
59 & 15140.6 & - & - & - & - & - & - & - \tabularnewline
60 & 15960.1 & - & - & - & - & - & - & - \tabularnewline
61 & 14351.3 & - & - & - & - & - & - & - \tabularnewline
62 & 13230.2 & 13192.8097 & 12002.7913 & 14382.828 & 0.4754 & 0.0282 & 0.8268 & 0.0282 \tabularnewline
63 & 15202.1 & 15698.1288 & 14485.9045 & 16910.3532 & 0.2113 & 1 & 0.8594 & 0.9853 \tabularnewline
64 & 17157.3 & 16395.9443 & 15139.3453 & 17652.5432 & 0.1175 & 0.9687 & 0.9295 & 0.9993 \tabularnewline
65 & 16159.1 & 16094.6213 & 14608.8994 & 17580.3433 & 0.4661 & 0.0805 & 0.8104 & 0.9893 \tabularnewline
66 & 13405.7 & 13839.0602 & 12309.3899 & 15368.7305 & 0.2894 & 0.0015 & 0.8262 & 0.2558 \tabularnewline
67 & 17224.7 & 15552.9209 & 13958.8776 & 17146.9641 & 0.0199 & 0.9959 & 0.848 & 0.9302 \tabularnewline
68 & 17338.4 & 14895.519 & 13184.1351 & 16606.9029 & 0.0026 & 0.0038 & 0.7937 & 0.7334 \tabularnewline
69 & 17370.6 & 16956.6951 & 15191.0038 & 18722.3864 & 0.323 & 0.3359 & 0.7989 & 0.9981 \tabularnewline
70 & 18817.8 & 15183.6777 & 13351.8818 & 17015.4735 & 1e-04 & 0.0096 & 0.8014 & 0.8134 \tabularnewline
71 & 16593.2 & 15880.1951 & 13967.239 & 17793.1511 & 0.2325 & 0.0013 & 0.7757 & 0.9414 \tabularnewline
72 & 17979.5 & 16720.5483 & 14750.7059 & 18690.3907 & 0.1052 & 0.5504 & 0.7754 & 0.9908 \tabularnewline
73 & 17015.2 & 15124.1661 & 13091.9732 & 17156.3591 & 0.0341 & 0.0029 & 0.772 & 0.772 \tabularnewline
\hline
\end{tabular}
%Source: https://freestatistics.org/blog/index.php?pk=32058&T=1

[TABLE]
[ROW][C]Univariate ARIMA Extrapolation Forecast[/C][/ROW]
[ROW][C]time[/C][C]Y[t][/C][C]F[t][/C][C]95% LB[/C][C]95% UB[/C][C]p-value(H0: Y[t] = F[t])[/C][C]P(F[t]>Y[t-1])[/C][C]P(F[t]>Y[t-s])[/C][C]P(F[t]>Y[61])[/C][/ROW]
[ROW][C]49[/C][C]13154.5[/C][C]-[/C][C]-[/C][C]-[/C][C]-[/C][C]-[/C][C]-[/C][C]-[/C][/ROW]
[ROW][C]50[/C][C]12621.2[/C][C]-[/C][C]-[/C][C]-[/C][C]-[/C][C]-[/C][C]-[/C][C]-[/C][/ROW]
[ROW][C]51[/C][C]15031.6[/C][C]-[/C][C]-[/C][C]-[/C][C]-[/C][C]-[/C][C]-[/C][C]-[/C][/ROW]
[ROW][C]52[/C][C]15452.4[/C][C]-[/C][C]-[/C][C]-[/C][C]-[/C][C]-[/C][C]-[/C][C]-[/C][/ROW]
[ROW][C]53[/C][C]15428[/C][C]-[/C][C]-[/C][C]-[/C][C]-[/C][C]-[/C][C]-[/C][C]-[/C][/ROW]
[ROW][C]54[/C][C]13105.9[/C][C]-[/C][C]-[/C][C]-[/C][C]-[/C][C]-[/C][C]-[/C][C]-[/C][/ROW]
[ROW][C]55[/C][C]14716.8[/C][C]-[/C][C]-[/C][C]-[/C][C]-[/C][C]-[/C][C]-[/C][C]-[/C][/ROW]
[ROW][C]56[/C][C]14180[/C][C]-[/C][C]-[/C][C]-[/C][C]-[/C][C]-[/C][C]-[/C][C]-[/C][/ROW]
[ROW][C]57[/C][C]16202.2[/C][C]-[/C][C]-[/C][C]-[/C][C]-[/C][C]-[/C][C]-[/C][C]-[/C][/ROW]
[ROW][C]58[/C][C]14392.4[/C][C]-[/C][C]-[/C][C]-[/C][C]-[/C][C]-[/C][C]-[/C][C]-[/C][/ROW]
[ROW][C]59[/C][C]15140.6[/C][C]-[/C][C]-[/C][C]-[/C][C]-[/C][C]-[/C][C]-[/C][C]-[/C][/ROW]
[ROW][C]60[/C][C]15960.1[/C][C]-[/C][C]-[/C][C]-[/C][C]-[/C][C]-[/C][C]-[/C][C]-[/C][/ROW]
[ROW][C]61[/C][C]14351.3[/C][C]-[/C][C]-[/C][C]-[/C][C]-[/C][C]-[/C][C]-[/C][C]-[/C][/ROW]
[ROW][C]62[/C][C]13230.2[/C][C]13192.8097[/C][C]12002.7913[/C][C]14382.828[/C][C]0.4754[/C][C]0.0282[/C][C]0.8268[/C][C]0.0282[/C][/ROW]
[ROW][C]63[/C][C]15202.1[/C][C]15698.1288[/C][C]14485.9045[/C][C]16910.3532[/C][C]0.2113[/C][C]1[/C][C]0.8594[/C][C]0.9853[/C][/ROW]
[ROW][C]64[/C][C]17157.3[/C][C]16395.9443[/C][C]15139.3453[/C][C]17652.5432[/C][C]0.1175[/C][C]0.9687[/C][C]0.9295[/C][C]0.9993[/C][/ROW]
[ROW][C]65[/C][C]16159.1[/C][C]16094.6213[/C][C]14608.8994[/C][C]17580.3433[/C][C]0.4661[/C][C]0.0805[/C][C]0.8104[/C][C]0.9893[/C][/ROW]
[ROW][C]66[/C][C]13405.7[/C][C]13839.0602[/C][C]12309.3899[/C][C]15368.7305[/C][C]0.2894[/C][C]0.0015[/C][C]0.8262[/C][C]0.2558[/C][/ROW]
[ROW][C]67[/C][C]17224.7[/C][C]15552.9209[/C][C]13958.8776[/C][C]17146.9641[/C][C]0.0199[/C][C]0.9959[/C][C]0.848[/C][C]0.9302[/C][/ROW]
[ROW][C]68[/C][C]17338.4[/C][C]14895.519[/C][C]13184.1351[/C][C]16606.9029[/C][C]0.0026[/C][C]0.0038[/C][C]0.7937[/C][C]0.7334[/C][/ROW]
[ROW][C]69[/C][C]17370.6[/C][C]16956.6951[/C][C]15191.0038[/C][C]18722.3864[/C][C]0.323[/C][C]0.3359[/C][C]0.7989[/C][C]0.9981[/C][/ROW]
[ROW][C]70[/C][C]18817.8[/C][C]15183.6777[/C][C]13351.8818[/C][C]17015.4735[/C][C]1e-04[/C][C]0.0096[/C][C]0.8014[/C][C]0.8134[/C][/ROW]
[ROW][C]71[/C][C]16593.2[/C][C]15880.1951[/C][C]13967.239[/C][C]17793.1511[/C][C]0.2325[/C][C]0.0013[/C][C]0.7757[/C][C]0.9414[/C][/ROW]
[ROW][C]72[/C][C]17979.5[/C][C]16720.5483[/C][C]14750.7059[/C][C]18690.3907[/C][C]0.1052[/C][C]0.5504[/C][C]0.7754[/C][C]0.9908[/C][/ROW]
[ROW][C]73[/C][C]17015.2[/C][C]15124.1661[/C][C]13091.9732[/C][C]17156.3591[/C][C]0.0341[/C][C]0.0029[/C][C]0.772[/C][C]0.772[/C][/ROW]
[/TABLE]
Source: https://freestatistics.org/blog/index.php?pk=32058&T=1

Globally Unique Identifier (entire table): ba.freestatistics.org/blog/index.php?pk=32058&T=1

As an alternative you can also use a QR Code:  

The GUIDs for individual cells are displayed in the table below:

Univariate ARIMA Extrapolation Forecast
timeY[t]F[t]95% LB95% UBp-value(H0: Y[t] = F[t])P(F[t]>Y[t-1])P(F[t]>Y[t-s])P(F[t]>Y[61])
4913154.5-------
5012621.2-------
5115031.6-------
5215452.4-------
5315428-------
5413105.9-------
5514716.8-------
5614180-------
5716202.2-------
5814392.4-------
5915140.6-------
6015960.1-------
6114351.3-------
6213230.213192.809712002.791314382.8280.47540.02820.82680.0282
6315202.115698.128814485.904516910.35320.211310.85940.9853
6417157.316395.944315139.345317652.54320.11750.96870.92950.9993
6516159.116094.621314608.899417580.34330.46610.08050.81040.9893
6613405.713839.060212309.389915368.73050.28940.00150.82620.2558
6717224.715552.920913958.877617146.96410.01990.99590.8480.9302
6817338.414895.51913184.135116606.90290.00260.00380.79370.7334
6917370.616956.695115191.003818722.38640.3230.33590.79890.9981
7018817.815183.677713351.881817015.47351e-040.00960.80140.8134
7116593.215880.195113967.23917793.15110.23250.00130.77570.9414
7217979.516720.548314750.705918690.39070.10520.55040.77540.9908
7317015.215124.166113091.973217156.35910.03410.00290.7720.772


Univariate ARIMA Extrapolation Forecast Performance
time% S.E.PEMAPESq.EMSERMSE
620.0460.00282e-041398.0379116.503210.7937
630.0394-0.03160.0026246044.611120503.7176143.1912
640.03910.04640.0039579662.554448305.2129219.7845
650.04710.0043e-044157.4981346.458218.6134
660.0564-0.03130.0026187801.095815650.0913125.1003
670.05230.10750.0092794845.5149232903.7929482.6011
680.05860.1640.01375967667.5342497305.6279705.199
690.05310.02440.002171317.245414276.4371119.484
700.06160.23930.019913206845.15241100570.42941049.0808
710.06150.04490.0037508376.005142364.6671205.8268
720.06010.07530.00631584959.3814132079.9484363.4281
730.06860.1250.01043576009.0285298000.7524545.8945

\begin{tabular}{lllllllll}
\hline
Univariate ARIMA Extrapolation Forecast Performance \tabularnewline
time & % S.E. & PE & MAPE & Sq.E & MSE & RMSE \tabularnewline
62 & 0.046 & 0.0028 & 2e-04 & 1398.0379 & 116.5032 & 10.7937 \tabularnewline
63 & 0.0394 & -0.0316 & 0.0026 & 246044.6111 & 20503.7176 & 143.1912 \tabularnewline
64 & 0.0391 & 0.0464 & 0.0039 & 579662.5544 & 48305.2129 & 219.7845 \tabularnewline
65 & 0.0471 & 0.004 & 3e-04 & 4157.4981 & 346.4582 & 18.6134 \tabularnewline
66 & 0.0564 & -0.0313 & 0.0026 & 187801.0958 & 15650.0913 & 125.1003 \tabularnewline
67 & 0.0523 & 0.1075 & 0.009 & 2794845.5149 & 232903.7929 & 482.6011 \tabularnewline
68 & 0.0586 & 0.164 & 0.0137 & 5967667.5342 & 497305.6279 & 705.199 \tabularnewline
69 & 0.0531 & 0.0244 & 0.002 & 171317.2454 & 14276.4371 & 119.484 \tabularnewline
70 & 0.0616 & 0.2393 & 0.0199 & 13206845.1524 & 1100570.4294 & 1049.0808 \tabularnewline
71 & 0.0615 & 0.0449 & 0.0037 & 508376.0051 & 42364.6671 & 205.8268 \tabularnewline
72 & 0.0601 & 0.0753 & 0.0063 & 1584959.3814 & 132079.9484 & 363.4281 \tabularnewline
73 & 0.0686 & 0.125 & 0.0104 & 3576009.0285 & 298000.7524 & 545.8945 \tabularnewline
\hline
\end{tabular}
%Source: https://freestatistics.org/blog/index.php?pk=32058&T=2

[TABLE]
[ROW][C]Univariate ARIMA Extrapolation Forecast Performance[/C][/ROW]
[ROW][C]time[/C][C]% S.E.[/C][C]PE[/C][C]MAPE[/C][C]Sq.E[/C][C]MSE[/C][C]RMSE[/C][/ROW]
[ROW][C]62[/C][C]0.046[/C][C]0.0028[/C][C]2e-04[/C][C]1398.0379[/C][C]116.5032[/C][C]10.7937[/C][/ROW]
[ROW][C]63[/C][C]0.0394[/C][C]-0.0316[/C][C]0.0026[/C][C]246044.6111[/C][C]20503.7176[/C][C]143.1912[/C][/ROW]
[ROW][C]64[/C][C]0.0391[/C][C]0.0464[/C][C]0.0039[/C][C]579662.5544[/C][C]48305.2129[/C][C]219.7845[/C][/ROW]
[ROW][C]65[/C][C]0.0471[/C][C]0.004[/C][C]3e-04[/C][C]4157.4981[/C][C]346.4582[/C][C]18.6134[/C][/ROW]
[ROW][C]66[/C][C]0.0564[/C][C]-0.0313[/C][C]0.0026[/C][C]187801.0958[/C][C]15650.0913[/C][C]125.1003[/C][/ROW]
[ROW][C]67[/C][C]0.0523[/C][C]0.1075[/C][C]0.009[/C][C]2794845.5149[/C][C]232903.7929[/C][C]482.6011[/C][/ROW]
[ROW][C]68[/C][C]0.0586[/C][C]0.164[/C][C]0.0137[/C][C]5967667.5342[/C][C]497305.6279[/C][C]705.199[/C][/ROW]
[ROW][C]69[/C][C]0.0531[/C][C]0.0244[/C][C]0.002[/C][C]171317.2454[/C][C]14276.4371[/C][C]119.484[/C][/ROW]
[ROW][C]70[/C][C]0.0616[/C][C]0.2393[/C][C]0.0199[/C][C]13206845.1524[/C][C]1100570.4294[/C][C]1049.0808[/C][/ROW]
[ROW][C]71[/C][C]0.0615[/C][C]0.0449[/C][C]0.0037[/C][C]508376.0051[/C][C]42364.6671[/C][C]205.8268[/C][/ROW]
[ROW][C]72[/C][C]0.0601[/C][C]0.0753[/C][C]0.0063[/C][C]1584959.3814[/C][C]132079.9484[/C][C]363.4281[/C][/ROW]
[ROW][C]73[/C][C]0.0686[/C][C]0.125[/C][C]0.0104[/C][C]3576009.0285[/C][C]298000.7524[/C][C]545.8945[/C][/ROW]
[/TABLE]
Source: https://freestatistics.org/blog/index.php?pk=32058&T=2

Globally Unique Identifier (entire table): ba.freestatistics.org/blog/index.php?pk=32058&T=2

As an alternative you can also use a QR Code:  

The GUIDs for individual cells are displayed in the table below:

Univariate ARIMA Extrapolation Forecast Performance
time% S.E.PEMAPESq.EMSERMSE
620.0460.00282e-041398.0379116.503210.7937
630.0394-0.03160.0026246044.611120503.7176143.1912
640.03910.04640.0039579662.554448305.2129219.7845
650.04710.0043e-044157.4981346.458218.6134
660.0564-0.03130.0026187801.095815650.0913125.1003
670.05230.10750.0092794845.5149232903.7929482.6011
680.05860.1640.01375967667.5342497305.6279705.199
690.05310.02440.002171317.245414276.4371119.484
700.06160.23930.019913206845.15241100570.42941049.0808
710.06150.04490.0037508376.005142364.6671205.8268
720.06010.07530.00631584959.3814132079.9484363.4281
730.06860.1250.01043576009.0285298000.7524545.8945


Parameters (Session):
par1 = 12 ; par2 = 1 ; par3 = 1 ; par4 = 1 ; par5 = 12 ; par6 = 2 ; par7 = 0 ; par8 = 0 ; par9 = 0 ; par10 = FALSE ;
Parameters (R input):
par1 = 12 ; par2 = 1 ; par3 = 1 ; par4 = 1 ; par5 = 12 ; par6 = 2 ; par7 = 0 ; par8 = 0 ; par9 = 0 ; par10 = FALSE ;
R code (references can be found in the software module):
par1 <- as.numeric(par1) #cut off periods
par2 <- as.numeric(par2) #lambda
par3 <- as.numeric(par3) #degree of non-seasonal differencing
par4 <- as.numeric(par4) #degree of seasonal differencing
par5 <- as.numeric(par5) #seasonal period
par6 <- as.numeric(par6) #p
par7 <- as.numeric(par7) #q
par8 <- as.numeric(par8) #P
par9 <- as.numeric(par9) #Q
if (par10 == 'TRUE') par10 <- TRUE
if (par10 == 'FALSE') par10 <- FALSE
if (par2 == 0) x <- log(x)
if (par2 != 0) x <- x^par2
lx <- length(x)
first <- lx - 2*par1
nx <- lx - par1
nx1 <- nx + 1
fx <- lx - nx
if (fx < 1) {
fx <- par5
nx1 <- lx + fx - 1
first <- lx - 2*fx
}
first <- 1
if (fx < 3) fx <- round(lx/10,0)
(arima.out <- arima(x[1:nx], order=c(par6,par3,par7), seasonal=list(order=c(par8,par4,par9), period=par5), include.mean=par10, method='ML'))
(forecast <- predict(arima.out,fx))
(lb <- forecast$pred - 1.96 * forecast$se)
(ub <- forecast$pred + 1.96 * forecast$se)
if (par2 == 0) {
x <- exp(x)
forecast$pred <- exp(forecast$pred)
lb <- exp(lb)
ub <- exp(ub)
}
if (par2 != 0) {
x <- x^(1/par2)
forecast$pred <- forecast$pred^(1/par2)
lb <- lb^(1/par2)
ub <- ub^(1/par2)
}
if (par2 < 0) {
olb <- lb
lb <- ub
ub <- olb
}
(actandfor <- c(x[1:nx], forecast$pred))
(perc.se <- (ub-forecast$pred)/1.96/forecast$pred)
bitmap(file='test1.png')
opar <- par(mar=c(4,4,2,2),las=1)
ylim <- c( min(x[first:nx],lb), max(x[first:nx],ub))
plot(x,ylim=ylim,type='n',xlim=c(first,lx))
usr <- par('usr')
rect(usr[1],usr[3],nx+1,usr[4],border=NA,col='lemonchiffon')
rect(nx1,usr[3],usr[2],usr[4],border=NA,col='lavender')
abline(h= (-3:3)*2 , col ='gray', lty =3)
polygon( c(nx1:lx,lx:nx1), c(lb,rev(ub)), col = 'orange', lty=2,border=NA)
lines(nx1:lx, lb , lty=2)
lines(nx1:lx, ub , lty=2)
lines(x, lwd=2)
lines(nx1:lx, forecast$pred , lwd=2 , col ='white')
box()
par(opar)
dev.off()
prob.dec <- array(NA, dim=fx)
prob.sdec <- array(NA, dim=fx)
prob.ldec <- array(NA, dim=fx)
prob.pval <- array(NA, dim=fx)
perf.pe <- array(0, dim=fx)
perf.mape <- array(0, dim=fx)
perf.se <- array(0, dim=fx)
perf.mse <- array(0, dim=fx)
perf.rmse <- array(0, dim=fx)
for (i in 1:fx) {
locSD <- (ub[i] - forecast$pred[i]) / 1.96
perf.pe[i] = (x[nx+i] - forecast$pred[i]) / forecast$pred[i]
perf.mape[i] = perf.mape[i] + abs(perf.pe[i])
perf.se[i] = (x[nx+i] - forecast$pred[i])^2
perf.mse[i] = perf.mse[i] + perf.se[i]
prob.dec[i] = pnorm((x[nx+i-1] - forecast$pred[i]) / locSD)
prob.sdec[i] = pnorm((x[nx+i-par5] - forecast$pred[i]) / locSD)
prob.ldec[i] = pnorm((x[nx] - forecast$pred[i]) / locSD)
prob.pval[i] = pnorm(abs(x[nx+i] - forecast$pred[i]) / locSD)
}
perf.mape = perf.mape / fx
perf.mse = perf.mse / fx
perf.rmse = sqrt(perf.mse)
bitmap(file='test2.png')
plot(forecast$pred, pch=19, type='b',main='ARIMA Extrapolation Forecast', ylab='Forecast and 95% CI', xlab='time',ylim=c(min(lb),max(ub)))
dum <- forecast$pred
dum[1:12] <- x[(nx+1):lx]
lines(dum, lty=1)
lines(ub,lty=3)
lines(lb,lty=3)
dev.off()
load(file='createtable')
a<-table.start()
a<-table.row.start(a)
a<-table.element(a,'Univariate ARIMA Extrapolation Forecast',9,TRUE)
a<-table.row.end(a)
a<-table.row.start(a)
a<-table.element(a,'time',1,header=TRUE)
a<-table.element(a,'Y[t]',1,header=TRUE)
a<-table.element(a,'F[t]',1,header=TRUE)
a<-table.element(a,'95% LB',1,header=TRUE)
a<-table.element(a,'95% UB',1,header=TRUE)
a<-table.element(a,'p-value
(H0: Y[t] = F[t])',1,header=TRUE)
a<-table.element(a,'P(F[t]>Y[t-1])',1,header=TRUE)
a<-table.element(a,'P(F[t]>Y[t-s])',1,header=TRUE)
mylab <- paste('P(F[t]>Y[',nx,sep='')
mylab <- paste(mylab,'])',sep='')
a<-table.element(a,mylab,1,header=TRUE)
a<-table.row.end(a)
for (i in (nx-par5):nx) {
a<-table.row.start(a)
a<-table.element(a,i,header=TRUE)
a<-table.element(a,x[i])
a<-table.element(a,'-')
a<-table.row.end(a)
}
for (i in 1:fx) {
a<-table.row.start(a)
a<-table.element(a,nx+i,header=TRUE)
a<-table.element(a,round(x[nx+i],4))
a<-table.element(a,round(forecast$pred[i],4))
a<-table.element(a,round(lb[i],4))
a<-table.element(a,round(ub[i],4))
a<-table.element(a,round((1-prob.pval[i]),4))
a<-table.element(a,round((1-prob.dec[i]),4))
a<-table.element(a,round((1-prob.sdec[i]),4))
a<-table.element(a,round((1-prob.ldec[i]),4))
a<-table.row.end(a)
}
a<-table.end(a)
table.save(a,file='mytable.tab')
a<-table.start()
a<-table.row.start(a)
a<-table.element(a,'Univariate ARIMA Extrapolation Forecast Performance',7,TRUE)
a<-table.row.end(a)
a<-table.row.start(a)
a<-table.element(a,'time',1,header=TRUE)
a<-table.element(a,'% S.E.',1,header=TRUE)
a<-table.element(a,'PE',1,header=TRUE)
a<-table.element(a,'MAPE',1,header=TRUE)
a<-table.element(a,'Sq.E',1,header=TRUE)
a<-table.element(a,'MSE',1,header=TRUE)
a<-table.element(a,'RMSE',1,header=TRUE)
a<-table.row.end(a)
for (i in 1:fx) {
a<-table.row.start(a)
a<-table.element(a,nx+i,header=TRUE)
a<-table.element(a,round(perc.se[i],4))
a<-table.element(a,round(perf.pe[i],4))
a<-table.element(a,round(perf.mape[i],4))
a<-table.element(a,round(perf.se[i],4))
a<-table.element(a,round(perf.mse[i],4))
a<-table.element(a,round(perf.rmse[i],4))
a<-table.row.end(a)
}
a<-table.end(a)
table.save(a,file='mytable1.tab')