Free Statistics

of Irreproducible Research!

Author's title

Author*Unverified author*
R Software Modulerwasp_autocorrelation.wasp
Title produced by software(Partial) Autocorrelation Function
Date of computationTue, 09 Dec 2008 15:34:16 -0700
Cite this page as followsStatistical Computations at FreeStatistics.org, Office for Research Development and Education, URL https://freestatistics.org/blog/index.php?v=date/2008/Dec/09/t12288620903mwho4ha1amrdve.htm/, Retrieved Fri, 17 May 2024 01:41:20 +0000
Statistical Computations at FreeStatistics.org, Office for Research Development and Education, URL https://freestatistics.org/blog/index.php?pk=31837, Retrieved Fri, 17 May 2024 01:41:20 +0000
QR Codes:

Original text written by user:
IsPrivate?No (this computation is public)
User-defined keywords
Estimated Impact151
Family? (F = Feedback message, R = changed R code, M = changed R Module, P = changed Parameters, D = changed Data)
-     [Univariate Data Series] [data set] [2008-12-01 19:54:57] [b98453cac15ba1066b407e146608df68]
F RMPD    [(Partial) Autocorrelation Function] [Identification an...] [2008-12-09 22:34:16] [74a138e5b32af267311b5ad4cd13bf7e] [Current]
Feedback Forum
2008-12-14 14:37:54 [Gert-Jan Geudens] [reply
Correcte werkwijze maar foutieve berekening. In stap 1, hebben we gevonden dat de transformatie onnuttig is, en dus moet je lambda hier gelijkstellen aan 1. Als je dit gedaan hebt, moet je identiek te werk gaan.
2008-12-15 14:32:09 [Stefan Temmerman] [reply
Voor de ARMA-processen: er is een correcte interpretatie gemaakt, maar als we de Backward Selection method toepassen, zien we dat er alleen maar een AR(2) proces is dat je moet volgen.

Post a new message
Dataseries X:
93.7
105.7
109.5
105.3
102.8
100.6
97.6
110.3
107.2
107.2
108.1
97.1
92.2
112.2
111.6
115.7
111.3
104.2
103.2
112.7
106.4
102.6
110.6
95.2
89
112.5
116.8
107.2
113.6
101.8
102.6
122.7
110.3
110.5
121.6
100.3
100.7
123.4
127.1
124.1
131.2
111.6
114.2
130.1
125.9
119
133.8
107.5
113.5
134.4
126.8
135.6
139.9
129.8
131
153.1
134.1
144.1
155.9
123.3
128.1
144.3
153
149.9
150.9
141
138.9
157.4
142.9
151.7
161
138.5
135.9
151.5
164
159.1
157
142.1
144.8
152.1
154.6
148.7
157.7
146.4
136.5


Summary of computational transaction
Raw Inputview raw input (R code)
Raw Outputview raw output of R engine
Computing time2 seconds
R Server'George Udny Yule' @ 72.249.76.132

\begin{tabular}{lllllllll}
\hline
Summary of computational transaction \tabularnewline
Raw Input & view raw input (R code)  \tabularnewline
Raw Output & view raw output of R engine  \tabularnewline
Computing time & 2 seconds \tabularnewline
R Server & 'George Udny Yule' @ 72.249.76.132 \tabularnewline
\hline
\end{tabular}
%Source: https://freestatistics.org/blog/index.php?pk=31837&T=0

[TABLE]
[ROW][C]Summary of computational transaction[/C][/ROW]
[ROW][C]Raw Input[/C][C]view raw input (R code) [/C][/ROW]
[ROW][C]Raw Output[/C][C]view raw output of R engine [/C][/ROW]
[ROW][C]Computing time[/C][C]2 seconds[/C][/ROW]
[ROW][C]R Server[/C][C]'George Udny Yule' @ 72.249.76.132[/C][/ROW]
[/TABLE]
Source: https://freestatistics.org/blog/index.php?pk=31837&T=0

Globally Unique Identifier (entire table): ba.freestatistics.org/blog/index.php?pk=31837&T=0

As an alternative you can also use a QR Code:  

The GUIDs for individual cells are displayed in the table below:

Summary of computational transaction
Raw Inputview raw input (R code)
Raw Outputview raw output of R engine
Computing time2 seconds
R Server'George Udny Yule' @ 72.249.76.132


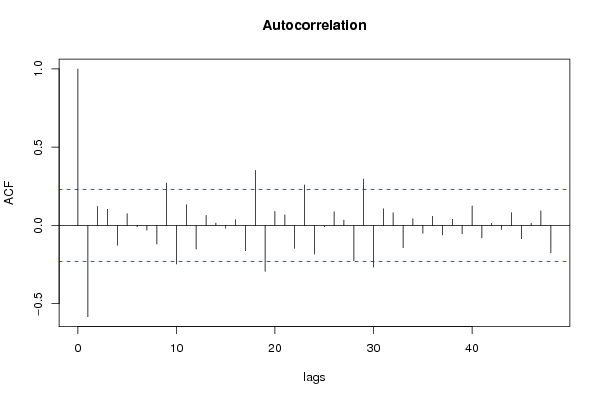
Autocorrelation Function
Time lag kACF(k)T-STATP-value
1-0.582602-4.94352e-06
20.1206591.02380.154673
30.1035090.87830.191351
4-0.126198-1.07080.143911
50.075290.63890.262471
6-0.007818-0.06630.473645
7-0.030466-0.25850.398374
8-0.118909-1.0090.158183
90.2718142.30640.011984
10-0.245912-2.08660.020232
110.1328271.12710.131726
12-0.150738-1.27910.102492
130.0641270.54410.294014
140.0155340.13180.44775
15-0.017545-0.14890.441033
160.0369860.31380.377275
17-0.161503-1.37040.08741
180.3516412.98380.001943
19-0.292849-2.48490.007642
200.0893090.75780.225517
210.0683190.57970.28196
22-0.14614-1.240.109493
230.2591092.19860.01556
24-0.18297-1.55260.062457
25-0.007548-0.0640.474557
260.088110.74760.228556
270.034660.29410.384766
28-0.22534-1.91210.029923
290.2962692.51390.007088
30-0.265986-2.2570.013523
310.1065420.9040.184495
320.0807820.68550.247628
33-0.142397-1.20830.115446
340.0421310.35750.360883
35-0.050415-0.42780.335042
360.0588470.49930.309533
37-0.060401-0.51250.304929
380.0396130.33610.368875
39-0.05358-0.45460.325368
400.1244621.05610.147228
41-0.078648-0.66740.25334
420.0139860.11870.452932
43-0.025366-0.21520.415097
440.0816560.69290.245309
45-0.084691-0.71860.237349
460.0145830.12370.450933
470.0924560.78450.217655
48-0.175006-1.4850.070958

\begin{tabular}{lllllllll}
\hline
Autocorrelation Function \tabularnewline
Time lag k & ACF(k) & T-STAT & P-value \tabularnewline
1 & -0.582602 & -4.9435 & 2e-06 \tabularnewline
2 & 0.120659 & 1.0238 & 0.154673 \tabularnewline
3 & 0.103509 & 0.8783 & 0.191351 \tabularnewline
4 & -0.126198 & -1.0708 & 0.143911 \tabularnewline
5 & 0.07529 & 0.6389 & 0.262471 \tabularnewline
6 & -0.007818 & -0.0663 & 0.473645 \tabularnewline
7 & -0.030466 & -0.2585 & 0.398374 \tabularnewline
8 & -0.118909 & -1.009 & 0.158183 \tabularnewline
9 & 0.271814 & 2.3064 & 0.011984 \tabularnewline
10 & -0.245912 & -2.0866 & 0.020232 \tabularnewline
11 & 0.132827 & 1.1271 & 0.131726 \tabularnewline
12 & -0.150738 & -1.2791 & 0.102492 \tabularnewline
13 & 0.064127 & 0.5441 & 0.294014 \tabularnewline
14 & 0.015534 & 0.1318 & 0.44775 \tabularnewline
15 & -0.017545 & -0.1489 & 0.441033 \tabularnewline
16 & 0.036986 & 0.3138 & 0.377275 \tabularnewline
17 & -0.161503 & -1.3704 & 0.08741 \tabularnewline
18 & 0.351641 & 2.9838 & 0.001943 \tabularnewline
19 & -0.292849 & -2.4849 & 0.007642 \tabularnewline
20 & 0.089309 & 0.7578 & 0.225517 \tabularnewline
21 & 0.068319 & 0.5797 & 0.28196 \tabularnewline
22 & -0.14614 & -1.24 & 0.109493 \tabularnewline
23 & 0.259109 & 2.1986 & 0.01556 \tabularnewline
24 & -0.18297 & -1.5526 & 0.062457 \tabularnewline
25 & -0.007548 & -0.064 & 0.474557 \tabularnewline
26 & 0.08811 & 0.7476 & 0.228556 \tabularnewline
27 & 0.03466 & 0.2941 & 0.384766 \tabularnewline
28 & -0.22534 & -1.9121 & 0.029923 \tabularnewline
29 & 0.296269 & 2.5139 & 0.007088 \tabularnewline
30 & -0.265986 & -2.257 & 0.013523 \tabularnewline
31 & 0.106542 & 0.904 & 0.184495 \tabularnewline
32 & 0.080782 & 0.6855 & 0.247628 \tabularnewline
33 & -0.142397 & -1.2083 & 0.115446 \tabularnewline
34 & 0.042131 & 0.3575 & 0.360883 \tabularnewline
35 & -0.050415 & -0.4278 & 0.335042 \tabularnewline
36 & 0.058847 & 0.4993 & 0.309533 \tabularnewline
37 & -0.060401 & -0.5125 & 0.304929 \tabularnewline
38 & 0.039613 & 0.3361 & 0.368875 \tabularnewline
39 & -0.05358 & -0.4546 & 0.325368 \tabularnewline
40 & 0.124462 & 1.0561 & 0.147228 \tabularnewline
41 & -0.078648 & -0.6674 & 0.25334 \tabularnewline
42 & 0.013986 & 0.1187 & 0.452932 \tabularnewline
43 & -0.025366 & -0.2152 & 0.415097 \tabularnewline
44 & 0.081656 & 0.6929 & 0.245309 \tabularnewline
45 & -0.084691 & -0.7186 & 0.237349 \tabularnewline
46 & 0.014583 & 0.1237 & 0.450933 \tabularnewline
47 & 0.092456 & 0.7845 & 0.217655 \tabularnewline
48 & -0.175006 & -1.485 & 0.070958 \tabularnewline
\hline
\end{tabular}
%Source: https://freestatistics.org/blog/index.php?pk=31837&T=1

[TABLE]
[ROW][C]Autocorrelation Function[/C][/ROW]
[ROW][C]Time lag k[/C][C]ACF(k)[/C][C]T-STAT[/C][C]P-value[/C][/ROW]
[ROW][C]1[/C][C]-0.582602[/C][C]-4.9435[/C][C]2e-06[/C][/ROW]
[ROW][C]2[/C][C]0.120659[/C][C]1.0238[/C][C]0.154673[/C][/ROW]
[ROW][C]3[/C][C]0.103509[/C][C]0.8783[/C][C]0.191351[/C][/ROW]
[ROW][C]4[/C][C]-0.126198[/C][C]-1.0708[/C][C]0.143911[/C][/ROW]
[ROW][C]5[/C][C]0.07529[/C][C]0.6389[/C][C]0.262471[/C][/ROW]
[ROW][C]6[/C][C]-0.007818[/C][C]-0.0663[/C][C]0.473645[/C][/ROW]
[ROW][C]7[/C][C]-0.030466[/C][C]-0.2585[/C][C]0.398374[/C][/ROW]
[ROW][C]8[/C][C]-0.118909[/C][C]-1.009[/C][C]0.158183[/C][/ROW]
[ROW][C]9[/C][C]0.271814[/C][C]2.3064[/C][C]0.011984[/C][/ROW]
[ROW][C]10[/C][C]-0.245912[/C][C]-2.0866[/C][C]0.020232[/C][/ROW]
[ROW][C]11[/C][C]0.132827[/C][C]1.1271[/C][C]0.131726[/C][/ROW]
[ROW][C]12[/C][C]-0.150738[/C][C]-1.2791[/C][C]0.102492[/C][/ROW]
[ROW][C]13[/C][C]0.064127[/C][C]0.5441[/C][C]0.294014[/C][/ROW]
[ROW][C]14[/C][C]0.015534[/C][C]0.1318[/C][C]0.44775[/C][/ROW]
[ROW][C]15[/C][C]-0.017545[/C][C]-0.1489[/C][C]0.441033[/C][/ROW]
[ROW][C]16[/C][C]0.036986[/C][C]0.3138[/C][C]0.377275[/C][/ROW]
[ROW][C]17[/C][C]-0.161503[/C][C]-1.3704[/C][C]0.08741[/C][/ROW]
[ROW][C]18[/C][C]0.351641[/C][C]2.9838[/C][C]0.001943[/C][/ROW]
[ROW][C]19[/C][C]-0.292849[/C][C]-2.4849[/C][C]0.007642[/C][/ROW]
[ROW][C]20[/C][C]0.089309[/C][C]0.7578[/C][C]0.225517[/C][/ROW]
[ROW][C]21[/C][C]0.068319[/C][C]0.5797[/C][C]0.28196[/C][/ROW]
[ROW][C]22[/C][C]-0.14614[/C][C]-1.24[/C][C]0.109493[/C][/ROW]
[ROW][C]23[/C][C]0.259109[/C][C]2.1986[/C][C]0.01556[/C][/ROW]
[ROW][C]24[/C][C]-0.18297[/C][C]-1.5526[/C][C]0.062457[/C][/ROW]
[ROW][C]25[/C][C]-0.007548[/C][C]-0.064[/C][C]0.474557[/C][/ROW]
[ROW][C]26[/C][C]0.08811[/C][C]0.7476[/C][C]0.228556[/C][/ROW]
[ROW][C]27[/C][C]0.03466[/C][C]0.2941[/C][C]0.384766[/C][/ROW]
[ROW][C]28[/C][C]-0.22534[/C][C]-1.9121[/C][C]0.029923[/C][/ROW]
[ROW][C]29[/C][C]0.296269[/C][C]2.5139[/C][C]0.007088[/C][/ROW]
[ROW][C]30[/C][C]-0.265986[/C][C]-2.257[/C][C]0.013523[/C][/ROW]
[ROW][C]31[/C][C]0.106542[/C][C]0.904[/C][C]0.184495[/C][/ROW]
[ROW][C]32[/C][C]0.080782[/C][C]0.6855[/C][C]0.247628[/C][/ROW]
[ROW][C]33[/C][C]-0.142397[/C][C]-1.2083[/C][C]0.115446[/C][/ROW]
[ROW][C]34[/C][C]0.042131[/C][C]0.3575[/C][C]0.360883[/C][/ROW]
[ROW][C]35[/C][C]-0.050415[/C][C]-0.4278[/C][C]0.335042[/C][/ROW]
[ROW][C]36[/C][C]0.058847[/C][C]0.4993[/C][C]0.309533[/C][/ROW]
[ROW][C]37[/C][C]-0.060401[/C][C]-0.5125[/C][C]0.304929[/C][/ROW]
[ROW][C]38[/C][C]0.039613[/C][C]0.3361[/C][C]0.368875[/C][/ROW]
[ROW][C]39[/C][C]-0.05358[/C][C]-0.4546[/C][C]0.325368[/C][/ROW]
[ROW][C]40[/C][C]0.124462[/C][C]1.0561[/C][C]0.147228[/C][/ROW]
[ROW][C]41[/C][C]-0.078648[/C][C]-0.6674[/C][C]0.25334[/C][/ROW]
[ROW][C]42[/C][C]0.013986[/C][C]0.1187[/C][C]0.452932[/C][/ROW]
[ROW][C]43[/C][C]-0.025366[/C][C]-0.2152[/C][C]0.415097[/C][/ROW]
[ROW][C]44[/C][C]0.081656[/C][C]0.6929[/C][C]0.245309[/C][/ROW]
[ROW][C]45[/C][C]-0.084691[/C][C]-0.7186[/C][C]0.237349[/C][/ROW]
[ROW][C]46[/C][C]0.014583[/C][C]0.1237[/C][C]0.450933[/C][/ROW]
[ROW][C]47[/C][C]0.092456[/C][C]0.7845[/C][C]0.217655[/C][/ROW]
[ROW][C]48[/C][C]-0.175006[/C][C]-1.485[/C][C]0.070958[/C][/ROW]
[/TABLE]
Source: https://freestatistics.org/blog/index.php?pk=31837&T=1

Globally Unique Identifier (entire table): ba.freestatistics.org/blog/index.php?pk=31837&T=1

As an alternative you can also use a QR Code:  

The GUIDs for individual cells are displayed in the table below:

Autocorrelation Function
Time lag kACF(k)T-STATP-value
1-0.582602-4.94352e-06
20.1206591.02380.154673
30.1035090.87830.191351
4-0.126198-1.07080.143911
50.075290.63890.262471
6-0.007818-0.06630.473645
7-0.030466-0.25850.398374
8-0.118909-1.0090.158183
90.2718142.30640.011984
10-0.245912-2.08660.020232
110.1328271.12710.131726
12-0.150738-1.27910.102492
130.0641270.54410.294014
140.0155340.13180.44775
15-0.017545-0.14890.441033
160.0369860.31380.377275
17-0.161503-1.37040.08741
180.3516412.98380.001943
19-0.292849-2.48490.007642
200.0893090.75780.225517
210.0683190.57970.28196
22-0.14614-1.240.109493
230.2591092.19860.01556
24-0.18297-1.55260.062457
25-0.007548-0.0640.474557
260.088110.74760.228556
270.034660.29410.384766
28-0.22534-1.91210.029923
290.2962692.51390.007088
30-0.265986-2.2570.013523
310.1065420.9040.184495
320.0807820.68550.247628
33-0.142397-1.20830.115446
340.0421310.35750.360883
35-0.050415-0.42780.335042
360.0588470.49930.309533
37-0.060401-0.51250.304929
380.0396130.33610.368875
39-0.05358-0.45460.325368
400.1244621.05610.147228
41-0.078648-0.66740.25334
420.0139860.11870.452932
43-0.025366-0.21520.415097
440.0816560.69290.245309
45-0.084691-0.71860.237349
460.0145830.12370.450933
470.0924560.78450.217655
48-0.175006-1.4850.070958


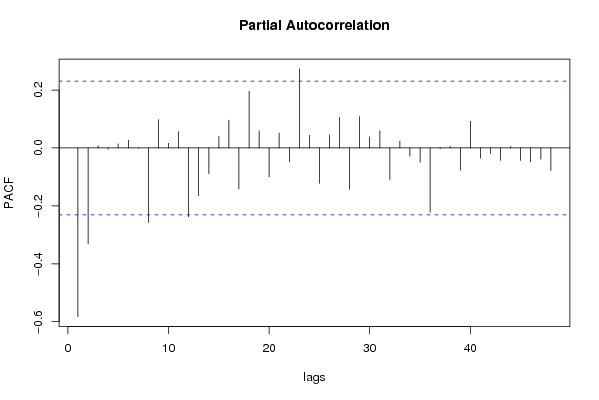
Partial Autocorrelation Function
Time lag kPACF(k)T-STATP-value
1-0.582602-4.94352e-06
2-0.331175-2.81010.003187
30.0070430.05980.476254
4-0.004694-0.03980.484169
50.0143550.12180.451697
60.0269350.22850.409934
7-0.001686-0.01430.494313
8-0.257628-2.1860.016032
90.0976510.82860.205036
100.0161580.13710.445665
110.0566830.4810.315998
12-0.237346-2.01390.023876
13-0.164694-1.39750.083282
14-0.089214-0.7570.225758
150.0395140.33530.369191
160.0960770.81520.208811
17-0.141767-1.20290.116471
180.1960321.66340.050291
190.0595360.50520.307489
20-0.099527-0.84450.200589
210.0511070.43370.332918
22-0.047399-0.40220.344365
230.272972.31620.011698
240.0439110.37260.355272
25-0.121779-1.03330.152453
260.0455570.38660.35011
270.1057630.89740.186241
28-0.142469-1.20890.11533
290.1084040.91980.180365
300.0377070.320.374966
310.059080.50130.30884
32-0.108533-0.92090.180081
330.0240130.20380.419559
34-0.027994-0.23750.406459
35-0.049641-0.42120.337426
36-0.221961-1.88340.031843
37-0.002951-0.0250.490047
380.0055180.04680.481392
39-0.076323-0.64760.259645
400.0920110.78070.218758
41-0.035463-0.30090.382174
42-0.019455-0.16510.434672
43-0.042925-0.36420.358377
440.0049110.04170.483438
45-0.042614-0.36160.359358
46-0.04764-0.40420.343619
47-0.03858-0.32740.372171
48-0.077783-0.660.255675

\begin{tabular}{lllllllll}
\hline
Partial Autocorrelation Function \tabularnewline
Time lag k & PACF(k) & T-STAT & P-value \tabularnewline
1 & -0.582602 & -4.9435 & 2e-06 \tabularnewline
2 & -0.331175 & -2.8101 & 0.003187 \tabularnewline
3 & 0.007043 & 0.0598 & 0.476254 \tabularnewline
4 & -0.004694 & -0.0398 & 0.484169 \tabularnewline
5 & 0.014355 & 0.1218 & 0.451697 \tabularnewline
6 & 0.026935 & 0.2285 & 0.409934 \tabularnewline
7 & -0.001686 & -0.0143 & 0.494313 \tabularnewline
8 & -0.257628 & -2.186 & 0.016032 \tabularnewline
9 & 0.097651 & 0.8286 & 0.205036 \tabularnewline
10 & 0.016158 & 0.1371 & 0.445665 \tabularnewline
11 & 0.056683 & 0.481 & 0.315998 \tabularnewline
12 & -0.237346 & -2.0139 & 0.023876 \tabularnewline
13 & -0.164694 & -1.3975 & 0.083282 \tabularnewline
14 & -0.089214 & -0.757 & 0.225758 \tabularnewline
15 & 0.039514 & 0.3353 & 0.369191 \tabularnewline
16 & 0.096077 & 0.8152 & 0.208811 \tabularnewline
17 & -0.141767 & -1.2029 & 0.116471 \tabularnewline
18 & 0.196032 & 1.6634 & 0.050291 \tabularnewline
19 & 0.059536 & 0.5052 & 0.307489 \tabularnewline
20 & -0.099527 & -0.8445 & 0.200589 \tabularnewline
21 & 0.051107 & 0.4337 & 0.332918 \tabularnewline
22 & -0.047399 & -0.4022 & 0.344365 \tabularnewline
23 & 0.27297 & 2.3162 & 0.011698 \tabularnewline
24 & 0.043911 & 0.3726 & 0.355272 \tabularnewline
25 & -0.121779 & -1.0333 & 0.152453 \tabularnewline
26 & 0.045557 & 0.3866 & 0.35011 \tabularnewline
27 & 0.105763 & 0.8974 & 0.186241 \tabularnewline
28 & -0.142469 & -1.2089 & 0.11533 \tabularnewline
29 & 0.108404 & 0.9198 & 0.180365 \tabularnewline
30 & 0.037707 & 0.32 & 0.374966 \tabularnewline
31 & 0.05908 & 0.5013 & 0.30884 \tabularnewline
32 & -0.108533 & -0.9209 & 0.180081 \tabularnewline
33 & 0.024013 & 0.2038 & 0.419559 \tabularnewline
34 & -0.027994 & -0.2375 & 0.406459 \tabularnewline
35 & -0.049641 & -0.4212 & 0.337426 \tabularnewline
36 & -0.221961 & -1.8834 & 0.031843 \tabularnewline
37 & -0.002951 & -0.025 & 0.490047 \tabularnewline
38 & 0.005518 & 0.0468 & 0.481392 \tabularnewline
39 & -0.076323 & -0.6476 & 0.259645 \tabularnewline
40 & 0.092011 & 0.7807 & 0.218758 \tabularnewline
41 & -0.035463 & -0.3009 & 0.382174 \tabularnewline
42 & -0.019455 & -0.1651 & 0.434672 \tabularnewline
43 & -0.042925 & -0.3642 & 0.358377 \tabularnewline
44 & 0.004911 & 0.0417 & 0.483438 \tabularnewline
45 & -0.042614 & -0.3616 & 0.359358 \tabularnewline
46 & -0.04764 & -0.4042 & 0.343619 \tabularnewline
47 & -0.03858 & -0.3274 & 0.372171 \tabularnewline
48 & -0.077783 & -0.66 & 0.255675 \tabularnewline
\hline
\end{tabular}
%Source: https://freestatistics.org/blog/index.php?pk=31837&T=2

[TABLE]
[ROW][C]Partial Autocorrelation Function[/C][/ROW]
[ROW][C]Time lag k[/C][C]PACF(k)[/C][C]T-STAT[/C][C]P-value[/C][/ROW]
[ROW][C]1[/C][C]-0.582602[/C][C]-4.9435[/C][C]2e-06[/C][/ROW]
[ROW][C]2[/C][C]-0.331175[/C][C]-2.8101[/C][C]0.003187[/C][/ROW]
[ROW][C]3[/C][C]0.007043[/C][C]0.0598[/C][C]0.476254[/C][/ROW]
[ROW][C]4[/C][C]-0.004694[/C][C]-0.0398[/C][C]0.484169[/C][/ROW]
[ROW][C]5[/C][C]0.014355[/C][C]0.1218[/C][C]0.451697[/C][/ROW]
[ROW][C]6[/C][C]0.026935[/C][C]0.2285[/C][C]0.409934[/C][/ROW]
[ROW][C]7[/C][C]-0.001686[/C][C]-0.0143[/C][C]0.494313[/C][/ROW]
[ROW][C]8[/C][C]-0.257628[/C][C]-2.186[/C][C]0.016032[/C][/ROW]
[ROW][C]9[/C][C]0.097651[/C][C]0.8286[/C][C]0.205036[/C][/ROW]
[ROW][C]10[/C][C]0.016158[/C][C]0.1371[/C][C]0.445665[/C][/ROW]
[ROW][C]11[/C][C]0.056683[/C][C]0.481[/C][C]0.315998[/C][/ROW]
[ROW][C]12[/C][C]-0.237346[/C][C]-2.0139[/C][C]0.023876[/C][/ROW]
[ROW][C]13[/C][C]-0.164694[/C][C]-1.3975[/C][C]0.083282[/C][/ROW]
[ROW][C]14[/C][C]-0.089214[/C][C]-0.757[/C][C]0.225758[/C][/ROW]
[ROW][C]15[/C][C]0.039514[/C][C]0.3353[/C][C]0.369191[/C][/ROW]
[ROW][C]16[/C][C]0.096077[/C][C]0.8152[/C][C]0.208811[/C][/ROW]
[ROW][C]17[/C][C]-0.141767[/C][C]-1.2029[/C][C]0.116471[/C][/ROW]
[ROW][C]18[/C][C]0.196032[/C][C]1.6634[/C][C]0.050291[/C][/ROW]
[ROW][C]19[/C][C]0.059536[/C][C]0.5052[/C][C]0.307489[/C][/ROW]
[ROW][C]20[/C][C]-0.099527[/C][C]-0.8445[/C][C]0.200589[/C][/ROW]
[ROW][C]21[/C][C]0.051107[/C][C]0.4337[/C][C]0.332918[/C][/ROW]
[ROW][C]22[/C][C]-0.047399[/C][C]-0.4022[/C][C]0.344365[/C][/ROW]
[ROW][C]23[/C][C]0.27297[/C][C]2.3162[/C][C]0.011698[/C][/ROW]
[ROW][C]24[/C][C]0.043911[/C][C]0.3726[/C][C]0.355272[/C][/ROW]
[ROW][C]25[/C][C]-0.121779[/C][C]-1.0333[/C][C]0.152453[/C][/ROW]
[ROW][C]26[/C][C]0.045557[/C][C]0.3866[/C][C]0.35011[/C][/ROW]
[ROW][C]27[/C][C]0.105763[/C][C]0.8974[/C][C]0.186241[/C][/ROW]
[ROW][C]28[/C][C]-0.142469[/C][C]-1.2089[/C][C]0.11533[/C][/ROW]
[ROW][C]29[/C][C]0.108404[/C][C]0.9198[/C][C]0.180365[/C][/ROW]
[ROW][C]30[/C][C]0.037707[/C][C]0.32[/C][C]0.374966[/C][/ROW]
[ROW][C]31[/C][C]0.05908[/C][C]0.5013[/C][C]0.30884[/C][/ROW]
[ROW][C]32[/C][C]-0.108533[/C][C]-0.9209[/C][C]0.180081[/C][/ROW]
[ROW][C]33[/C][C]0.024013[/C][C]0.2038[/C][C]0.419559[/C][/ROW]
[ROW][C]34[/C][C]-0.027994[/C][C]-0.2375[/C][C]0.406459[/C][/ROW]
[ROW][C]35[/C][C]-0.049641[/C][C]-0.4212[/C][C]0.337426[/C][/ROW]
[ROW][C]36[/C][C]-0.221961[/C][C]-1.8834[/C][C]0.031843[/C][/ROW]
[ROW][C]37[/C][C]-0.002951[/C][C]-0.025[/C][C]0.490047[/C][/ROW]
[ROW][C]38[/C][C]0.005518[/C][C]0.0468[/C][C]0.481392[/C][/ROW]
[ROW][C]39[/C][C]-0.076323[/C][C]-0.6476[/C][C]0.259645[/C][/ROW]
[ROW][C]40[/C][C]0.092011[/C][C]0.7807[/C][C]0.218758[/C][/ROW]
[ROW][C]41[/C][C]-0.035463[/C][C]-0.3009[/C][C]0.382174[/C][/ROW]
[ROW][C]42[/C][C]-0.019455[/C][C]-0.1651[/C][C]0.434672[/C][/ROW]
[ROW][C]43[/C][C]-0.042925[/C][C]-0.3642[/C][C]0.358377[/C][/ROW]
[ROW][C]44[/C][C]0.004911[/C][C]0.0417[/C][C]0.483438[/C][/ROW]
[ROW][C]45[/C][C]-0.042614[/C][C]-0.3616[/C][C]0.359358[/C][/ROW]
[ROW][C]46[/C][C]-0.04764[/C][C]-0.4042[/C][C]0.343619[/C][/ROW]
[ROW][C]47[/C][C]-0.03858[/C][C]-0.3274[/C][C]0.372171[/C][/ROW]
[ROW][C]48[/C][C]-0.077783[/C][C]-0.66[/C][C]0.255675[/C][/ROW]
[/TABLE]
Source: https://freestatistics.org/blog/index.php?pk=31837&T=2

Globally Unique Identifier (entire table): ba.freestatistics.org/blog/index.php?pk=31837&T=2

As an alternative you can also use a QR Code:  

The GUIDs for individual cells are displayed in the table below:

Partial Autocorrelation Function
Time lag kPACF(k)T-STATP-value
1-0.582602-4.94352e-06
2-0.331175-2.81010.003187
30.0070430.05980.476254
4-0.004694-0.03980.484169
50.0143550.12180.451697
60.0269350.22850.409934
7-0.001686-0.01430.494313
8-0.257628-2.1860.016032
90.0976510.82860.205036
100.0161580.13710.445665
110.0566830.4810.315998
12-0.237346-2.01390.023876
13-0.164694-1.39750.083282
14-0.089214-0.7570.225758
150.0395140.33530.369191
160.0960770.81520.208811
17-0.141767-1.20290.116471
180.1960321.66340.050291
190.0595360.50520.307489
20-0.099527-0.84450.200589
210.0511070.43370.332918
22-0.047399-0.40220.344365
230.272972.31620.011698
240.0439110.37260.355272
25-0.121779-1.03330.152453
260.0455570.38660.35011
270.1057630.89740.186241
28-0.142469-1.20890.11533
290.1084040.91980.180365
300.0377070.320.374966
310.059080.50130.30884
32-0.108533-0.92090.180081
330.0240130.20380.419559
34-0.027994-0.23750.406459
35-0.049641-0.42120.337426
36-0.221961-1.88340.031843
37-0.002951-0.0250.490047
380.0055180.04680.481392
39-0.076323-0.64760.259645
400.0920110.78070.218758
41-0.035463-0.30090.382174
42-0.019455-0.16510.434672
43-0.042925-0.36420.358377
440.0049110.04170.483438
45-0.042614-0.36160.359358
46-0.04764-0.40420.343619
47-0.03858-0.32740.372171
48-0.077783-0.660.255675


Parameters (Session):
par1 = 1 ; par2 = 1 ; par3 = 0 ; par4 = 12 ;
Parameters (R input):
par1 = 48 ; par2 = 0.2 ; par3 = 1 ; par4 = 1 ; par5 = 12 ;
R code (references can be found in the software module):
if (par1 == 'Default') {
par1 = 10*log10(length(x))
} else {
par1 <- as.numeric(par1)
}
par2 <- as.numeric(par2)
par3 <- as.numeric(par3)
par4 <- as.numeric(par4)
par5 <- as.numeric(par5)
if (par2 == 0) {
x <- log(x)
} else {
x <- (x ^ par2 - 1) / par2
}
if (par3 > 0) x <- diff(x,lag=1,difference=par3)
if (par4 > 0) x <- diff(x,lag=par5,difference=par4)
bitmap(file='pic1.png')
racf <- acf(x,par1,main='Autocorrelation',xlab='lags',ylab='ACF')
dev.off()
bitmap(file='pic2.png')
rpacf <- pacf(x,par1,main='Partial Autocorrelation',xlab='lags',ylab='PACF')
dev.off()
(myacf <- c(racf$acf))
(mypacf <- c(rpacf$acf))
lengthx <- length(x)
sqrtn <- sqrt(lengthx)
load(file='createtable')
a<-table.start()
a<-table.row.start(a)
a<-table.element(a,'Autocorrelation Function',4,TRUE)
a<-table.row.end(a)
a<-table.row.start(a)
a<-table.element(a,'Time lag k',header=TRUE)
a<-table.element(a,hyperlink('basics.htm','ACF(k)','click here for more information about the Autocorrelation Function'),header=TRUE)
a<-table.element(a,'T-STAT',header=TRUE)
a<-table.element(a,'P-value',header=TRUE)
a<-table.row.end(a)
for (i in 2:(par1+1)) {
a<-table.row.start(a)
a<-table.element(a,i-1,header=TRUE)
a<-table.element(a,round(myacf[i],6))
mytstat <- myacf[i]*sqrtn
a<-table.element(a,round(mytstat,4))
a<-table.element(a,round(1-pt(abs(mytstat),lengthx),6))
a<-table.row.end(a)
}
a<-table.end(a)
table.save(a,file='mytable.tab')
a<-table.start()
a<-table.row.start(a)
a<-table.element(a,'Partial Autocorrelation Function',4,TRUE)
a<-table.row.end(a)
a<-table.row.start(a)
a<-table.element(a,'Time lag k',header=TRUE)
a<-table.element(a,hyperlink('basics.htm','PACF(k)','click here for more information about the Partial Autocorrelation Function'),header=TRUE)
a<-table.element(a,'T-STAT',header=TRUE)
a<-table.element(a,'P-value',header=TRUE)
a<-table.row.end(a)
for (i in 1:par1) {
a<-table.row.start(a)
a<-table.element(a,i,header=TRUE)
a<-table.element(a,round(mypacf[i],6))
mytstat <- mypacf[i]*sqrtn
a<-table.element(a,round(mytstat,4))
a<-table.element(a,round(1-pt(abs(mytstat),lengthx),6))
a<-table.row.end(a)
}
a<-table.end(a)
table.save(a,file='mytable1.tab')