Free Statistics

of Irreproducible Research!

Author's title

Author*Unverified author*
R Software Modulerwasp_autocorrelation.wasp
Title produced by software(Partial) Autocorrelation Function
Date of computationTue, 09 Dec 2008 14:48:47 -0700
Cite this page as followsStatistical Computations at FreeStatistics.org, Office for Research Development and Education, URL https://freestatistics.org/blog/index.php?v=date/2008/Dec/09/t1228859358v5zusoddelc564v.htm/, Retrieved Fri, 17 May 2024 05:14:38 +0000
Statistical Computations at FreeStatistics.org, Office for Research Development and Education, URL https://freestatistics.org/blog/index.php?pk=31815, Retrieved Fri, 17 May 2024 05:14:38 +0000
QR Codes:

Original text written by user:
IsPrivate?No (this computation is public)
User-defined keywords
Estimated Impact158
Family? (F = Feedback message, R = changed R code, M = changed R Module, P = changed Parameters, D = changed Data)
F       [(Partial) Autocorrelation Function] [] [2008-12-09 21:48:47] [d41d8cd98f00b204e9800998ecf8427e] [Current]
Feedback Forum
2008-12-16 20:31:33 [Peter Van Doninck] [reply
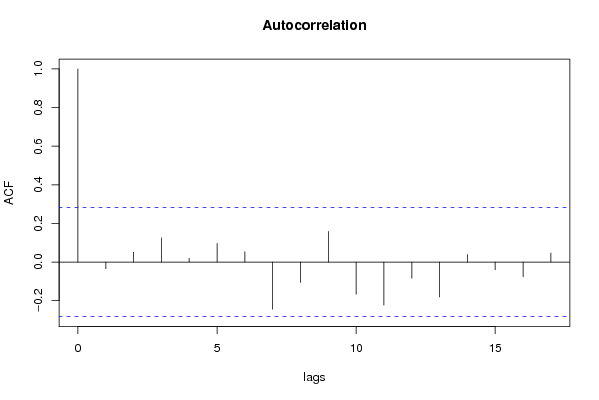
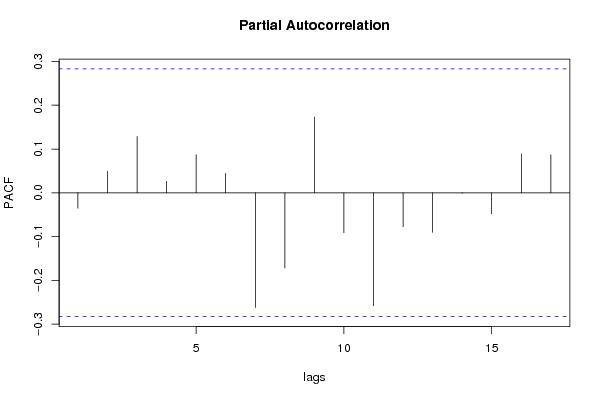
Correct uitgevoerd. Het valt op dat er geen lange termijntrend of seizoenaliteit aanwezig is. Wel vrij beperkt besproken.

Post a new message
Dataseries X:
123,9
124,9
112,7
121,9
100,6
104,3
120,4
107,5
102,9
125,6
107,5
108,8
128,4
121,1
119,5
128,7
108,7
105,5
119,8
111,3
110,6
120,1
97,5
107,7
127,3
117,2
119,8
116,2
111
112,4
130,6
109,1
118,8
123,9
101,6
112,8
128
129,6
125,8
119,5
115,7
113,6
129,7
112
116,8
127
112,1
114,2
121,1
131,6
125
120,4
117,7
117,5
120,6
127,5
112,3
124,5
115,2
105,4


Summary of computational transaction
Raw Inputview raw input (R code)
Raw Outputview raw output of R engine
Computing time1 seconds
R Server'George Udny Yule' @ 72.249.76.132

\begin{tabular}{lllllllll}
\hline
Summary of computational transaction \tabularnewline
Raw Input & view raw input (R code)  \tabularnewline
Raw Output & view raw output of R engine  \tabularnewline
Computing time & 1 seconds \tabularnewline
R Server & 'George Udny Yule' @ 72.249.76.132 \tabularnewline
\hline
\end{tabular}
%Source: https://freestatistics.org/blog/index.php?pk=31815&T=0

[TABLE]
[ROW][C]Summary of computational transaction[/C][/ROW]
[ROW][C]Raw Input[/C][C]view raw input (R code) [/C][/ROW]
[ROW][C]Raw Output[/C][C]view raw output of R engine [/C][/ROW]
[ROW][C]Computing time[/C][C]1 seconds[/C][/ROW]
[ROW][C]R Server[/C][C]'George Udny Yule' @ 72.249.76.132[/C][/ROW]
[/TABLE]
Source: https://freestatistics.org/blog/index.php?pk=31815&T=0

Globally Unique Identifier (entire table): ba.freestatistics.org/blog/index.php?pk=31815&T=0

As an alternative you can also use a QR Code:  

The GUIDs for individual cells are displayed in the table below:

Summary of computational transaction
Raw Inputview raw input (R code)
Raw Outputview raw output of R engine
Computing time1 seconds
R Server'George Udny Yule' @ 72.249.76.132


Autocorrelation Function
Time lag kACF(k)T-STATP-value
1-0.035137-0.24340.404353
20.050580.35040.363776
30.1247870.86450.195793
40.0190120.13170.447877
50.0964430.66820.253611
60.0533780.36980.356574
7-0.244019-1.69060.048698
8-0.105922-0.73390.233305
90.1581851.09590.139287
10-0.166878-1.15620.126668
11-0.222869-1.54410.064568
12-0.084027-0.58220.281593
13-0.180632-1.25150.108416
140.0383840.26590.395715
15-0.040491-0.28050.390139
16-0.076441-0.52960.299417
170.0464610.32190.374466

\begin{tabular}{lllllllll}
\hline
Autocorrelation Function \tabularnewline
Time lag k & ACF(k) & T-STAT & P-value \tabularnewline
1 & -0.035137 & -0.2434 & 0.404353 \tabularnewline
2 & 0.05058 & 0.3504 & 0.363776 \tabularnewline
3 & 0.124787 & 0.8645 & 0.195793 \tabularnewline
4 & 0.019012 & 0.1317 & 0.447877 \tabularnewline
5 & 0.096443 & 0.6682 & 0.253611 \tabularnewline
6 & 0.053378 & 0.3698 & 0.356574 \tabularnewline
7 & -0.244019 & -1.6906 & 0.048698 \tabularnewline
8 & -0.105922 & -0.7339 & 0.233305 \tabularnewline
9 & 0.158185 & 1.0959 & 0.139287 \tabularnewline
10 & -0.166878 & -1.1562 & 0.126668 \tabularnewline
11 & -0.222869 & -1.5441 & 0.064568 \tabularnewline
12 & -0.084027 & -0.5822 & 0.281593 \tabularnewline
13 & -0.180632 & -1.2515 & 0.108416 \tabularnewline
14 & 0.038384 & 0.2659 & 0.395715 \tabularnewline
15 & -0.040491 & -0.2805 & 0.390139 \tabularnewline
16 & -0.076441 & -0.5296 & 0.299417 \tabularnewline
17 & 0.046461 & 0.3219 & 0.374466 \tabularnewline
\hline
\end{tabular}
%Source: https://freestatistics.org/blog/index.php?pk=31815&T=1

[TABLE]
[ROW][C]Autocorrelation Function[/C][/ROW]
[ROW][C]Time lag k[/C][C]ACF(k)[/C][C]T-STAT[/C][C]P-value[/C][/ROW]
[ROW][C]1[/C][C]-0.035137[/C][C]-0.2434[/C][C]0.404353[/C][/ROW]
[ROW][C]2[/C][C]0.05058[/C][C]0.3504[/C][C]0.363776[/C][/ROW]
[ROW][C]3[/C][C]0.124787[/C][C]0.8645[/C][C]0.195793[/C][/ROW]
[ROW][C]4[/C][C]0.019012[/C][C]0.1317[/C][C]0.447877[/C][/ROW]
[ROW][C]5[/C][C]0.096443[/C][C]0.6682[/C][C]0.253611[/C][/ROW]
[ROW][C]6[/C][C]0.053378[/C][C]0.3698[/C][C]0.356574[/C][/ROW]
[ROW][C]7[/C][C]-0.244019[/C][C]-1.6906[/C][C]0.048698[/C][/ROW]
[ROW][C]8[/C][C]-0.105922[/C][C]-0.7339[/C][C]0.233305[/C][/ROW]
[ROW][C]9[/C][C]0.158185[/C][C]1.0959[/C][C]0.139287[/C][/ROW]
[ROW][C]10[/C][C]-0.166878[/C][C]-1.1562[/C][C]0.126668[/C][/ROW]
[ROW][C]11[/C][C]-0.222869[/C][C]-1.5441[/C][C]0.064568[/C][/ROW]
[ROW][C]12[/C][C]-0.084027[/C][C]-0.5822[/C][C]0.281593[/C][/ROW]
[ROW][C]13[/C][C]-0.180632[/C][C]-1.2515[/C][C]0.108416[/C][/ROW]
[ROW][C]14[/C][C]0.038384[/C][C]0.2659[/C][C]0.395715[/C][/ROW]
[ROW][C]15[/C][C]-0.040491[/C][C]-0.2805[/C][C]0.390139[/C][/ROW]
[ROW][C]16[/C][C]-0.076441[/C][C]-0.5296[/C][C]0.299417[/C][/ROW]
[ROW][C]17[/C][C]0.046461[/C][C]0.3219[/C][C]0.374466[/C][/ROW]
[/TABLE]
Source: https://freestatistics.org/blog/index.php?pk=31815&T=1

Globally Unique Identifier (entire table): ba.freestatistics.org/blog/index.php?pk=31815&T=1

As an alternative you can also use a QR Code:  

The GUIDs for individual cells are displayed in the table below:

Autocorrelation Function
Time lag kACF(k)T-STATP-value
1-0.035137-0.24340.404353
20.050580.35040.363776
30.1247870.86450.195793
40.0190120.13170.447877
50.0964430.66820.253611
60.0533780.36980.356574
7-0.244019-1.69060.048698
8-0.105922-0.73390.233305
90.1581851.09590.139287
10-0.166878-1.15620.126668
11-0.222869-1.54410.064568
12-0.084027-0.58220.281593
13-0.180632-1.25150.108416
140.0383840.26590.395715
15-0.040491-0.28050.390139
16-0.076441-0.52960.299417
170.0464610.32190.374466


Partial Autocorrelation Function
Time lag kPACF(k)T-STATP-value
1-0.035137-0.24340.404353
20.0494060.34230.366811
30.1286850.89160.18854
40.026310.18230.428066
50.0869120.60210.274955
60.0441380.30580.38054
7-0.261855-1.81420.037951
8-0.171632-1.18910.120125
90.1729941.19850.118296
10-0.091017-0.63060.265652
11-0.257968-1.78730.040106
12-0.07739-0.53620.297157
13-0.090139-0.62450.267628
14-0.000983-0.00680.497296
15-0.047828-0.33140.370906
160.0886780.61440.270933
170.0867990.60140.275215

\begin{tabular}{lllllllll}
\hline
Partial Autocorrelation Function \tabularnewline
Time lag k & PACF(k) & T-STAT & P-value \tabularnewline
1 & -0.035137 & -0.2434 & 0.404353 \tabularnewline
2 & 0.049406 & 0.3423 & 0.366811 \tabularnewline
3 & 0.128685 & 0.8916 & 0.18854 \tabularnewline
4 & 0.02631 & 0.1823 & 0.428066 \tabularnewline
5 & 0.086912 & 0.6021 & 0.274955 \tabularnewline
6 & 0.044138 & 0.3058 & 0.38054 \tabularnewline
7 & -0.261855 & -1.8142 & 0.037951 \tabularnewline
8 & -0.171632 & -1.1891 & 0.120125 \tabularnewline
9 & 0.172994 & 1.1985 & 0.118296 \tabularnewline
10 & -0.091017 & -0.6306 & 0.265652 \tabularnewline
11 & -0.257968 & -1.7873 & 0.040106 \tabularnewline
12 & -0.07739 & -0.5362 & 0.297157 \tabularnewline
13 & -0.090139 & -0.6245 & 0.267628 \tabularnewline
14 & -0.000983 & -0.0068 & 0.497296 \tabularnewline
15 & -0.047828 & -0.3314 & 0.370906 \tabularnewline
16 & 0.088678 & 0.6144 & 0.270933 \tabularnewline
17 & 0.086799 & 0.6014 & 0.275215 \tabularnewline
\hline
\end{tabular}
%Source: https://freestatistics.org/blog/index.php?pk=31815&T=2

[TABLE]
[ROW][C]Partial Autocorrelation Function[/C][/ROW]
[ROW][C]Time lag k[/C][C]PACF(k)[/C][C]T-STAT[/C][C]P-value[/C][/ROW]
[ROW][C]1[/C][C]-0.035137[/C][C]-0.2434[/C][C]0.404353[/C][/ROW]
[ROW][C]2[/C][C]0.049406[/C][C]0.3423[/C][C]0.366811[/C][/ROW]
[ROW][C]3[/C][C]0.128685[/C][C]0.8916[/C][C]0.18854[/C][/ROW]
[ROW][C]4[/C][C]0.02631[/C][C]0.1823[/C][C]0.428066[/C][/ROW]
[ROW][C]5[/C][C]0.086912[/C][C]0.6021[/C][C]0.274955[/C][/ROW]
[ROW][C]6[/C][C]0.044138[/C][C]0.3058[/C][C]0.38054[/C][/ROW]
[ROW][C]7[/C][C]-0.261855[/C][C]-1.8142[/C][C]0.037951[/C][/ROW]
[ROW][C]8[/C][C]-0.171632[/C][C]-1.1891[/C][C]0.120125[/C][/ROW]
[ROW][C]9[/C][C]0.172994[/C][C]1.1985[/C][C]0.118296[/C][/ROW]
[ROW][C]10[/C][C]-0.091017[/C][C]-0.6306[/C][C]0.265652[/C][/ROW]
[ROW][C]11[/C][C]-0.257968[/C][C]-1.7873[/C][C]0.040106[/C][/ROW]
[ROW][C]12[/C][C]-0.07739[/C][C]-0.5362[/C][C]0.297157[/C][/ROW]
[ROW][C]13[/C][C]-0.090139[/C][C]-0.6245[/C][C]0.267628[/C][/ROW]
[ROW][C]14[/C][C]-0.000983[/C][C]-0.0068[/C][C]0.497296[/C][/ROW]
[ROW][C]15[/C][C]-0.047828[/C][C]-0.3314[/C][C]0.370906[/C][/ROW]
[ROW][C]16[/C][C]0.088678[/C][C]0.6144[/C][C]0.270933[/C][/ROW]
[ROW][C]17[/C][C]0.086799[/C][C]0.6014[/C][C]0.275215[/C][/ROW]
[/TABLE]
Source: https://freestatistics.org/blog/index.php?pk=31815&T=2

Globally Unique Identifier (entire table): ba.freestatistics.org/blog/index.php?pk=31815&T=2

As an alternative you can also use a QR Code:  

The GUIDs for individual cells are displayed in the table below:

Partial Autocorrelation Function
Time lag kPACF(k)T-STATP-value
1-0.035137-0.24340.404353
20.0494060.34230.366811
30.1286850.89160.18854
40.026310.18230.428066
50.0869120.60210.274955
60.0441380.30580.38054
7-0.261855-1.81420.037951
8-0.171632-1.18910.120125
90.1729941.19850.118296
10-0.091017-0.63060.265652
11-0.257968-1.78730.040106
12-0.07739-0.53620.297157
13-0.090139-0.62450.267628
14-0.000983-0.00680.497296
15-0.047828-0.33140.370906
160.0886780.61440.270933
170.0867990.60140.275215


Parameters (Session):
par1 = Default ; par2 = 1 ; par3 = 0 ; par4 = 1 ; par5 = 12 ;
Parameters (R input):
par1 = Default ; par2 = 1 ; par3 = 0 ; par4 = 1 ; par5 = 12 ;
R code (references can be found in the software module):
if (par1 == 'Default') {
par1 = 10*log10(length(x))
} else {
par1 <- as.numeric(par1)
}
par2 <- as.numeric(par2)
par3 <- as.numeric(par3)
par4 <- as.numeric(par4)
par5 <- as.numeric(par5)
if (par2 == 0) {
x <- log(x)
} else {
x <- (x ^ par2 - 1) / par2
}
if (par3 > 0) x <- diff(x,lag=1,difference=par3)
if (par4 > 0) x <- diff(x,lag=par5,difference=par4)
bitmap(file='pic1.png')
racf <- acf(x,par1,main='Autocorrelation',xlab='lags',ylab='ACF')
dev.off()
bitmap(file='pic2.png')
rpacf <- pacf(x,par1,main='Partial Autocorrelation',xlab='lags',ylab='PACF')
dev.off()
(myacf <- c(racf$acf))
(mypacf <- c(rpacf$acf))
lengthx <- length(x)
sqrtn <- sqrt(lengthx)
load(file='createtable')
a<-table.start()
a<-table.row.start(a)
a<-table.element(a,'Autocorrelation Function',4,TRUE)
a<-table.row.end(a)
a<-table.row.start(a)
a<-table.element(a,'Time lag k',header=TRUE)
a<-table.element(a,hyperlink('basics.htm','ACF(k)','click here for more information about the Autocorrelation Function'),header=TRUE)
a<-table.element(a,'T-STAT',header=TRUE)
a<-table.element(a,'P-value',header=TRUE)
a<-table.row.end(a)
for (i in 2:(par1+1)) {
a<-table.row.start(a)
a<-table.element(a,i-1,header=TRUE)
a<-table.element(a,round(myacf[i],6))
mytstat <- myacf[i]*sqrtn
a<-table.element(a,round(mytstat,4))
a<-table.element(a,round(1-pt(abs(mytstat),lengthx),6))
a<-table.row.end(a)
}
a<-table.end(a)
table.save(a,file='mytable.tab')
a<-table.start()
a<-table.row.start(a)
a<-table.element(a,'Partial Autocorrelation Function',4,TRUE)
a<-table.row.end(a)
a<-table.row.start(a)
a<-table.element(a,'Time lag k',header=TRUE)
a<-table.element(a,hyperlink('basics.htm','PACF(k)','click here for more information about the Partial Autocorrelation Function'),header=TRUE)
a<-table.element(a,'T-STAT',header=TRUE)
a<-table.element(a,'P-value',header=TRUE)
a<-table.row.end(a)
for (i in 1:par1) {
a<-table.row.start(a)
a<-table.element(a,i,header=TRUE)
a<-table.element(a,round(mypacf[i],6))
mytstat <- mypacf[i]*sqrtn
a<-table.element(a,round(mytstat,4))
a<-table.element(a,round(1-pt(abs(mytstat),lengthx),6))
a<-table.row.end(a)
}
a<-table.end(a)
table.save(a,file='mytable1.tab')