Free Statistics

of Irreproducible Research!

Author's title

Author*Unverified author*
R Software Modulerwasp_autocorrelation.wasp
Title produced by software(Partial) Autocorrelation Function
Date of computationTue, 09 Dec 2008 10:35:17 -0700
Cite this page as followsStatistical Computations at FreeStatistics.org, Office for Research Development and Education, URL https://freestatistics.org/blog/index.php?v=date/2008/Dec/09/t1228844151id8kjhw7ww1ms9x.htm/, Retrieved Fri, 17 May 2024 05:45:54 +0000
Statistical Computations at FreeStatistics.org, Office for Research Development and Education, URL https://freestatistics.org/blog/index.php?pk=31616, Retrieved Fri, 17 May 2024 05:45:54 +0000
QR Codes:

Original text written by user:
IsPrivate?No (this computation is public)
User-defined keywords
Estimated Impact198
Family? (F = Feedback message, R = changed R code, M = changed R Module, P = changed Parameters, D = changed Data)
F     [(Partial) Autocorrelation Function] [paper bel20 autoc...] [2008-12-03 13:05:59] [f58cc3b532da25682c394745f1a82535]
-   PD  [(Partial) Autocorrelation Function] [paper variance re...] [2008-12-03 14:08:24] [f58cc3b532da25682c394745f1a82535]
- RM      [Spectral Analysis] [paper spectral an...] [2008-12-03 14:40:03] [f58cc3b532da25682c394745f1a82535]
-   P       [Spectral Analysis] [] [2008-12-07 15:17:33] [74be16979710d4c4e7c6647856088456]
- RMP           [(Partial) Autocorrelation Function] [] [2008-12-09 17:35:17] [441cddd6b019c6452f1399cb0038dc92] [Current]
Feedback Forum

Post a new message
Dataseries X:
2659.81
2638.53
2720.25
2745.88
2735.7
2811.7
2799.43
2555.28
2304.98
2214.95
2065.81
1940.49
2042
1995.37
1946.81
1765.9
1635.25
1833.42
1910.43
1959.67
1969.6
2061.41
2093.48
2120.88
2174.56
2196.72
2350.44
2440.25
2408.64
2472.81
2407.6
2454.62
2448.05
2497.84
2645.64
2756.76
2849.27
2921.44
2981.85
3080.58
3106.22
3119.31
3061.26
3097.31
3161.69
3257.16
3277.01
3295.32
3363.99
3494.17
3667.03
3813.06
3917.96
3895.51
3801.06
3570.12
3701.61
3862.27
3970.1
4138.52
4199.75
4290.89
4443.91
4502.64
4356.98
4591.27
4696.96
4621.4
4562.84
4202.52
4296.49
4435.23
4105.18
4116.68
3844.49
3720.98
3674.4
3857.62
3801.06
3504.37
3032.6
3047.03


Summary of computational transaction
Raw Inputview raw input (R code)
Raw Outputview raw output of R engine
Computing time2 seconds
R Server'Sir Ronald Aylmer Fisher' @ 193.190.124.24

\begin{tabular}{lllllllll}
\hline
Summary of computational transaction \tabularnewline
Raw Input & view raw input (R code)  \tabularnewline
Raw Output & view raw output of R engine  \tabularnewline
Computing time & 2 seconds \tabularnewline
R Server & 'Sir Ronald Aylmer Fisher' @ 193.190.124.24 \tabularnewline
\hline
\end{tabular}
%Source: https://freestatistics.org/blog/index.php?pk=31616&T=0

[TABLE]
[ROW][C]Summary of computational transaction[/C][/ROW]
[ROW][C]Raw Input[/C][C]view raw input (R code) [/C][/ROW]
[ROW][C]Raw Output[/C][C]view raw output of R engine [/C][/ROW]
[ROW][C]Computing time[/C][C]2 seconds[/C][/ROW]
[ROW][C]R Server[/C][C]'Sir Ronald Aylmer Fisher' @ 193.190.124.24[/C][/ROW]
[/TABLE]
Source: https://freestatistics.org/blog/index.php?pk=31616&T=0

Globally Unique Identifier (entire table): ba.freestatistics.org/blog/index.php?pk=31616&T=0

As an alternative you can also use a QR Code:  

The GUIDs for individual cells are displayed in the table below:

Summary of computational transaction
Raw Inputview raw input (R code)
Raw Outputview raw output of R engine
Computing time2 seconds
R Server'Sir Ronald Aylmer Fisher' @ 193.190.124.24


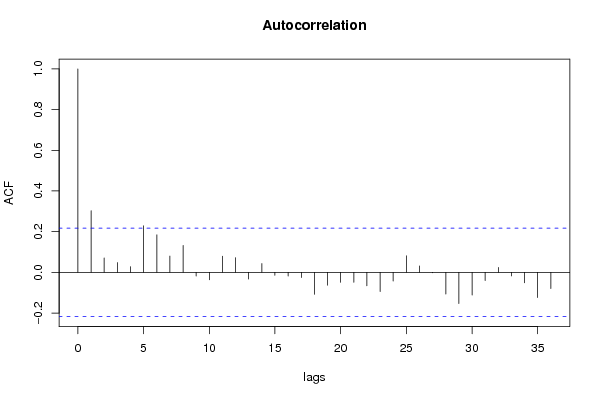
Autocorrelation Function
Time lag kACF(k)T-STATP-value
10.3033182.72990.003886
20.0705880.63530.263513
30.048020.43220.333378
40.0274720.24730.40267
50.2287492.05870.021366
60.1844471.660.050389
70.079820.71840.237295
80.1321521.18940.118884
9-0.017672-0.1590.437013
10-0.036793-0.33110.370698
110.079550.7160.238039
120.0721680.64950.258921
13-0.032652-0.29390.384807
140.0431370.38820.349432
15-0.01412-0.12710.449595
16-0.017794-0.16010.436584
17-0.025311-0.22780.410188
18-0.107988-0.97190.166998
19-0.063074-0.56770.285915
20-0.048558-0.4370.331628
21-0.048844-0.43960.3307
22-0.065709-0.59140.277957
23-0.094699-0.85230.198284
24-0.04303-0.38730.349785
250.0810970.72990.233787
260.0314640.28320.388882
27-0.001884-0.0170.493256
28-0.106489-0.95840.170357
29-0.153129-1.37820.085975
30-0.11142-1.00280.159477
31-0.04025-0.36230.359053
320.0242070.21790.414042
33-0.017452-0.15710.43779
34-0.050995-0.4590.323747
35-0.123795-1.11420.134255
36-0.079283-0.71350.238779

\begin{tabular}{lllllllll}
\hline
Autocorrelation Function \tabularnewline
Time lag k & ACF(k) & T-STAT & P-value \tabularnewline
1 & 0.303318 & 2.7299 & 0.003886 \tabularnewline
2 & 0.070588 & 0.6353 & 0.263513 \tabularnewline
3 & 0.04802 & 0.4322 & 0.333378 \tabularnewline
4 & 0.027472 & 0.2473 & 0.40267 \tabularnewline
5 & 0.228749 & 2.0587 & 0.021366 \tabularnewline
6 & 0.184447 & 1.66 & 0.050389 \tabularnewline
7 & 0.07982 & 0.7184 & 0.237295 \tabularnewline
8 & 0.132152 & 1.1894 & 0.118884 \tabularnewline
9 & -0.017672 & -0.159 & 0.437013 \tabularnewline
10 & -0.036793 & -0.3311 & 0.370698 \tabularnewline
11 & 0.07955 & 0.716 & 0.238039 \tabularnewline
12 & 0.072168 & 0.6495 & 0.258921 \tabularnewline
13 & -0.032652 & -0.2939 & 0.384807 \tabularnewline
14 & 0.043137 & 0.3882 & 0.349432 \tabularnewline
15 & -0.01412 & -0.1271 & 0.449595 \tabularnewline
16 & -0.017794 & -0.1601 & 0.436584 \tabularnewline
17 & -0.025311 & -0.2278 & 0.410188 \tabularnewline
18 & -0.107988 & -0.9719 & 0.166998 \tabularnewline
19 & -0.063074 & -0.5677 & 0.285915 \tabularnewline
20 & -0.048558 & -0.437 & 0.331628 \tabularnewline
21 & -0.048844 & -0.4396 & 0.3307 \tabularnewline
22 & -0.065709 & -0.5914 & 0.277957 \tabularnewline
23 & -0.094699 & -0.8523 & 0.198284 \tabularnewline
24 & -0.04303 & -0.3873 & 0.349785 \tabularnewline
25 & 0.081097 & 0.7299 & 0.233787 \tabularnewline
26 & 0.031464 & 0.2832 & 0.388882 \tabularnewline
27 & -0.001884 & -0.017 & 0.493256 \tabularnewline
28 & -0.106489 & -0.9584 & 0.170357 \tabularnewline
29 & -0.153129 & -1.3782 & 0.085975 \tabularnewline
30 & -0.11142 & -1.0028 & 0.159477 \tabularnewline
31 & -0.04025 & -0.3623 & 0.359053 \tabularnewline
32 & 0.024207 & 0.2179 & 0.414042 \tabularnewline
33 & -0.017452 & -0.1571 & 0.43779 \tabularnewline
34 & -0.050995 & -0.459 & 0.323747 \tabularnewline
35 & -0.123795 & -1.1142 & 0.134255 \tabularnewline
36 & -0.079283 & -0.7135 & 0.238779 \tabularnewline
\hline
\end{tabular}
%Source: https://freestatistics.org/blog/index.php?pk=31616&T=1

[TABLE]
[ROW][C]Autocorrelation Function[/C][/ROW]
[ROW][C]Time lag k[/C][C]ACF(k)[/C][C]T-STAT[/C][C]P-value[/C][/ROW]
[ROW][C]1[/C][C]0.303318[/C][C]2.7299[/C][C]0.003886[/C][/ROW]
[ROW][C]2[/C][C]0.070588[/C][C]0.6353[/C][C]0.263513[/C][/ROW]
[ROW][C]3[/C][C]0.04802[/C][C]0.4322[/C][C]0.333378[/C][/ROW]
[ROW][C]4[/C][C]0.027472[/C][C]0.2473[/C][C]0.40267[/C][/ROW]
[ROW][C]5[/C][C]0.228749[/C][C]2.0587[/C][C]0.021366[/C][/ROW]
[ROW][C]6[/C][C]0.184447[/C][C]1.66[/C][C]0.050389[/C][/ROW]
[ROW][C]7[/C][C]0.07982[/C][C]0.7184[/C][C]0.237295[/C][/ROW]
[ROW][C]8[/C][C]0.132152[/C][C]1.1894[/C][C]0.118884[/C][/ROW]
[ROW][C]9[/C][C]-0.017672[/C][C]-0.159[/C][C]0.437013[/C][/ROW]
[ROW][C]10[/C][C]-0.036793[/C][C]-0.3311[/C][C]0.370698[/C][/ROW]
[ROW][C]11[/C][C]0.07955[/C][C]0.716[/C][C]0.238039[/C][/ROW]
[ROW][C]12[/C][C]0.072168[/C][C]0.6495[/C][C]0.258921[/C][/ROW]
[ROW][C]13[/C][C]-0.032652[/C][C]-0.2939[/C][C]0.384807[/C][/ROW]
[ROW][C]14[/C][C]0.043137[/C][C]0.3882[/C][C]0.349432[/C][/ROW]
[ROW][C]15[/C][C]-0.01412[/C][C]-0.1271[/C][C]0.449595[/C][/ROW]
[ROW][C]16[/C][C]-0.017794[/C][C]-0.1601[/C][C]0.436584[/C][/ROW]
[ROW][C]17[/C][C]-0.025311[/C][C]-0.2278[/C][C]0.410188[/C][/ROW]
[ROW][C]18[/C][C]-0.107988[/C][C]-0.9719[/C][C]0.166998[/C][/ROW]
[ROW][C]19[/C][C]-0.063074[/C][C]-0.5677[/C][C]0.285915[/C][/ROW]
[ROW][C]20[/C][C]-0.048558[/C][C]-0.437[/C][C]0.331628[/C][/ROW]
[ROW][C]21[/C][C]-0.048844[/C][C]-0.4396[/C][C]0.3307[/C][/ROW]
[ROW][C]22[/C][C]-0.065709[/C][C]-0.5914[/C][C]0.277957[/C][/ROW]
[ROW][C]23[/C][C]-0.094699[/C][C]-0.8523[/C][C]0.198284[/C][/ROW]
[ROW][C]24[/C][C]-0.04303[/C][C]-0.3873[/C][C]0.349785[/C][/ROW]
[ROW][C]25[/C][C]0.081097[/C][C]0.7299[/C][C]0.233787[/C][/ROW]
[ROW][C]26[/C][C]0.031464[/C][C]0.2832[/C][C]0.388882[/C][/ROW]
[ROW][C]27[/C][C]-0.001884[/C][C]-0.017[/C][C]0.493256[/C][/ROW]
[ROW][C]28[/C][C]-0.106489[/C][C]-0.9584[/C][C]0.170357[/C][/ROW]
[ROW][C]29[/C][C]-0.153129[/C][C]-1.3782[/C][C]0.085975[/C][/ROW]
[ROW][C]30[/C][C]-0.11142[/C][C]-1.0028[/C][C]0.159477[/C][/ROW]
[ROW][C]31[/C][C]-0.04025[/C][C]-0.3623[/C][C]0.359053[/C][/ROW]
[ROW][C]32[/C][C]0.024207[/C][C]0.2179[/C][C]0.414042[/C][/ROW]
[ROW][C]33[/C][C]-0.017452[/C][C]-0.1571[/C][C]0.43779[/C][/ROW]
[ROW][C]34[/C][C]-0.050995[/C][C]-0.459[/C][C]0.323747[/C][/ROW]
[ROW][C]35[/C][C]-0.123795[/C][C]-1.1142[/C][C]0.134255[/C][/ROW]
[ROW][C]36[/C][C]-0.079283[/C][C]-0.7135[/C][C]0.238779[/C][/ROW]
[/TABLE]
Source: https://freestatistics.org/blog/index.php?pk=31616&T=1

Globally Unique Identifier (entire table): ba.freestatistics.org/blog/index.php?pk=31616&T=1

As an alternative you can also use a QR Code:  

The GUIDs for individual cells are displayed in the table below:

Autocorrelation Function
Time lag kACF(k)T-STATP-value
10.3033182.72990.003886
20.0705880.63530.263513
30.048020.43220.333378
40.0274720.24730.40267
50.2287492.05870.021366
60.1844471.660.050389
70.079820.71840.237295
80.1321521.18940.118884
9-0.017672-0.1590.437013
10-0.036793-0.33110.370698
110.079550.7160.238039
120.0721680.64950.258921
13-0.032652-0.29390.384807
140.0431370.38820.349432
15-0.01412-0.12710.449595
16-0.017794-0.16010.436584
17-0.025311-0.22780.410188
18-0.107988-0.97190.166998
19-0.063074-0.56770.285915
20-0.048558-0.4370.331628
21-0.048844-0.43960.3307
22-0.065709-0.59140.277957
23-0.094699-0.85230.198284
24-0.04303-0.38730.349785
250.0810970.72990.233787
260.0314640.28320.388882
27-0.001884-0.0170.493256
28-0.106489-0.95840.170357
29-0.153129-1.37820.085975
30-0.11142-1.00280.159477
31-0.04025-0.36230.359053
320.0242070.21790.414042
33-0.017452-0.15710.43779
34-0.050995-0.4590.323747
35-0.123795-1.11420.134255
36-0.079283-0.71350.238779


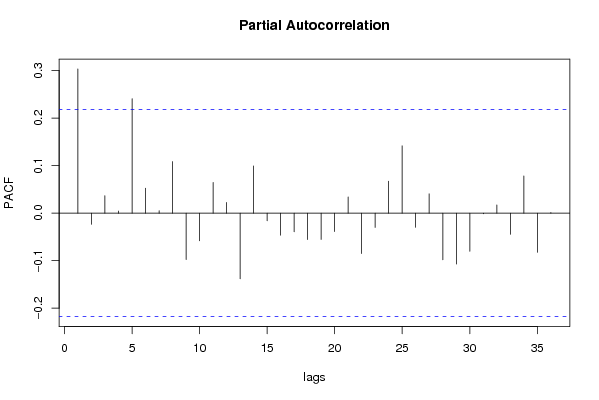
Partial Autocorrelation Function
Time lag kPACF(k)T-STATP-value
10.3033182.72990.003886
2-0.023583-0.21220.416223
30.0366480.32980.371189
40.0042740.03850.484704
50.2406412.16580.016635
60.0522210.470.319814
70.0052350.04710.48127
80.1084330.97590.16601
9-0.09757-0.87810.191235
10-0.058242-0.52420.300792
110.0643570.57920.282025
120.0223980.20160.420376
13-0.138289-1.24460.108433
140.0990240.89120.187727
15-0.015986-0.14390.442977
16-0.046316-0.41680.338946
17-0.039254-0.35330.362396
18-0.055475-0.49930.30947
19-0.055246-0.49720.310191
20-0.038753-0.34880.36408
210.0338860.3050.380583
22-0.085091-0.76580.223005
23-0.030043-0.27040.393777
240.0672080.60490.273476
250.1414981.27350.103244
26-0.029813-0.26830.394568
270.0405150.36460.358168
28-0.098014-0.88210.190159
29-0.107079-0.96370.169029
30-0.080419-0.72380.235645
31-0.001476-0.01330.494716
320.0170650.15360.43916
33-0.044667-0.4020.34437
340.0781390.70320.241959
35-0.082511-0.74260.229938
360.0011870.01070.495751

\begin{tabular}{lllllllll}
\hline
Partial Autocorrelation Function \tabularnewline
Time lag k & PACF(k) & T-STAT & P-value \tabularnewline
1 & 0.303318 & 2.7299 & 0.003886 \tabularnewline
2 & -0.023583 & -0.2122 & 0.416223 \tabularnewline
3 & 0.036648 & 0.3298 & 0.371189 \tabularnewline
4 & 0.004274 & 0.0385 & 0.484704 \tabularnewline
5 & 0.240641 & 2.1658 & 0.016635 \tabularnewline
6 & 0.052221 & 0.47 & 0.319814 \tabularnewline
7 & 0.005235 & 0.0471 & 0.48127 \tabularnewline
8 & 0.108433 & 0.9759 & 0.16601 \tabularnewline
9 & -0.09757 & -0.8781 & 0.191235 \tabularnewline
10 & -0.058242 & -0.5242 & 0.300792 \tabularnewline
11 & 0.064357 & 0.5792 & 0.282025 \tabularnewline
12 & 0.022398 & 0.2016 & 0.420376 \tabularnewline
13 & -0.138289 & -1.2446 & 0.108433 \tabularnewline
14 & 0.099024 & 0.8912 & 0.187727 \tabularnewline
15 & -0.015986 & -0.1439 & 0.442977 \tabularnewline
16 & -0.046316 & -0.4168 & 0.338946 \tabularnewline
17 & -0.039254 & -0.3533 & 0.362396 \tabularnewline
18 & -0.055475 & -0.4993 & 0.30947 \tabularnewline
19 & -0.055246 & -0.4972 & 0.310191 \tabularnewline
20 & -0.038753 & -0.3488 & 0.36408 \tabularnewline
21 & 0.033886 & 0.305 & 0.380583 \tabularnewline
22 & -0.085091 & -0.7658 & 0.223005 \tabularnewline
23 & -0.030043 & -0.2704 & 0.393777 \tabularnewline
24 & 0.067208 & 0.6049 & 0.273476 \tabularnewline
25 & 0.141498 & 1.2735 & 0.103244 \tabularnewline
26 & -0.029813 & -0.2683 & 0.394568 \tabularnewline
27 & 0.040515 & 0.3646 & 0.358168 \tabularnewline
28 & -0.098014 & -0.8821 & 0.190159 \tabularnewline
29 & -0.107079 & -0.9637 & 0.169029 \tabularnewline
30 & -0.080419 & -0.7238 & 0.235645 \tabularnewline
31 & -0.001476 & -0.0133 & 0.494716 \tabularnewline
32 & 0.017065 & 0.1536 & 0.43916 \tabularnewline
33 & -0.044667 & -0.402 & 0.34437 \tabularnewline
34 & 0.078139 & 0.7032 & 0.241959 \tabularnewline
35 & -0.082511 & -0.7426 & 0.229938 \tabularnewline
36 & 0.001187 & 0.0107 & 0.495751 \tabularnewline
\hline
\end{tabular}
%Source: https://freestatistics.org/blog/index.php?pk=31616&T=2

[TABLE]
[ROW][C]Partial Autocorrelation Function[/C][/ROW]
[ROW][C]Time lag k[/C][C]PACF(k)[/C][C]T-STAT[/C][C]P-value[/C][/ROW]
[ROW][C]1[/C][C]0.303318[/C][C]2.7299[/C][C]0.003886[/C][/ROW]
[ROW][C]2[/C][C]-0.023583[/C][C]-0.2122[/C][C]0.416223[/C][/ROW]
[ROW][C]3[/C][C]0.036648[/C][C]0.3298[/C][C]0.371189[/C][/ROW]
[ROW][C]4[/C][C]0.004274[/C][C]0.0385[/C][C]0.484704[/C][/ROW]
[ROW][C]5[/C][C]0.240641[/C][C]2.1658[/C][C]0.016635[/C][/ROW]
[ROW][C]6[/C][C]0.052221[/C][C]0.47[/C][C]0.319814[/C][/ROW]
[ROW][C]7[/C][C]0.005235[/C][C]0.0471[/C][C]0.48127[/C][/ROW]
[ROW][C]8[/C][C]0.108433[/C][C]0.9759[/C][C]0.16601[/C][/ROW]
[ROW][C]9[/C][C]-0.09757[/C][C]-0.8781[/C][C]0.191235[/C][/ROW]
[ROW][C]10[/C][C]-0.058242[/C][C]-0.5242[/C][C]0.300792[/C][/ROW]
[ROW][C]11[/C][C]0.064357[/C][C]0.5792[/C][C]0.282025[/C][/ROW]
[ROW][C]12[/C][C]0.022398[/C][C]0.2016[/C][C]0.420376[/C][/ROW]
[ROW][C]13[/C][C]-0.138289[/C][C]-1.2446[/C][C]0.108433[/C][/ROW]
[ROW][C]14[/C][C]0.099024[/C][C]0.8912[/C][C]0.187727[/C][/ROW]
[ROW][C]15[/C][C]-0.015986[/C][C]-0.1439[/C][C]0.442977[/C][/ROW]
[ROW][C]16[/C][C]-0.046316[/C][C]-0.4168[/C][C]0.338946[/C][/ROW]
[ROW][C]17[/C][C]-0.039254[/C][C]-0.3533[/C][C]0.362396[/C][/ROW]
[ROW][C]18[/C][C]-0.055475[/C][C]-0.4993[/C][C]0.30947[/C][/ROW]
[ROW][C]19[/C][C]-0.055246[/C][C]-0.4972[/C][C]0.310191[/C][/ROW]
[ROW][C]20[/C][C]-0.038753[/C][C]-0.3488[/C][C]0.36408[/C][/ROW]
[ROW][C]21[/C][C]0.033886[/C][C]0.305[/C][C]0.380583[/C][/ROW]
[ROW][C]22[/C][C]-0.085091[/C][C]-0.7658[/C][C]0.223005[/C][/ROW]
[ROW][C]23[/C][C]-0.030043[/C][C]-0.2704[/C][C]0.393777[/C][/ROW]
[ROW][C]24[/C][C]0.067208[/C][C]0.6049[/C][C]0.273476[/C][/ROW]
[ROW][C]25[/C][C]0.141498[/C][C]1.2735[/C][C]0.103244[/C][/ROW]
[ROW][C]26[/C][C]-0.029813[/C][C]-0.2683[/C][C]0.394568[/C][/ROW]
[ROW][C]27[/C][C]0.040515[/C][C]0.3646[/C][C]0.358168[/C][/ROW]
[ROW][C]28[/C][C]-0.098014[/C][C]-0.8821[/C][C]0.190159[/C][/ROW]
[ROW][C]29[/C][C]-0.107079[/C][C]-0.9637[/C][C]0.169029[/C][/ROW]
[ROW][C]30[/C][C]-0.080419[/C][C]-0.7238[/C][C]0.235645[/C][/ROW]
[ROW][C]31[/C][C]-0.001476[/C][C]-0.0133[/C][C]0.494716[/C][/ROW]
[ROW][C]32[/C][C]0.017065[/C][C]0.1536[/C][C]0.43916[/C][/ROW]
[ROW][C]33[/C][C]-0.044667[/C][C]-0.402[/C][C]0.34437[/C][/ROW]
[ROW][C]34[/C][C]0.078139[/C][C]0.7032[/C][C]0.241959[/C][/ROW]
[ROW][C]35[/C][C]-0.082511[/C][C]-0.7426[/C][C]0.229938[/C][/ROW]
[ROW][C]36[/C][C]0.001187[/C][C]0.0107[/C][C]0.495751[/C][/ROW]
[/TABLE]
Source: https://freestatistics.org/blog/index.php?pk=31616&T=2

Globally Unique Identifier (entire table): ba.freestatistics.org/blog/index.php?pk=31616&T=2

As an alternative you can also use a QR Code:  

The GUIDs for individual cells are displayed in the table below:

Partial Autocorrelation Function
Time lag kPACF(k)T-STATP-value
10.3033182.72990.003886
2-0.023583-0.21220.416223
30.0366480.32980.371189
40.0042740.03850.484704
50.2406412.16580.016635
60.0522210.470.319814
70.0052350.04710.48127
80.1084330.97590.16601
9-0.09757-0.87810.191235
10-0.058242-0.52420.300792
110.0643570.57920.282025
120.0223980.20160.420376
13-0.138289-1.24460.108433
140.0990240.89120.187727
15-0.015986-0.14390.442977
16-0.046316-0.41680.338946
17-0.039254-0.35330.362396
18-0.055475-0.49930.30947
19-0.055246-0.49720.310191
20-0.038753-0.34880.36408
210.0338860.3050.380583
22-0.085091-0.76580.223005
23-0.030043-0.27040.393777
240.0672080.60490.273476
250.1414981.27350.103244
26-0.029813-0.26830.394568
270.0405150.36460.358168
28-0.098014-0.88210.190159
29-0.107079-0.96370.169029
30-0.080419-0.72380.235645
31-0.001476-0.01330.494716
320.0170650.15360.43916
33-0.044667-0.4020.34437
340.0781390.70320.241959
35-0.082511-0.74260.229938
360.0011870.01070.495751


Parameters (Session):
par1 = 36 ; par2 = 1 ; par3 = 1 ; par4 = 0 ; par5 = 12 ;
Parameters (R input):
par1 = 36 ; par2 = 1 ; par3 = 1 ; par4 = 0 ; par5 = 12 ;
R code (references can be found in the software module):
if (par1 == 'Default') {
par1 = 10*log10(length(x))
} else {
par1 <- as.numeric(par1)
}
par2 <- as.numeric(par2)
par3 <- as.numeric(par3)
par4 <- as.numeric(par4)
par5 <- as.numeric(par5)
if (par2 == 0) {
x <- log(x)
} else {
x <- (x ^ par2 - 1) / par2
}
if (par3 > 0) x <- diff(x,lag=1,difference=par3)
if (par4 > 0) x <- diff(x,lag=par5,difference=par4)
bitmap(file='pic1.png')
racf <- acf(x,par1,main='Autocorrelation',xlab='lags',ylab='ACF')
dev.off()
bitmap(file='pic2.png')
rpacf <- pacf(x,par1,main='Partial Autocorrelation',xlab='lags',ylab='PACF')
dev.off()
(myacf <- c(racf$acf))
(mypacf <- c(rpacf$acf))
lengthx <- length(x)
sqrtn <- sqrt(lengthx)
load(file='createtable')
a<-table.start()
a<-table.row.start(a)
a<-table.element(a,'Autocorrelation Function',4,TRUE)
a<-table.row.end(a)
a<-table.row.start(a)
a<-table.element(a,'Time lag k',header=TRUE)
a<-table.element(a,hyperlink('basics.htm','ACF(k)','click here for more information about the Autocorrelation Function'),header=TRUE)
a<-table.element(a,'T-STAT',header=TRUE)
a<-table.element(a,'P-value',header=TRUE)
a<-table.row.end(a)
for (i in 2:(par1+1)) {
a<-table.row.start(a)
a<-table.element(a,i-1,header=TRUE)
a<-table.element(a,round(myacf[i],6))
mytstat <- myacf[i]*sqrtn
a<-table.element(a,round(mytstat,4))
a<-table.element(a,round(1-pt(abs(mytstat),lengthx),6))
a<-table.row.end(a)
}
a<-table.end(a)
table.save(a,file='mytable.tab')
a<-table.start()
a<-table.row.start(a)
a<-table.element(a,'Partial Autocorrelation Function',4,TRUE)
a<-table.row.end(a)
a<-table.row.start(a)
a<-table.element(a,'Time lag k',header=TRUE)
a<-table.element(a,hyperlink('basics.htm','PACF(k)','click here for more information about the Partial Autocorrelation Function'),header=TRUE)
a<-table.element(a,'T-STAT',header=TRUE)
a<-table.element(a,'P-value',header=TRUE)
a<-table.row.end(a)
for (i in 1:par1) {
a<-table.row.start(a)
a<-table.element(a,i,header=TRUE)
a<-table.element(a,round(mypacf[i],6))
mytstat <- mypacf[i]*sqrtn
a<-table.element(a,round(mytstat,4))
a<-table.element(a,round(1-pt(abs(mytstat),lengthx),6))
a<-table.row.end(a)
}
a<-table.end(a)
table.save(a,file='mytable1.tab')