Free Statistics

of Irreproducible Research!

Author's title

Author*Unverified author*
R Software Modulerwasp_autocorrelation.wasp
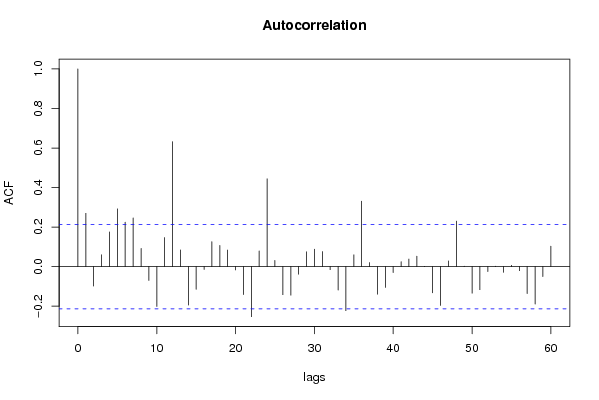
Title produced by software(Partial) Autocorrelation Function
Date of computationTue, 09 Dec 2008 10:11:58 -0700
Cite this page as followsStatistical Computations at FreeStatistics.org, Office for Research Development and Education, URL https://freestatistics.org/blog/index.php?v=date/2008/Dec/09/t1228842903ucmrzz93jt5zh57.htm/, Retrieved Fri, 17 May 2024 07:01:32 +0000
Statistical Computations at FreeStatistics.org, Office for Research Development and Education, URL https://freestatistics.org/blog/index.php?pk=31599, Retrieved Fri, 17 May 2024 07:01:32 +0000
QR Codes:

Original text written by user:
IsPrivate?No (this computation is public)
User-defined keywords
Estimated Impact150
Family? (F = Feedback message, R = changed R code, M = changed R Module, P = changed Parameters, D = changed Data)
F       [(Partial) Autocorrelation Function] [Toon Wouters] [2008-12-09 17:11:58] [14e94996a4178d938cb12bed20a4a373] [Current]
Feedback Forum
2008-12-15 18:46:16 [Steven Vercammen] [reply
Dit is correct. We zien een duidelijke seizonaliteit (pieken bij lag 12, 24, 36,...).


Post a new message
Dataseries X:
94
118.6
135
132.7
110.1
111
159.4
129.9
124.8
140.5
120.6
121.6
107.3
130.7
134.9
128.3
99.8
96.7
134.1
131.6
118
133.2
109.3
111.9
98.3
116.3
113.6
121.3
93.7
92.3
132
114.3
123.1
117.3
106
107.5
104.3
112.6
113.9
132.8
88.8
97.7
131.2
116.1
124.7
128.2
105
102.3
98.4
111.1
125.3
123.6
86.7
100.6
123.3
112.2
120.8
114.8
107.3
107.5
93.1
112.4
127.9
120.7
91
98.5
118.9
113.8
113.8
118.7
105.1
101.4
84.1
107.2
119.9
105.4
88.6
90.5
108.5
104.7
100
113.1
96.7
98.5


Summary of computational transaction
Raw Inputview raw input (R code)
Raw Outputview raw output of R engine
Computing time1 seconds
R Server'George Udny Yule' @ 72.249.76.132

\begin{tabular}{lllllllll}
\hline
Summary of computational transaction \tabularnewline
Raw Input & view raw input (R code)  \tabularnewline
Raw Output & view raw output of R engine  \tabularnewline
Computing time & 1 seconds \tabularnewline
R Server & 'George Udny Yule' @ 72.249.76.132 \tabularnewline
\hline
\end{tabular}
%Source: https://freestatistics.org/blog/index.php?pk=31599&T=0

[TABLE]
[ROW][C]Summary of computational transaction[/C][/ROW]
[ROW][C]Raw Input[/C][C]view raw input (R code) [/C][/ROW]
[ROW][C]Raw Output[/C][C]view raw output of R engine [/C][/ROW]
[ROW][C]Computing time[/C][C]1 seconds[/C][/ROW]
[ROW][C]R Server[/C][C]'George Udny Yule' @ 72.249.76.132[/C][/ROW]
[/TABLE]
Source: https://freestatistics.org/blog/index.php?pk=31599&T=0

Globally Unique Identifier (entire table): ba.freestatistics.org/blog/index.php?pk=31599&T=0

As an alternative you can also use a QR Code:  

The GUIDs for individual cells are displayed in the table below:

Summary of computational transaction
Raw Inputview raw input (R code)
Raw Outputview raw output of R engine
Computing time1 seconds
R Server'George Udny Yule' @ 72.249.76.132


Autocorrelation Function
Time lag kACF(k)T-STATP-value
10.2699612.47420.007682
2-0.09848-0.90260.184663
30.0600430.55030.291786
40.1755561.6090.055685
50.2921262.67740.004461
60.2245442.0580.021346
70.2460062.25470.013377
80.0920690.84380.200581
9-0.069846-0.64010.261909
10-0.201601-1.84770.034082
110.1469991.34730.090759
120.6319445.79190
130.0843440.7730.220839
14-0.194548-1.78310.039094
15-0.114834-1.05250.1478
16-0.014606-0.13390.446916
170.1261121.15580.125512
180.1070480.98110.164678
190.0839650.76950.221863
20-0.016522-0.15140.440001
21-0.141402-1.2960.099267
22-0.253145-2.32010.01138
230.0794280.7280.234329
240.443934.06875.3e-05
250.0311520.28550.387977
26-0.142052-1.30190.09825
27-0.144327-1.32280.09475
28-0.03809-0.34910.363945
290.0746660.68430.247827
300.0879460.8060.211248
310.0764660.70080.242674
32-0.015355-0.14070.444212
33-0.118556-1.08660.140164
34-0.222906-2.0430.022095
350.060040.55030.291796
360.3309833.03350.001608
370.0207180.18990.424928
38-0.139682-1.28020.101998
39-0.105461-0.96660.168269
40-0.029959-0.27460.392158
410.0248930.22810.410043
420.0381310.34950.363803
430.0526970.4830.315185
440.0014680.01350.494649
45-0.132395-1.21340.114185
46-0.196737-1.80310.037477
470.0287110.26310.396544
480.2301432.10930.018948
490.0021810.020.49205
50-0.134603-1.23370.110385
51-0.117068-1.07290.143184
52-0.025163-0.23060.409083
530.0018770.01720.493158
54-0.028855-0.26450.396035
550.0067660.0620.475352
56-0.020848-0.19110.424464
57-0.136143-1.24780.107791
58-0.189491-1.73670.043052
59-0.05032-0.46120.322927
600.1033680.94740.173079

\begin{tabular}{lllllllll}
\hline
Autocorrelation Function \tabularnewline
Time lag k & ACF(k) & T-STAT & P-value \tabularnewline
1 & 0.269961 & 2.4742 & 0.007682 \tabularnewline
2 & -0.09848 & -0.9026 & 0.184663 \tabularnewline
3 & 0.060043 & 0.5503 & 0.291786 \tabularnewline
4 & 0.175556 & 1.609 & 0.055685 \tabularnewline
5 & 0.292126 & 2.6774 & 0.004461 \tabularnewline
6 & 0.224544 & 2.058 & 0.021346 \tabularnewline
7 & 0.246006 & 2.2547 & 0.013377 \tabularnewline
8 & 0.092069 & 0.8438 & 0.200581 \tabularnewline
9 & -0.069846 & -0.6401 & 0.261909 \tabularnewline
10 & -0.201601 & -1.8477 & 0.034082 \tabularnewline
11 & 0.146999 & 1.3473 & 0.090759 \tabularnewline
12 & 0.631944 & 5.7919 & 0 \tabularnewline
13 & 0.084344 & 0.773 & 0.220839 \tabularnewline
14 & -0.194548 & -1.7831 & 0.039094 \tabularnewline
15 & -0.114834 & -1.0525 & 0.1478 \tabularnewline
16 & -0.014606 & -0.1339 & 0.446916 \tabularnewline
17 & 0.126112 & 1.1558 & 0.125512 \tabularnewline
18 & 0.107048 & 0.9811 & 0.164678 \tabularnewline
19 & 0.083965 & 0.7695 & 0.221863 \tabularnewline
20 & -0.016522 & -0.1514 & 0.440001 \tabularnewline
21 & -0.141402 & -1.296 & 0.099267 \tabularnewline
22 & -0.253145 & -2.3201 & 0.01138 \tabularnewline
23 & 0.079428 & 0.728 & 0.234329 \tabularnewline
24 & 0.44393 & 4.0687 & 5.3e-05 \tabularnewline
25 & 0.031152 & 0.2855 & 0.387977 \tabularnewline
26 & -0.142052 & -1.3019 & 0.09825 \tabularnewline
27 & -0.144327 & -1.3228 & 0.09475 \tabularnewline
28 & -0.03809 & -0.3491 & 0.363945 \tabularnewline
29 & 0.074666 & 0.6843 & 0.247827 \tabularnewline
30 & 0.087946 & 0.806 & 0.211248 \tabularnewline
31 & 0.076466 & 0.7008 & 0.242674 \tabularnewline
32 & -0.015355 & -0.1407 & 0.444212 \tabularnewline
33 & -0.118556 & -1.0866 & 0.140164 \tabularnewline
34 & -0.222906 & -2.043 & 0.022095 \tabularnewline
35 & 0.06004 & 0.5503 & 0.291796 \tabularnewline
36 & 0.330983 & 3.0335 & 0.001608 \tabularnewline
37 & 0.020718 & 0.1899 & 0.424928 \tabularnewline
38 & -0.139682 & -1.2802 & 0.101998 \tabularnewline
39 & -0.105461 & -0.9666 & 0.168269 \tabularnewline
40 & -0.029959 & -0.2746 & 0.392158 \tabularnewline
41 & 0.024893 & 0.2281 & 0.410043 \tabularnewline
42 & 0.038131 & 0.3495 & 0.363803 \tabularnewline
43 & 0.052697 & 0.483 & 0.315185 \tabularnewline
44 & 0.001468 & 0.0135 & 0.494649 \tabularnewline
45 & -0.132395 & -1.2134 & 0.114185 \tabularnewline
46 & -0.196737 & -1.8031 & 0.037477 \tabularnewline
47 & 0.028711 & 0.2631 & 0.396544 \tabularnewline
48 & 0.230143 & 2.1093 & 0.018948 \tabularnewline
49 & 0.002181 & 0.02 & 0.49205 \tabularnewline
50 & -0.134603 & -1.2337 & 0.110385 \tabularnewline
51 & -0.117068 & -1.0729 & 0.143184 \tabularnewline
52 & -0.025163 & -0.2306 & 0.409083 \tabularnewline
53 & 0.001877 & 0.0172 & 0.493158 \tabularnewline
54 & -0.028855 & -0.2645 & 0.396035 \tabularnewline
55 & 0.006766 & 0.062 & 0.475352 \tabularnewline
56 & -0.020848 & -0.1911 & 0.424464 \tabularnewline
57 & -0.136143 & -1.2478 & 0.107791 \tabularnewline
58 & -0.189491 & -1.7367 & 0.043052 \tabularnewline
59 & -0.05032 & -0.4612 & 0.322927 \tabularnewline
60 & 0.103368 & 0.9474 & 0.173079 \tabularnewline
\hline
\end{tabular}
%Source: https://freestatistics.org/blog/index.php?pk=31599&T=1

[TABLE]
[ROW][C]Autocorrelation Function[/C][/ROW]
[ROW][C]Time lag k[/C][C]ACF(k)[/C][C]T-STAT[/C][C]P-value[/C][/ROW]
[ROW][C]1[/C][C]0.269961[/C][C]2.4742[/C][C]0.007682[/C][/ROW]
[ROW][C]2[/C][C]-0.09848[/C][C]-0.9026[/C][C]0.184663[/C][/ROW]
[ROW][C]3[/C][C]0.060043[/C][C]0.5503[/C][C]0.291786[/C][/ROW]
[ROW][C]4[/C][C]0.175556[/C][C]1.609[/C][C]0.055685[/C][/ROW]
[ROW][C]5[/C][C]0.292126[/C][C]2.6774[/C][C]0.004461[/C][/ROW]
[ROW][C]6[/C][C]0.224544[/C][C]2.058[/C][C]0.021346[/C][/ROW]
[ROW][C]7[/C][C]0.246006[/C][C]2.2547[/C][C]0.013377[/C][/ROW]
[ROW][C]8[/C][C]0.092069[/C][C]0.8438[/C][C]0.200581[/C][/ROW]
[ROW][C]9[/C][C]-0.069846[/C][C]-0.6401[/C][C]0.261909[/C][/ROW]
[ROW][C]10[/C][C]-0.201601[/C][C]-1.8477[/C][C]0.034082[/C][/ROW]
[ROW][C]11[/C][C]0.146999[/C][C]1.3473[/C][C]0.090759[/C][/ROW]
[ROW][C]12[/C][C]0.631944[/C][C]5.7919[/C][C]0[/C][/ROW]
[ROW][C]13[/C][C]0.084344[/C][C]0.773[/C][C]0.220839[/C][/ROW]
[ROW][C]14[/C][C]-0.194548[/C][C]-1.7831[/C][C]0.039094[/C][/ROW]
[ROW][C]15[/C][C]-0.114834[/C][C]-1.0525[/C][C]0.1478[/C][/ROW]
[ROW][C]16[/C][C]-0.014606[/C][C]-0.1339[/C][C]0.446916[/C][/ROW]
[ROW][C]17[/C][C]0.126112[/C][C]1.1558[/C][C]0.125512[/C][/ROW]
[ROW][C]18[/C][C]0.107048[/C][C]0.9811[/C][C]0.164678[/C][/ROW]
[ROW][C]19[/C][C]0.083965[/C][C]0.7695[/C][C]0.221863[/C][/ROW]
[ROW][C]20[/C][C]-0.016522[/C][C]-0.1514[/C][C]0.440001[/C][/ROW]
[ROW][C]21[/C][C]-0.141402[/C][C]-1.296[/C][C]0.099267[/C][/ROW]
[ROW][C]22[/C][C]-0.253145[/C][C]-2.3201[/C][C]0.01138[/C][/ROW]
[ROW][C]23[/C][C]0.079428[/C][C]0.728[/C][C]0.234329[/C][/ROW]
[ROW][C]24[/C][C]0.44393[/C][C]4.0687[/C][C]5.3e-05[/C][/ROW]
[ROW][C]25[/C][C]0.031152[/C][C]0.2855[/C][C]0.387977[/C][/ROW]
[ROW][C]26[/C][C]-0.142052[/C][C]-1.3019[/C][C]0.09825[/C][/ROW]
[ROW][C]27[/C][C]-0.144327[/C][C]-1.3228[/C][C]0.09475[/C][/ROW]
[ROW][C]28[/C][C]-0.03809[/C][C]-0.3491[/C][C]0.363945[/C][/ROW]
[ROW][C]29[/C][C]0.074666[/C][C]0.6843[/C][C]0.247827[/C][/ROW]
[ROW][C]30[/C][C]0.087946[/C][C]0.806[/C][C]0.211248[/C][/ROW]
[ROW][C]31[/C][C]0.076466[/C][C]0.7008[/C][C]0.242674[/C][/ROW]
[ROW][C]32[/C][C]-0.015355[/C][C]-0.1407[/C][C]0.444212[/C][/ROW]
[ROW][C]33[/C][C]-0.118556[/C][C]-1.0866[/C][C]0.140164[/C][/ROW]
[ROW][C]34[/C][C]-0.222906[/C][C]-2.043[/C][C]0.022095[/C][/ROW]
[ROW][C]35[/C][C]0.06004[/C][C]0.5503[/C][C]0.291796[/C][/ROW]
[ROW][C]36[/C][C]0.330983[/C][C]3.0335[/C][C]0.001608[/C][/ROW]
[ROW][C]37[/C][C]0.020718[/C][C]0.1899[/C][C]0.424928[/C][/ROW]
[ROW][C]38[/C][C]-0.139682[/C][C]-1.2802[/C][C]0.101998[/C][/ROW]
[ROW][C]39[/C][C]-0.105461[/C][C]-0.9666[/C][C]0.168269[/C][/ROW]
[ROW][C]40[/C][C]-0.029959[/C][C]-0.2746[/C][C]0.392158[/C][/ROW]
[ROW][C]41[/C][C]0.024893[/C][C]0.2281[/C][C]0.410043[/C][/ROW]
[ROW][C]42[/C][C]0.038131[/C][C]0.3495[/C][C]0.363803[/C][/ROW]
[ROW][C]43[/C][C]0.052697[/C][C]0.483[/C][C]0.315185[/C][/ROW]
[ROW][C]44[/C][C]0.001468[/C][C]0.0135[/C][C]0.494649[/C][/ROW]
[ROW][C]45[/C][C]-0.132395[/C][C]-1.2134[/C][C]0.114185[/C][/ROW]
[ROW][C]46[/C][C]-0.196737[/C][C]-1.8031[/C][C]0.037477[/C][/ROW]
[ROW][C]47[/C][C]0.028711[/C][C]0.2631[/C][C]0.396544[/C][/ROW]
[ROW][C]48[/C][C]0.230143[/C][C]2.1093[/C][C]0.018948[/C][/ROW]
[ROW][C]49[/C][C]0.002181[/C][C]0.02[/C][C]0.49205[/C][/ROW]
[ROW][C]50[/C][C]-0.134603[/C][C]-1.2337[/C][C]0.110385[/C][/ROW]
[ROW][C]51[/C][C]-0.117068[/C][C]-1.0729[/C][C]0.143184[/C][/ROW]
[ROW][C]52[/C][C]-0.025163[/C][C]-0.2306[/C][C]0.409083[/C][/ROW]
[ROW][C]53[/C][C]0.001877[/C][C]0.0172[/C][C]0.493158[/C][/ROW]
[ROW][C]54[/C][C]-0.028855[/C][C]-0.2645[/C][C]0.396035[/C][/ROW]
[ROW][C]55[/C][C]0.006766[/C][C]0.062[/C][C]0.475352[/C][/ROW]
[ROW][C]56[/C][C]-0.020848[/C][C]-0.1911[/C][C]0.424464[/C][/ROW]
[ROW][C]57[/C][C]-0.136143[/C][C]-1.2478[/C][C]0.107791[/C][/ROW]
[ROW][C]58[/C][C]-0.189491[/C][C]-1.7367[/C][C]0.043052[/C][/ROW]
[ROW][C]59[/C][C]-0.05032[/C][C]-0.4612[/C][C]0.322927[/C][/ROW]
[ROW][C]60[/C][C]0.103368[/C][C]0.9474[/C][C]0.173079[/C][/ROW]
[/TABLE]
Source: https://freestatistics.org/blog/index.php?pk=31599&T=1

Globally Unique Identifier (entire table): ba.freestatistics.org/blog/index.php?pk=31599&T=1

As an alternative you can also use a QR Code:  

The GUIDs for individual cells are displayed in the table below:

Autocorrelation Function
Time lag kACF(k)T-STATP-value
10.2699612.47420.007682
2-0.09848-0.90260.184663
30.0600430.55030.291786
40.1755561.6090.055685
50.2921262.67740.004461
60.2245442.0580.021346
70.2460062.25470.013377
80.0920690.84380.200581
9-0.069846-0.64010.261909
10-0.201601-1.84770.034082
110.1469991.34730.090759
120.6319445.79190
130.0843440.7730.220839
14-0.194548-1.78310.039094
15-0.114834-1.05250.1478
16-0.014606-0.13390.446916
170.1261121.15580.125512
180.1070480.98110.164678
190.0839650.76950.221863
20-0.016522-0.15140.440001
21-0.141402-1.2960.099267
22-0.253145-2.32010.01138
230.0794280.7280.234329
240.443934.06875.3e-05
250.0311520.28550.387977
26-0.142052-1.30190.09825
27-0.144327-1.32280.09475
28-0.03809-0.34910.363945
290.0746660.68430.247827
300.0879460.8060.211248
310.0764660.70080.242674
32-0.015355-0.14070.444212
33-0.118556-1.08660.140164
34-0.222906-2.0430.022095
350.060040.55030.291796
360.3309833.03350.001608
370.0207180.18990.424928
38-0.139682-1.28020.101998
39-0.105461-0.96660.168269
40-0.029959-0.27460.392158
410.0248930.22810.410043
420.0381310.34950.363803
430.0526970.4830.315185
440.0014680.01350.494649
45-0.132395-1.21340.114185
46-0.196737-1.80310.037477
470.0287110.26310.396544
480.2301432.10930.018948
490.0021810.020.49205
50-0.134603-1.23370.110385
51-0.117068-1.07290.143184
52-0.025163-0.23060.409083
530.0018770.01720.493158
54-0.028855-0.26450.396035
550.0067660.0620.475352
56-0.020848-0.19110.424464
57-0.136143-1.24780.107791
58-0.189491-1.73670.043052
59-0.05032-0.46120.322927
600.1033680.94740.173079


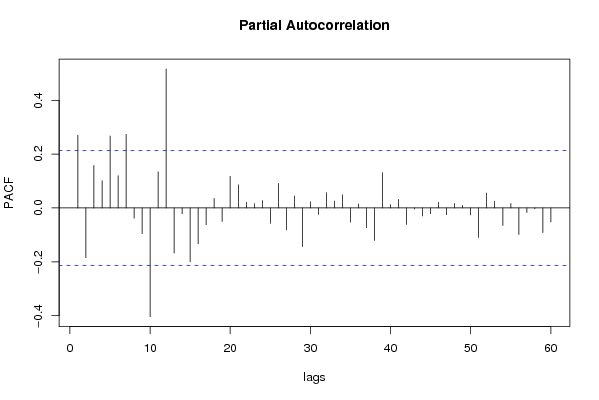
Partial Autocorrelation Function
Time lag kPACF(k)T-STATP-value
10.2699612.47420.007682
2-0.184829-1.6940.046986
30.1579541.44770.075716
40.1016810.93190.177023
50.2673032.44990.008184
60.1201631.10130.136954
70.2736852.50840.007026
8-0.037722-0.34570.365204
9-0.095319-0.87360.192409
10-0.403634-3.69940.000192
110.1344661.23240.110619
120.5165094.73394e-06
13-0.167227-1.53270.064558
14-0.021173-0.19410.423301
15-0.200067-1.83360.035124
16-0.133202-1.22080.112785
17-0.062242-0.57050.284945
180.0356580.32680.372312
19-0.050148-0.45960.323489
200.1174991.07690.142305
210.0861520.78960.215993
220.0216630.19850.421548
230.0159660.14630.442007
240.0274830.25190.400871
25-0.057471-0.52670.299885
260.0911590.83550.202906
27-0.080972-0.74210.230043
280.0446670.40940.341653
29-0.143321-1.31360.096286
300.0231870.21250.416112
31-0.023739-0.21760.414147
320.0572220.52440.300675
330.0256220.23480.407455
340.0488470.44770.327763
35-0.052509-0.48120.315795
360.0150430.13790.445334
37-0.073007-0.66910.252628
38-0.120304-1.10260.136674
390.1315781.20590.115615
400.0128750.1180.453173
410.0316350.28990.386288
42-0.060907-0.55820.289088
43-0.004085-0.03740.485113
44-0.029309-0.26860.394439
45-0.021357-0.19570.422644
460.0216050.1980.421757
47-0.024978-0.22890.409742
480.0168530.15450.438809
490.0097420.08930.464534
50-0.025673-0.23530.407277
51-0.109196-1.00080.159899
520.0555250.50890.306081
530.0252540.23150.408762
54-0.065298-0.59850.27557
550.0166280.15240.439618
56-0.098511-0.90290.184589
57-0.016316-0.14950.440742
58-0.002555-0.02340.490685
59-0.091091-0.83490.203082
60-0.051992-0.47650.317474

\begin{tabular}{lllllllll}
\hline
Partial Autocorrelation Function \tabularnewline
Time lag k & PACF(k) & T-STAT & P-value \tabularnewline
1 & 0.269961 & 2.4742 & 0.007682 \tabularnewline
2 & -0.184829 & -1.694 & 0.046986 \tabularnewline
3 & 0.157954 & 1.4477 & 0.075716 \tabularnewline
4 & 0.101681 & 0.9319 & 0.177023 \tabularnewline
5 & 0.267303 & 2.4499 & 0.008184 \tabularnewline
6 & 0.120163 & 1.1013 & 0.136954 \tabularnewline
7 & 0.273685 & 2.5084 & 0.007026 \tabularnewline
8 & -0.037722 & -0.3457 & 0.365204 \tabularnewline
9 & -0.095319 & -0.8736 & 0.192409 \tabularnewline
10 & -0.403634 & -3.6994 & 0.000192 \tabularnewline
11 & 0.134466 & 1.2324 & 0.110619 \tabularnewline
12 & 0.516509 & 4.7339 & 4e-06 \tabularnewline
13 & -0.167227 & -1.5327 & 0.064558 \tabularnewline
14 & -0.021173 & -0.1941 & 0.423301 \tabularnewline
15 & -0.200067 & -1.8336 & 0.035124 \tabularnewline
16 & -0.133202 & -1.2208 & 0.112785 \tabularnewline
17 & -0.062242 & -0.5705 & 0.284945 \tabularnewline
18 & 0.035658 & 0.3268 & 0.372312 \tabularnewline
19 & -0.050148 & -0.4596 & 0.323489 \tabularnewline
20 & 0.117499 & 1.0769 & 0.142305 \tabularnewline
21 & 0.086152 & 0.7896 & 0.215993 \tabularnewline
22 & 0.021663 & 0.1985 & 0.421548 \tabularnewline
23 & 0.015966 & 0.1463 & 0.442007 \tabularnewline
24 & 0.027483 & 0.2519 & 0.400871 \tabularnewline
25 & -0.057471 & -0.5267 & 0.299885 \tabularnewline
26 & 0.091159 & 0.8355 & 0.202906 \tabularnewline
27 & -0.080972 & -0.7421 & 0.230043 \tabularnewline
28 & 0.044667 & 0.4094 & 0.341653 \tabularnewline
29 & -0.143321 & -1.3136 & 0.096286 \tabularnewline
30 & 0.023187 & 0.2125 & 0.416112 \tabularnewline
31 & -0.023739 & -0.2176 & 0.414147 \tabularnewline
32 & 0.057222 & 0.5244 & 0.300675 \tabularnewline
33 & 0.025622 & 0.2348 & 0.407455 \tabularnewline
34 & 0.048847 & 0.4477 & 0.327763 \tabularnewline
35 & -0.052509 & -0.4812 & 0.315795 \tabularnewline
36 & 0.015043 & 0.1379 & 0.445334 \tabularnewline
37 & -0.073007 & -0.6691 & 0.252628 \tabularnewline
38 & -0.120304 & -1.1026 & 0.136674 \tabularnewline
39 & 0.131578 & 1.2059 & 0.115615 \tabularnewline
40 & 0.012875 & 0.118 & 0.453173 \tabularnewline
41 & 0.031635 & 0.2899 & 0.386288 \tabularnewline
42 & -0.060907 & -0.5582 & 0.289088 \tabularnewline
43 & -0.004085 & -0.0374 & 0.485113 \tabularnewline
44 & -0.029309 & -0.2686 & 0.394439 \tabularnewline
45 & -0.021357 & -0.1957 & 0.422644 \tabularnewline
46 & 0.021605 & 0.198 & 0.421757 \tabularnewline
47 & -0.024978 & -0.2289 & 0.409742 \tabularnewline
48 & 0.016853 & 0.1545 & 0.438809 \tabularnewline
49 & 0.009742 & 0.0893 & 0.464534 \tabularnewline
50 & -0.025673 & -0.2353 & 0.407277 \tabularnewline
51 & -0.109196 & -1.0008 & 0.159899 \tabularnewline
52 & 0.055525 & 0.5089 & 0.306081 \tabularnewline
53 & 0.025254 & 0.2315 & 0.408762 \tabularnewline
54 & -0.065298 & -0.5985 & 0.27557 \tabularnewline
55 & 0.016628 & 0.1524 & 0.439618 \tabularnewline
56 & -0.098511 & -0.9029 & 0.184589 \tabularnewline
57 & -0.016316 & -0.1495 & 0.440742 \tabularnewline
58 & -0.002555 & -0.0234 & 0.490685 \tabularnewline
59 & -0.091091 & -0.8349 & 0.203082 \tabularnewline
60 & -0.051992 & -0.4765 & 0.317474 \tabularnewline
\hline
\end{tabular}
%Source: https://freestatistics.org/blog/index.php?pk=31599&T=2

[TABLE]
[ROW][C]Partial Autocorrelation Function[/C][/ROW]
[ROW][C]Time lag k[/C][C]PACF(k)[/C][C]T-STAT[/C][C]P-value[/C][/ROW]
[ROW][C]1[/C][C]0.269961[/C][C]2.4742[/C][C]0.007682[/C][/ROW]
[ROW][C]2[/C][C]-0.184829[/C][C]-1.694[/C][C]0.046986[/C][/ROW]
[ROW][C]3[/C][C]0.157954[/C][C]1.4477[/C][C]0.075716[/C][/ROW]
[ROW][C]4[/C][C]0.101681[/C][C]0.9319[/C][C]0.177023[/C][/ROW]
[ROW][C]5[/C][C]0.267303[/C][C]2.4499[/C][C]0.008184[/C][/ROW]
[ROW][C]6[/C][C]0.120163[/C][C]1.1013[/C][C]0.136954[/C][/ROW]
[ROW][C]7[/C][C]0.273685[/C][C]2.5084[/C][C]0.007026[/C][/ROW]
[ROW][C]8[/C][C]-0.037722[/C][C]-0.3457[/C][C]0.365204[/C][/ROW]
[ROW][C]9[/C][C]-0.095319[/C][C]-0.8736[/C][C]0.192409[/C][/ROW]
[ROW][C]10[/C][C]-0.403634[/C][C]-3.6994[/C][C]0.000192[/C][/ROW]
[ROW][C]11[/C][C]0.134466[/C][C]1.2324[/C][C]0.110619[/C][/ROW]
[ROW][C]12[/C][C]0.516509[/C][C]4.7339[/C][C]4e-06[/C][/ROW]
[ROW][C]13[/C][C]-0.167227[/C][C]-1.5327[/C][C]0.064558[/C][/ROW]
[ROW][C]14[/C][C]-0.021173[/C][C]-0.1941[/C][C]0.423301[/C][/ROW]
[ROW][C]15[/C][C]-0.200067[/C][C]-1.8336[/C][C]0.035124[/C][/ROW]
[ROW][C]16[/C][C]-0.133202[/C][C]-1.2208[/C][C]0.112785[/C][/ROW]
[ROW][C]17[/C][C]-0.062242[/C][C]-0.5705[/C][C]0.284945[/C][/ROW]
[ROW][C]18[/C][C]0.035658[/C][C]0.3268[/C][C]0.372312[/C][/ROW]
[ROW][C]19[/C][C]-0.050148[/C][C]-0.4596[/C][C]0.323489[/C][/ROW]
[ROW][C]20[/C][C]0.117499[/C][C]1.0769[/C][C]0.142305[/C][/ROW]
[ROW][C]21[/C][C]0.086152[/C][C]0.7896[/C][C]0.215993[/C][/ROW]
[ROW][C]22[/C][C]0.021663[/C][C]0.1985[/C][C]0.421548[/C][/ROW]
[ROW][C]23[/C][C]0.015966[/C][C]0.1463[/C][C]0.442007[/C][/ROW]
[ROW][C]24[/C][C]0.027483[/C][C]0.2519[/C][C]0.400871[/C][/ROW]
[ROW][C]25[/C][C]-0.057471[/C][C]-0.5267[/C][C]0.299885[/C][/ROW]
[ROW][C]26[/C][C]0.091159[/C][C]0.8355[/C][C]0.202906[/C][/ROW]
[ROW][C]27[/C][C]-0.080972[/C][C]-0.7421[/C][C]0.230043[/C][/ROW]
[ROW][C]28[/C][C]0.044667[/C][C]0.4094[/C][C]0.341653[/C][/ROW]
[ROW][C]29[/C][C]-0.143321[/C][C]-1.3136[/C][C]0.096286[/C][/ROW]
[ROW][C]30[/C][C]0.023187[/C][C]0.2125[/C][C]0.416112[/C][/ROW]
[ROW][C]31[/C][C]-0.023739[/C][C]-0.2176[/C][C]0.414147[/C][/ROW]
[ROW][C]32[/C][C]0.057222[/C][C]0.5244[/C][C]0.300675[/C][/ROW]
[ROW][C]33[/C][C]0.025622[/C][C]0.2348[/C][C]0.407455[/C][/ROW]
[ROW][C]34[/C][C]0.048847[/C][C]0.4477[/C][C]0.327763[/C][/ROW]
[ROW][C]35[/C][C]-0.052509[/C][C]-0.4812[/C][C]0.315795[/C][/ROW]
[ROW][C]36[/C][C]0.015043[/C][C]0.1379[/C][C]0.445334[/C][/ROW]
[ROW][C]37[/C][C]-0.073007[/C][C]-0.6691[/C][C]0.252628[/C][/ROW]
[ROW][C]38[/C][C]-0.120304[/C][C]-1.1026[/C][C]0.136674[/C][/ROW]
[ROW][C]39[/C][C]0.131578[/C][C]1.2059[/C][C]0.115615[/C][/ROW]
[ROW][C]40[/C][C]0.012875[/C][C]0.118[/C][C]0.453173[/C][/ROW]
[ROW][C]41[/C][C]0.031635[/C][C]0.2899[/C][C]0.386288[/C][/ROW]
[ROW][C]42[/C][C]-0.060907[/C][C]-0.5582[/C][C]0.289088[/C][/ROW]
[ROW][C]43[/C][C]-0.004085[/C][C]-0.0374[/C][C]0.485113[/C][/ROW]
[ROW][C]44[/C][C]-0.029309[/C][C]-0.2686[/C][C]0.394439[/C][/ROW]
[ROW][C]45[/C][C]-0.021357[/C][C]-0.1957[/C][C]0.422644[/C][/ROW]
[ROW][C]46[/C][C]0.021605[/C][C]0.198[/C][C]0.421757[/C][/ROW]
[ROW][C]47[/C][C]-0.024978[/C][C]-0.2289[/C][C]0.409742[/C][/ROW]
[ROW][C]48[/C][C]0.016853[/C][C]0.1545[/C][C]0.438809[/C][/ROW]
[ROW][C]49[/C][C]0.009742[/C][C]0.0893[/C][C]0.464534[/C][/ROW]
[ROW][C]50[/C][C]-0.025673[/C][C]-0.2353[/C][C]0.407277[/C][/ROW]
[ROW][C]51[/C][C]-0.109196[/C][C]-1.0008[/C][C]0.159899[/C][/ROW]
[ROW][C]52[/C][C]0.055525[/C][C]0.5089[/C][C]0.306081[/C][/ROW]
[ROW][C]53[/C][C]0.025254[/C][C]0.2315[/C][C]0.408762[/C][/ROW]
[ROW][C]54[/C][C]-0.065298[/C][C]-0.5985[/C][C]0.27557[/C][/ROW]
[ROW][C]55[/C][C]0.016628[/C][C]0.1524[/C][C]0.439618[/C][/ROW]
[ROW][C]56[/C][C]-0.098511[/C][C]-0.9029[/C][C]0.184589[/C][/ROW]
[ROW][C]57[/C][C]-0.016316[/C][C]-0.1495[/C][C]0.440742[/C][/ROW]
[ROW][C]58[/C][C]-0.002555[/C][C]-0.0234[/C][C]0.490685[/C][/ROW]
[ROW][C]59[/C][C]-0.091091[/C][C]-0.8349[/C][C]0.203082[/C][/ROW]
[ROW][C]60[/C][C]-0.051992[/C][C]-0.4765[/C][C]0.317474[/C][/ROW]
[/TABLE]
Source: https://freestatistics.org/blog/index.php?pk=31599&T=2

Globally Unique Identifier (entire table): ba.freestatistics.org/blog/index.php?pk=31599&T=2

As an alternative you can also use a QR Code:  

The GUIDs for individual cells are displayed in the table below:

Partial Autocorrelation Function
Time lag kPACF(k)T-STATP-value
10.2699612.47420.007682
2-0.184829-1.6940.046986
30.1579541.44770.075716
40.1016810.93190.177023
50.2673032.44990.008184
60.1201631.10130.136954
70.2736852.50840.007026
8-0.037722-0.34570.365204
9-0.095319-0.87360.192409
10-0.403634-3.69940.000192
110.1344661.23240.110619
120.5165094.73394e-06
13-0.167227-1.53270.064558
14-0.021173-0.19410.423301
15-0.200067-1.83360.035124
16-0.133202-1.22080.112785
17-0.062242-0.57050.284945
180.0356580.32680.372312
19-0.050148-0.45960.323489
200.1174991.07690.142305
210.0861520.78960.215993
220.0216630.19850.421548
230.0159660.14630.442007
240.0274830.25190.400871
25-0.057471-0.52670.299885
260.0911590.83550.202906
27-0.080972-0.74210.230043
280.0446670.40940.341653
29-0.143321-1.31360.096286
300.0231870.21250.416112
31-0.023739-0.21760.414147
320.0572220.52440.300675
330.0256220.23480.407455
340.0488470.44770.327763
35-0.052509-0.48120.315795
360.0150430.13790.445334
37-0.073007-0.66910.252628
38-0.120304-1.10260.136674
390.1315781.20590.115615
400.0128750.1180.453173
410.0316350.28990.386288
42-0.060907-0.55820.289088
43-0.004085-0.03740.485113
44-0.029309-0.26860.394439
45-0.021357-0.19570.422644
460.0216050.1980.421757
47-0.024978-0.22890.409742
480.0168530.15450.438809
490.0097420.08930.464534
50-0.025673-0.23530.407277
51-0.109196-1.00080.159899
520.0555250.50890.306081
530.0252540.23150.408762
54-0.065298-0.59850.27557
550.0166280.15240.439618
56-0.098511-0.90290.184589
57-0.016316-0.14950.440742
58-0.002555-0.02340.490685
59-0.091091-0.83490.203082
60-0.051992-0.47650.317474


Parameters (Session):
par1 = 60 ; par2 = 1 ; par3 = 0 ; par4 = 0 ; par5 = 12 ;
Parameters (R input):
par1 = 60 ; par2 = 1 ; par3 = 0 ; par4 = 0 ; par5 = 12 ;
R code (references can be found in the software module):
if (par1 == 'Default') {
par1 = 10*log10(length(x))
} else {
par1 <- as.numeric(par1)
}
par2 <- as.numeric(par2)
par3 <- as.numeric(par3)
par4 <- as.numeric(par4)
par5 <- as.numeric(par5)
if (par2 == 0) {
x <- log(x)
} else {
x <- (x ^ par2 - 1) / par2
}
if (par3 > 0) x <- diff(x,lag=1,difference=par3)
if (par4 > 0) x <- diff(x,lag=par5,difference=par4)
bitmap(file='pic1.png')
racf <- acf(x,par1,main='Autocorrelation',xlab='lags',ylab='ACF')
dev.off()
bitmap(file='pic2.png')
rpacf <- pacf(x,par1,main='Partial Autocorrelation',xlab='lags',ylab='PACF')
dev.off()
(myacf <- c(racf$acf))
(mypacf <- c(rpacf$acf))
lengthx <- length(x)
sqrtn <- sqrt(lengthx)
load(file='createtable')
a<-table.start()
a<-table.row.start(a)
a<-table.element(a,'Autocorrelation Function',4,TRUE)
a<-table.row.end(a)
a<-table.row.start(a)
a<-table.element(a,'Time lag k',header=TRUE)
a<-table.element(a,hyperlink('basics.htm','ACF(k)','click here for more information about the Autocorrelation Function'),header=TRUE)
a<-table.element(a,'T-STAT',header=TRUE)
a<-table.element(a,'P-value',header=TRUE)
a<-table.row.end(a)
for (i in 2:(par1+1)) {
a<-table.row.start(a)
a<-table.element(a,i-1,header=TRUE)
a<-table.element(a,round(myacf[i],6))
mytstat <- myacf[i]*sqrtn
a<-table.element(a,round(mytstat,4))
a<-table.element(a,round(1-pt(abs(mytstat),lengthx),6))
a<-table.row.end(a)
}
a<-table.end(a)
table.save(a,file='mytable.tab')
a<-table.start()
a<-table.row.start(a)
a<-table.element(a,'Partial Autocorrelation Function',4,TRUE)
a<-table.row.end(a)
a<-table.row.start(a)
a<-table.element(a,'Time lag k',header=TRUE)
a<-table.element(a,hyperlink('basics.htm','PACF(k)','click here for more information about the Partial Autocorrelation Function'),header=TRUE)
a<-table.element(a,'T-STAT',header=TRUE)
a<-table.element(a,'P-value',header=TRUE)
a<-table.row.end(a)
for (i in 1:par1) {
a<-table.row.start(a)
a<-table.element(a,i,header=TRUE)
a<-table.element(a,round(mypacf[i],6))
mytstat <- mypacf[i]*sqrtn
a<-table.element(a,round(mytstat,4))
a<-table.element(a,round(1-pt(abs(mytstat),lengthx),6))
a<-table.row.end(a)
}
a<-table.end(a)
table.save(a,file='mytable1.tab')