Free Statistics

of Irreproducible Research!

Author's title

Author*Unverified author*
R Software Modulerwasp_autocorrelation.wasp
Title produced by software(Partial) Autocorrelation Function
Date of computationTue, 09 Dec 2008 10:12:38 -0700
Cite this page as followsStatistical Computations at FreeStatistics.org, Office for Research Development and Education, URL https://freestatistics.org/blog/index.php?v=date/2008/Dec/09/t1228842810aelcpjmtv1mucnd.htm/, Retrieved Fri, 17 May 2024 01:41:42 +0000
Statistical Computations at FreeStatistics.org, Office for Research Development and Education, URL https://freestatistics.org/blog/index.php?pk=31597, Retrieved Fri, 17 May 2024 01:41:42 +0000
QR Codes:

Original text written by user:
IsPrivate?No (this computation is public)
User-defined keywordsk_vanderheggen
Estimated Impact187
Family? (F = Feedback message, R = changed R code, M = changed R Module, P = changed Parameters, D = changed Data)
F       [(Partial) Autocorrelation Function] [eigen tijdreeks a...] [2008-12-09 17:12:38] [2731fa16c50d4727d0297daf34574cde] [Current]
- RMP     [ARIMA Backward Selection] [stap 5] [2008-12-14 14:06:36] [b1bd16d1f47bfe13feacf1c27a0abba5]
F   P       [ARIMA Backward Selection] [Paper Backward se...] [2008-12-16 16:35:26] [1640119c345fbfa2091dc1243f79f7a6]
F RMP         [ARIMA Forecasting] [Paper Forecast] [2008-12-16 18:11:10] [1640119c345fbfa2091dc1243f79f7a6]
-   P           [ARIMA Forecasting] [Paper Forecast] [2008-12-18 13:21:27] [1640119c345fbfa2091dc1243f79f7a6]
-   P     [(Partial) Autocorrelation Function] [Paper ARMA] [2008-12-14 16:20:55] [1640119c345fbfa2091dc1243f79f7a6]
-   P     [(Partial) Autocorrelation Function] [] [2008-12-16 14:10:31] [74be16979710d4c4e7c6647856088456]
Feedback Forum
2008-12-14 13:57:25 [Jasmine Hendrikx] [reply
Evaluatie stap 3 ACF:
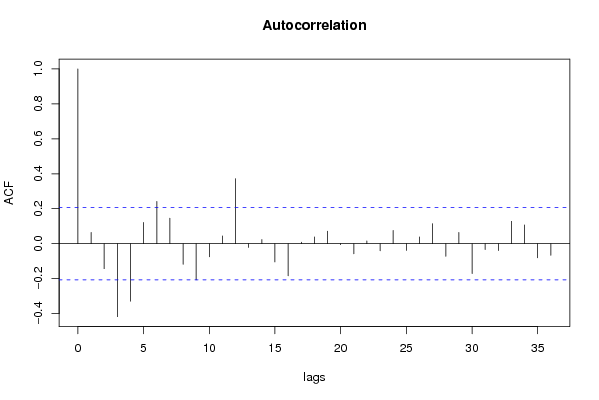
De berekening is goed uitgevoerd. Er is gedifferentieerd met d=2 en D=0 en we zien inderdaad een hele verbetering. De langetermijntrend is duidelijk weg. Er is ook geen sprake van seizoenaliteit, dus de reeks lijkt stationair voor wat de trend betreft. Bij een differentiatie met d=1 en D=0 , zijn er niet meteen betere resultaten te zien, hoewel uit de VRM bleek dat deze combinatie de kleinste variantie voortbracht bij de getrimde variantie. Eventueel had er hier nog in stappen gewerkt kunnen worden, zodat je duidelijk de evolutie kan zien.
2008-12-14 14:09:05 [Jasmine Hendrikx] [reply
Evaluatie stap 4:
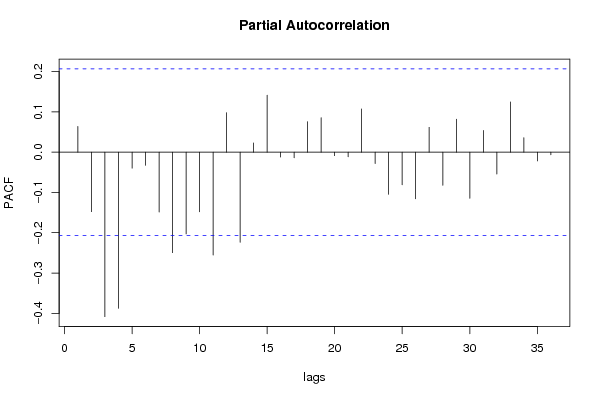
De berekening is slechts gedeeltelijk uitgevoerd. Zo moest je buiten de (P)ACF ook kijken naar het spectrum. Wat de (P)ACF betreft, is de berekening wel goed uitgevoerd. De bespreking lijkt mij echter niet echt juist. Zo zie in de ACF niet meteen een patroon dat lijkt op een theoretisch patroon van de ACF van een AR proces. Bijgevolg zou ik dan p gelijkstellen aan 0. Ook zie ik niet meteen een SAR proces. Bijgevolg zou ik dan ook P gelijkstellen aan 0. Vervolgens moet je de PACF bekijken om te onderzoeken of er een MA proces aanwezig is. Als er dan een patroon aanwezig lijkt te zijn, moet je dan kijken naar de ACF om de orde te bepalen.

Stap 5 is niet gedaan. Je moet deze vraag oplossen met de Backward Selection Method. Het model dat de computer dan genereert, kun je dan vergelijken met de waarden die je hebt gevonden in stap 4. Om te kijken of het een goed model is, moet je kijken of aan de assumpties van de residu's is voldaan. Hieronder de URL van de Backward Selection Method: http://www.freestatistics.org/blog/index.php?v=date/2008/Dec/14/t12292636489g1bu1eiag8vmys.htm
2008-12-16 14:15:38 [Peter Van Doninck] [reply
http://www.freestatistics.org/blog/index.php?v=date/2008/Dec/16/t1229436805xt0oto4lcvsym4k.htm

Deze grafiek toont de correcte ACF en PACF. Hieruit kan de student dan de juiste conclusies trekken door de patronen te vergelijken met het schoolvoorbeeld van de grafieken.
2008-12-16 14:20:17 [Peter Van Doninck] [reply
http://www.freestatistics.org/blog/index.php?v=date/2008/Dec/16/t1229436805xt0oto4lcvsym4k.htm
De studente heeft de verkeerde berekeningen uitgevoerd. Op basis van deze gegevens kan het juiste proces afgeleid worden. Dit kan eveneens door gebruik te maken van de rekenmodule die zich op wessa.net bevindt. Deze module heeft de studente ook nodig voor stap 5 op te lossen.

Post a new message
Dataseries X:
5.5
5.3
5.2
5.3
5.3
5
4.8
4.9
5.3
6
6.2
6.4
6.4
6.4
6.2
6.1
6
5.9
6.2
6.2
6.4
6.8
6.9
7
7
6.9
6.7
6.6
6.5
6.4
6.5
6.5
6.6
6.7
6.8
7.2
7.6
7.6
7.3
6.4
6.1
6.3
7.1
7.5
7.4
7.1
6.8
6.9
7.2
7.4
7.3
6.9
6.9
6.8
7.1
7.2
7.1
7
6.9
7
7.4
7.5
7.5
7.4
7.3
7
6.7
6.5
6.5
6.5
6.6
6.8
6.9
6.9
6.8
6.8
6.5
6.1
6
5.9
5.8
5.9
5.9
6.2
6.3
6.2
6
5.8
5.5
5.5
5.7
5.8


Summary of computational transaction
Raw Inputview raw input (R code)
Raw Outputview raw output of R engine
Computing time1 seconds
R Server'Sir Ronald Aylmer Fisher' @ 193.190.124.24

\begin{tabular}{lllllllll}
\hline
Summary of computational transaction \tabularnewline
Raw Input & view raw input (R code)  \tabularnewline
Raw Output & view raw output of R engine  \tabularnewline
Computing time & 1 seconds \tabularnewline
R Server & 'Sir Ronald Aylmer Fisher' @ 193.190.124.24 \tabularnewline
\hline
\end{tabular}
%Source: https://freestatistics.org/blog/index.php?pk=31597&T=0

[TABLE]
[ROW][C]Summary of computational transaction[/C][/ROW]
[ROW][C]Raw Input[/C][C]view raw input (R code) [/C][/ROW]
[ROW][C]Raw Output[/C][C]view raw output of R engine [/C][/ROW]
[ROW][C]Computing time[/C][C]1 seconds[/C][/ROW]
[ROW][C]R Server[/C][C]'Sir Ronald Aylmer Fisher' @ 193.190.124.24[/C][/ROW]
[/TABLE]
Source: https://freestatistics.org/blog/index.php?pk=31597&T=0

Globally Unique Identifier (entire table): ba.freestatistics.org/blog/index.php?pk=31597&T=0

As an alternative you can also use a QR Code:  

The GUIDs for individual cells are displayed in the table below:

Summary of computational transaction
Raw Inputview raw input (R code)
Raw Outputview raw output of R engine
Computing time1 seconds
R Server'Sir Ronald Aylmer Fisher' @ 193.190.124.24


Autocorrelation Function
Time lag kACF(k)T-STATP-value
10.0636470.60380.273746
2-0.143101-1.35760.088996
3-0.417689-3.96257.4e-05
4-0.328957-3.12080.001212
50.121871.15620.125338
60.2419422.29530.012021
70.1452741.37820.08578
8-0.11777-1.11730.133427
9-0.206894-1.96280.026381
10-0.075407-0.71540.238116
110.0445370.42250.336829
120.3714843.52420.000335
13-0.021373-0.20280.419889
140.0233790.22180.41249
15-0.104372-0.99020.162375
16-0.183887-1.74450.042243
170.007960.07550.469987
180.0386540.36670.357352
190.0716040.67930.249346
20-0.005718-0.05420.47843
21-0.058083-0.5510.29149
220.0154940.1470.441734
23-0.040676-0.38590.350245
240.0754630.71590.237953
25-0.038681-0.3670.357253
260.0387650.36780.356958
270.1140841.08230.141006
28-0.071641-0.67960.249237
290.0638440.60570.273126
30-0.170375-1.61630.054763
31-0.033148-0.31450.376944
32-0.038761-0.36770.356973
330.1277421.21190.114367
340.1066531.01180.157173
35-0.081006-0.76850.222103
36-0.065919-0.62540.266659

\begin{tabular}{lllllllll}
\hline
Autocorrelation Function \tabularnewline
Time lag k & ACF(k) & T-STAT & P-value \tabularnewline
1 & 0.063647 & 0.6038 & 0.273746 \tabularnewline
2 & -0.143101 & -1.3576 & 0.088996 \tabularnewline
3 & -0.417689 & -3.9625 & 7.4e-05 \tabularnewline
4 & -0.328957 & -3.1208 & 0.001212 \tabularnewline
5 & 0.12187 & 1.1562 & 0.125338 \tabularnewline
6 & 0.241942 & 2.2953 & 0.012021 \tabularnewline
7 & 0.145274 & 1.3782 & 0.08578 \tabularnewline
8 & -0.11777 & -1.1173 & 0.133427 \tabularnewline
9 & -0.206894 & -1.9628 & 0.026381 \tabularnewline
10 & -0.075407 & -0.7154 & 0.238116 \tabularnewline
11 & 0.044537 & 0.4225 & 0.336829 \tabularnewline
12 & 0.371484 & 3.5242 & 0.000335 \tabularnewline
13 & -0.021373 & -0.2028 & 0.419889 \tabularnewline
14 & 0.023379 & 0.2218 & 0.41249 \tabularnewline
15 & -0.104372 & -0.9902 & 0.162375 \tabularnewline
16 & -0.183887 & -1.7445 & 0.042243 \tabularnewline
17 & 0.00796 & 0.0755 & 0.469987 \tabularnewline
18 & 0.038654 & 0.3667 & 0.357352 \tabularnewline
19 & 0.071604 & 0.6793 & 0.249346 \tabularnewline
20 & -0.005718 & -0.0542 & 0.47843 \tabularnewline
21 & -0.058083 & -0.551 & 0.29149 \tabularnewline
22 & 0.015494 & 0.147 & 0.441734 \tabularnewline
23 & -0.040676 & -0.3859 & 0.350245 \tabularnewline
24 & 0.075463 & 0.7159 & 0.237953 \tabularnewline
25 & -0.038681 & -0.367 & 0.357253 \tabularnewline
26 & 0.038765 & 0.3678 & 0.356958 \tabularnewline
27 & 0.114084 & 1.0823 & 0.141006 \tabularnewline
28 & -0.071641 & -0.6796 & 0.249237 \tabularnewline
29 & 0.063844 & 0.6057 & 0.273126 \tabularnewline
30 & -0.170375 & -1.6163 & 0.054763 \tabularnewline
31 & -0.033148 & -0.3145 & 0.376944 \tabularnewline
32 & -0.038761 & -0.3677 & 0.356973 \tabularnewline
33 & 0.127742 & 1.2119 & 0.114367 \tabularnewline
34 & 0.106653 & 1.0118 & 0.157173 \tabularnewline
35 & -0.081006 & -0.7685 & 0.222103 \tabularnewline
36 & -0.065919 & -0.6254 & 0.266659 \tabularnewline
\hline
\end{tabular}
%Source: https://freestatistics.org/blog/index.php?pk=31597&T=1

[TABLE]
[ROW][C]Autocorrelation Function[/C][/ROW]
[ROW][C]Time lag k[/C][C]ACF(k)[/C][C]T-STAT[/C][C]P-value[/C][/ROW]
[ROW][C]1[/C][C]0.063647[/C][C]0.6038[/C][C]0.273746[/C][/ROW]
[ROW][C]2[/C][C]-0.143101[/C][C]-1.3576[/C][C]0.088996[/C][/ROW]
[ROW][C]3[/C][C]-0.417689[/C][C]-3.9625[/C][C]7.4e-05[/C][/ROW]
[ROW][C]4[/C][C]-0.328957[/C][C]-3.1208[/C][C]0.001212[/C][/ROW]
[ROW][C]5[/C][C]0.12187[/C][C]1.1562[/C][C]0.125338[/C][/ROW]
[ROW][C]6[/C][C]0.241942[/C][C]2.2953[/C][C]0.012021[/C][/ROW]
[ROW][C]7[/C][C]0.145274[/C][C]1.3782[/C][C]0.08578[/C][/ROW]
[ROW][C]8[/C][C]-0.11777[/C][C]-1.1173[/C][C]0.133427[/C][/ROW]
[ROW][C]9[/C][C]-0.206894[/C][C]-1.9628[/C][C]0.026381[/C][/ROW]
[ROW][C]10[/C][C]-0.075407[/C][C]-0.7154[/C][C]0.238116[/C][/ROW]
[ROW][C]11[/C][C]0.044537[/C][C]0.4225[/C][C]0.336829[/C][/ROW]
[ROW][C]12[/C][C]0.371484[/C][C]3.5242[/C][C]0.000335[/C][/ROW]
[ROW][C]13[/C][C]-0.021373[/C][C]-0.2028[/C][C]0.419889[/C][/ROW]
[ROW][C]14[/C][C]0.023379[/C][C]0.2218[/C][C]0.41249[/C][/ROW]
[ROW][C]15[/C][C]-0.104372[/C][C]-0.9902[/C][C]0.162375[/C][/ROW]
[ROW][C]16[/C][C]-0.183887[/C][C]-1.7445[/C][C]0.042243[/C][/ROW]
[ROW][C]17[/C][C]0.00796[/C][C]0.0755[/C][C]0.469987[/C][/ROW]
[ROW][C]18[/C][C]0.038654[/C][C]0.3667[/C][C]0.357352[/C][/ROW]
[ROW][C]19[/C][C]0.071604[/C][C]0.6793[/C][C]0.249346[/C][/ROW]
[ROW][C]20[/C][C]-0.005718[/C][C]-0.0542[/C][C]0.47843[/C][/ROW]
[ROW][C]21[/C][C]-0.058083[/C][C]-0.551[/C][C]0.29149[/C][/ROW]
[ROW][C]22[/C][C]0.015494[/C][C]0.147[/C][C]0.441734[/C][/ROW]
[ROW][C]23[/C][C]-0.040676[/C][C]-0.3859[/C][C]0.350245[/C][/ROW]
[ROW][C]24[/C][C]0.075463[/C][C]0.7159[/C][C]0.237953[/C][/ROW]
[ROW][C]25[/C][C]-0.038681[/C][C]-0.367[/C][C]0.357253[/C][/ROW]
[ROW][C]26[/C][C]0.038765[/C][C]0.3678[/C][C]0.356958[/C][/ROW]
[ROW][C]27[/C][C]0.114084[/C][C]1.0823[/C][C]0.141006[/C][/ROW]
[ROW][C]28[/C][C]-0.071641[/C][C]-0.6796[/C][C]0.249237[/C][/ROW]
[ROW][C]29[/C][C]0.063844[/C][C]0.6057[/C][C]0.273126[/C][/ROW]
[ROW][C]30[/C][C]-0.170375[/C][C]-1.6163[/C][C]0.054763[/C][/ROW]
[ROW][C]31[/C][C]-0.033148[/C][C]-0.3145[/C][C]0.376944[/C][/ROW]
[ROW][C]32[/C][C]-0.038761[/C][C]-0.3677[/C][C]0.356973[/C][/ROW]
[ROW][C]33[/C][C]0.127742[/C][C]1.2119[/C][C]0.114367[/C][/ROW]
[ROW][C]34[/C][C]0.106653[/C][C]1.0118[/C][C]0.157173[/C][/ROW]
[ROW][C]35[/C][C]-0.081006[/C][C]-0.7685[/C][C]0.222103[/C][/ROW]
[ROW][C]36[/C][C]-0.065919[/C][C]-0.6254[/C][C]0.266659[/C][/ROW]
[/TABLE]
Source: https://freestatistics.org/blog/index.php?pk=31597&T=1

Globally Unique Identifier (entire table): ba.freestatistics.org/blog/index.php?pk=31597&T=1

As an alternative you can also use a QR Code:  

The GUIDs for individual cells are displayed in the table below:

Autocorrelation Function
Time lag kACF(k)T-STATP-value
10.0636470.60380.273746
2-0.143101-1.35760.088996
3-0.417689-3.96257.4e-05
4-0.328957-3.12080.001212
50.121871.15620.125338
60.2419422.29530.012021
70.1452741.37820.08578
8-0.11777-1.11730.133427
9-0.206894-1.96280.026381
10-0.075407-0.71540.238116
110.0445370.42250.336829
120.3714843.52420.000335
13-0.021373-0.20280.419889
140.0233790.22180.41249
15-0.104372-0.99020.162375
16-0.183887-1.74450.042243
170.007960.07550.469987
180.0386540.36670.357352
190.0716040.67930.249346
20-0.005718-0.05420.47843
21-0.058083-0.5510.29149
220.0154940.1470.441734
23-0.040676-0.38590.350245
240.0754630.71590.237953
25-0.038681-0.3670.357253
260.0387650.36780.356958
270.1140841.08230.141006
28-0.071641-0.67960.249237
290.0638440.60570.273126
30-0.170375-1.61630.054763
31-0.033148-0.31450.376944
32-0.038761-0.36770.356973
330.1277421.21190.114367
340.1066531.01180.157173
35-0.081006-0.76850.222103
36-0.065919-0.62540.266659


Partial Autocorrelation Function
Time lag kPACF(k)T-STATP-value
10.0636470.60380.273746
2-0.14775-1.40170.082225
3-0.408364-3.87410.000101
4-0.387472-3.67590.000201
5-0.039728-0.37690.353569
6-0.032686-0.31010.378607
7-0.148752-1.41120.080819
8-0.249551-2.36750.010027
9-0.202956-1.92540.028668
10-0.148054-1.40460.081796
11-0.255348-2.42240.00871
120.0979540.92930.177617
13-0.223946-2.12450.018183
140.0226360.21470.415226
150.1412711.34020.091774
16-0.011869-0.11260.4553
17-0.014134-0.13410.446817
180.075430.71560.238048
190.085460.81070.209824
20-0.008714-0.08270.467151
21-0.011485-0.1090.456739
220.1071041.01610.156159
23-0.028267-0.26820.394593
24-0.104346-0.98990.162435
25-0.0811-0.76940.221841
26-0.115547-1.09620.137963
270.0616140.58450.280166
28-0.082142-0.77930.218933
290.0818330.77630.219792
30-0.114384-1.08510.140378
310.0539970.51230.304862
32-0.054159-0.51380.304326
330.1247981.18390.119778
340.0358790.34040.367181
35-0.021756-0.20640.418475
36-0.006473-0.06140.475584

\begin{tabular}{lllllllll}
\hline
Partial Autocorrelation Function \tabularnewline
Time lag k & PACF(k) & T-STAT & P-value \tabularnewline
1 & 0.063647 & 0.6038 & 0.273746 \tabularnewline
2 & -0.14775 & -1.4017 & 0.082225 \tabularnewline
3 & -0.408364 & -3.8741 & 0.000101 \tabularnewline
4 & -0.387472 & -3.6759 & 0.000201 \tabularnewline
5 & -0.039728 & -0.3769 & 0.353569 \tabularnewline
6 & -0.032686 & -0.3101 & 0.378607 \tabularnewline
7 & -0.148752 & -1.4112 & 0.080819 \tabularnewline
8 & -0.249551 & -2.3675 & 0.010027 \tabularnewline
9 & -0.202956 & -1.9254 & 0.028668 \tabularnewline
10 & -0.148054 & -1.4046 & 0.081796 \tabularnewline
11 & -0.255348 & -2.4224 & 0.00871 \tabularnewline
12 & 0.097954 & 0.9293 & 0.177617 \tabularnewline
13 & -0.223946 & -2.1245 & 0.018183 \tabularnewline
14 & 0.022636 & 0.2147 & 0.415226 \tabularnewline
15 & 0.141271 & 1.3402 & 0.091774 \tabularnewline
16 & -0.011869 & -0.1126 & 0.4553 \tabularnewline
17 & -0.014134 & -0.1341 & 0.446817 \tabularnewline
18 & 0.07543 & 0.7156 & 0.238048 \tabularnewline
19 & 0.08546 & 0.8107 & 0.209824 \tabularnewline
20 & -0.008714 & -0.0827 & 0.467151 \tabularnewline
21 & -0.011485 & -0.109 & 0.456739 \tabularnewline
22 & 0.107104 & 1.0161 & 0.156159 \tabularnewline
23 & -0.028267 & -0.2682 & 0.394593 \tabularnewline
24 & -0.104346 & -0.9899 & 0.162435 \tabularnewline
25 & -0.0811 & -0.7694 & 0.221841 \tabularnewline
26 & -0.115547 & -1.0962 & 0.137963 \tabularnewline
27 & 0.061614 & 0.5845 & 0.280166 \tabularnewline
28 & -0.082142 & -0.7793 & 0.218933 \tabularnewline
29 & 0.081833 & 0.7763 & 0.219792 \tabularnewline
30 & -0.114384 & -1.0851 & 0.140378 \tabularnewline
31 & 0.053997 & 0.5123 & 0.304862 \tabularnewline
32 & -0.054159 & -0.5138 & 0.304326 \tabularnewline
33 & 0.124798 & 1.1839 & 0.119778 \tabularnewline
34 & 0.035879 & 0.3404 & 0.367181 \tabularnewline
35 & -0.021756 & -0.2064 & 0.418475 \tabularnewline
36 & -0.006473 & -0.0614 & 0.475584 \tabularnewline
\hline
\end{tabular}
%Source: https://freestatistics.org/blog/index.php?pk=31597&T=2

[TABLE]
[ROW][C]Partial Autocorrelation Function[/C][/ROW]
[ROW][C]Time lag k[/C][C]PACF(k)[/C][C]T-STAT[/C][C]P-value[/C][/ROW]
[ROW][C]1[/C][C]0.063647[/C][C]0.6038[/C][C]0.273746[/C][/ROW]
[ROW][C]2[/C][C]-0.14775[/C][C]-1.4017[/C][C]0.082225[/C][/ROW]
[ROW][C]3[/C][C]-0.408364[/C][C]-3.8741[/C][C]0.000101[/C][/ROW]
[ROW][C]4[/C][C]-0.387472[/C][C]-3.6759[/C][C]0.000201[/C][/ROW]
[ROW][C]5[/C][C]-0.039728[/C][C]-0.3769[/C][C]0.353569[/C][/ROW]
[ROW][C]6[/C][C]-0.032686[/C][C]-0.3101[/C][C]0.378607[/C][/ROW]
[ROW][C]7[/C][C]-0.148752[/C][C]-1.4112[/C][C]0.080819[/C][/ROW]
[ROW][C]8[/C][C]-0.249551[/C][C]-2.3675[/C][C]0.010027[/C][/ROW]
[ROW][C]9[/C][C]-0.202956[/C][C]-1.9254[/C][C]0.028668[/C][/ROW]
[ROW][C]10[/C][C]-0.148054[/C][C]-1.4046[/C][C]0.081796[/C][/ROW]
[ROW][C]11[/C][C]-0.255348[/C][C]-2.4224[/C][C]0.00871[/C][/ROW]
[ROW][C]12[/C][C]0.097954[/C][C]0.9293[/C][C]0.177617[/C][/ROW]
[ROW][C]13[/C][C]-0.223946[/C][C]-2.1245[/C][C]0.018183[/C][/ROW]
[ROW][C]14[/C][C]0.022636[/C][C]0.2147[/C][C]0.415226[/C][/ROW]
[ROW][C]15[/C][C]0.141271[/C][C]1.3402[/C][C]0.091774[/C][/ROW]
[ROW][C]16[/C][C]-0.011869[/C][C]-0.1126[/C][C]0.4553[/C][/ROW]
[ROW][C]17[/C][C]-0.014134[/C][C]-0.1341[/C][C]0.446817[/C][/ROW]
[ROW][C]18[/C][C]0.07543[/C][C]0.7156[/C][C]0.238048[/C][/ROW]
[ROW][C]19[/C][C]0.08546[/C][C]0.8107[/C][C]0.209824[/C][/ROW]
[ROW][C]20[/C][C]-0.008714[/C][C]-0.0827[/C][C]0.467151[/C][/ROW]
[ROW][C]21[/C][C]-0.011485[/C][C]-0.109[/C][C]0.456739[/C][/ROW]
[ROW][C]22[/C][C]0.107104[/C][C]1.0161[/C][C]0.156159[/C][/ROW]
[ROW][C]23[/C][C]-0.028267[/C][C]-0.2682[/C][C]0.394593[/C][/ROW]
[ROW][C]24[/C][C]-0.104346[/C][C]-0.9899[/C][C]0.162435[/C][/ROW]
[ROW][C]25[/C][C]-0.0811[/C][C]-0.7694[/C][C]0.221841[/C][/ROW]
[ROW][C]26[/C][C]-0.115547[/C][C]-1.0962[/C][C]0.137963[/C][/ROW]
[ROW][C]27[/C][C]0.061614[/C][C]0.5845[/C][C]0.280166[/C][/ROW]
[ROW][C]28[/C][C]-0.082142[/C][C]-0.7793[/C][C]0.218933[/C][/ROW]
[ROW][C]29[/C][C]0.081833[/C][C]0.7763[/C][C]0.219792[/C][/ROW]
[ROW][C]30[/C][C]-0.114384[/C][C]-1.0851[/C][C]0.140378[/C][/ROW]
[ROW][C]31[/C][C]0.053997[/C][C]0.5123[/C][C]0.304862[/C][/ROW]
[ROW][C]32[/C][C]-0.054159[/C][C]-0.5138[/C][C]0.304326[/C][/ROW]
[ROW][C]33[/C][C]0.124798[/C][C]1.1839[/C][C]0.119778[/C][/ROW]
[ROW][C]34[/C][C]0.035879[/C][C]0.3404[/C][C]0.367181[/C][/ROW]
[ROW][C]35[/C][C]-0.021756[/C][C]-0.2064[/C][C]0.418475[/C][/ROW]
[ROW][C]36[/C][C]-0.006473[/C][C]-0.0614[/C][C]0.475584[/C][/ROW]
[/TABLE]
Source: https://freestatistics.org/blog/index.php?pk=31597&T=2

Globally Unique Identifier (entire table): ba.freestatistics.org/blog/index.php?pk=31597&T=2

As an alternative you can also use a QR Code:  

The GUIDs for individual cells are displayed in the table below:

Partial Autocorrelation Function
Time lag kPACF(k)T-STATP-value
10.0636470.60380.273746
2-0.14775-1.40170.082225
3-0.408364-3.87410.000101
4-0.387472-3.67590.000201
5-0.039728-0.37690.353569
6-0.032686-0.31010.378607
7-0.148752-1.41120.080819
8-0.249551-2.36750.010027
9-0.202956-1.92540.028668
10-0.148054-1.40460.081796
11-0.255348-2.42240.00871
120.0979540.92930.177617
13-0.223946-2.12450.018183
140.0226360.21470.415226
150.1412711.34020.091774
16-0.011869-0.11260.4553
17-0.014134-0.13410.446817
180.075430.71560.238048
190.085460.81070.209824
20-0.008714-0.08270.467151
21-0.011485-0.1090.456739
220.1071041.01610.156159
23-0.028267-0.26820.394593
24-0.104346-0.98990.162435
25-0.0811-0.76940.221841
26-0.115547-1.09620.137963
270.0616140.58450.280166
28-0.082142-0.77930.218933
290.0818330.77630.219792
30-0.114384-1.08510.140378
310.0539970.51230.304862
32-0.054159-0.51380.304326
330.1247981.18390.119778
340.0358790.34040.367181
35-0.021756-0.20640.418475
36-0.006473-0.06140.475584


Parameters (Session):
par1 = 36 ; par2 = 1 ; par3 = 2 ; par4 = 0 ; par5 = 12 ;
Parameters (R input):
par1 = 36 ; par2 = 1 ; par3 = 2 ; par4 = 0 ; par5 = 12 ;
R code (references can be found in the software module):
if (par1 == 'Default') {
par1 = 10*log10(length(x))
} else {
par1 <- as.numeric(par1)
}
par2 <- as.numeric(par2)
par3 <- as.numeric(par3)
par4 <- as.numeric(par4)
par5 <- as.numeric(par5)
if (par2 == 0) {
x <- log(x)
} else {
x <- (x ^ par2 - 1) / par2
}
if (par3 > 0) x <- diff(x,lag=1,difference=par3)
if (par4 > 0) x <- diff(x,lag=par5,difference=par4)
bitmap(file='pic1.png')
racf <- acf(x,par1,main='Autocorrelation',xlab='lags',ylab='ACF')
dev.off()
bitmap(file='pic2.png')
rpacf <- pacf(x,par1,main='Partial Autocorrelation',xlab='lags',ylab='PACF')
dev.off()
(myacf <- c(racf$acf))
(mypacf <- c(rpacf$acf))
lengthx <- length(x)
sqrtn <- sqrt(lengthx)
load(file='createtable')
a<-table.start()
a<-table.row.start(a)
a<-table.element(a,'Autocorrelation Function',4,TRUE)
a<-table.row.end(a)
a<-table.row.start(a)
a<-table.element(a,'Time lag k',header=TRUE)
a<-table.element(a,hyperlink('basics.htm','ACF(k)','click here for more information about the Autocorrelation Function'),header=TRUE)
a<-table.element(a,'T-STAT',header=TRUE)
a<-table.element(a,'P-value',header=TRUE)
a<-table.row.end(a)
for (i in 2:(par1+1)) {
a<-table.row.start(a)
a<-table.element(a,i-1,header=TRUE)
a<-table.element(a,round(myacf[i],6))
mytstat <- myacf[i]*sqrtn
a<-table.element(a,round(mytstat,4))
a<-table.element(a,round(1-pt(abs(mytstat),lengthx),6))
a<-table.row.end(a)
}
a<-table.end(a)
table.save(a,file='mytable.tab')
a<-table.start()
a<-table.row.start(a)
a<-table.element(a,'Partial Autocorrelation Function',4,TRUE)
a<-table.row.end(a)
a<-table.row.start(a)
a<-table.element(a,'Time lag k',header=TRUE)
a<-table.element(a,hyperlink('basics.htm','PACF(k)','click here for more information about the Partial Autocorrelation Function'),header=TRUE)
a<-table.element(a,'T-STAT',header=TRUE)
a<-table.element(a,'P-value',header=TRUE)
a<-table.row.end(a)
for (i in 1:par1) {
a<-table.row.start(a)
a<-table.element(a,i,header=TRUE)
a<-table.element(a,round(mypacf[i],6))
mytstat <- mypacf[i]*sqrtn
a<-table.element(a,round(mytstat,4))
a<-table.element(a,round(1-pt(abs(mytstat),lengthx),6))
a<-table.row.end(a)
}
a<-table.end(a)
table.save(a,file='mytable1.tab')