Free Statistics

of Irreproducible Research!

Author's title

Author*Unverified author*
R Software Modulerwasp_autocorrelation.wasp
Title produced by software(Partial) Autocorrelation Function
Date of computationTue, 09 Dec 2008 07:51:57 -0700
Cite this page as followsStatistical Computations at FreeStatistics.org, Office for Research Development and Education, URL https://freestatistics.org/blog/index.php?v=date/2008/Dec/09/t12288343792woggw05d0odvcg.htm/, Retrieved Fri, 17 May 2024 06:38:44 +0000
Statistical Computations at FreeStatistics.org, Office for Research Development and Education, URL https://freestatistics.org/blog/index.php?pk=31488, Retrieved Fri, 17 May 2024 06:38:44 +0000
QR Codes:

Original text written by user:
IsPrivate?No (this computation is public)
User-defined keywords
Estimated Impact185
Family? (F = Feedback message, R = changed R code, M = changed R Module, P = changed Parameters, D = changed Data)
F       [(Partial) Autocorrelation Function] [Step2] [2008-12-09 14:51:57] [a413cf7744efd6bb212437a3916e2f23] [Current]
Feedback Forum
2008-12-14 13:22:24 [Gert-Jan Geudens] [reply
Geen conclusie betreffende deze ACF gegeven. Naar onze mening lijkt het hier voldoende om niet-seizonaal te differentiëren.
2008-12-15 14:27:45 [Jonas Scheltjens] [reply
De student heeft hier enkel de link en de grafiek gegeven zonder enige degelijke uitleg of verklaring. Aangezien het niet de taak is van de persoon die de assessments doet om deze taak voor de student te maken, verwijs ik dan ook voor de algemene en volledige uitleg voor deze Step naar Step 2 voor de unemployment data, dewelke ik zeer uitgebreid heb besproken en waar alle informatie in staat om deze vraag correct op te lossen.

Post a new message
Dataseries X:
1846.5
2796.3
2895.6
2472.2
2584.4
2630.4
2663.1
3176.2
2856.7
2551.4
3088.7
2628.3
2226.2
3023.6
3077.9
3084.1
2990.3
2949.6
3014.7
3517.7
3121.2
3067.4
3174.6
2676.3
2424
3195.1
3146.6
3506.7
3528.5
3365.1
3153
3843.3
3123.2
3361.1
3481.9
2970.5
2537
3257.6
3301.3
3391.6
2933.6
3283.2
3139.7
3486.4
3202.2
3294.4
3550.3
3279.3
2678.6
3451.4
3977.1
3814.8
3310.5
3971.8
4051.9
4057.6
4391.4
3628.9
4092.2
3822.5


Summary of computational transaction
Raw Inputview raw input (R code)
Raw Outputview raw output of R engine
Computing time3 seconds
R Server'Sir Ronald Aylmer Fisher' @ 193.190.124.24

\begin{tabular}{lllllllll}
\hline
Summary of computational transaction \tabularnewline
Raw Input & view raw input (R code)  \tabularnewline
Raw Output & view raw output of R engine  \tabularnewline
Computing time & 3 seconds \tabularnewline
R Server & 'Sir Ronald Aylmer Fisher' @ 193.190.124.24 \tabularnewline
\hline
\end{tabular}
%Source: https://freestatistics.org/blog/index.php?pk=31488&T=0

[TABLE]
[ROW][C]Summary of computational transaction[/C][/ROW]
[ROW][C]Raw Input[/C][C]view raw input (R code) [/C][/ROW]
[ROW][C]Raw Output[/C][C]view raw output of R engine [/C][/ROW]
[ROW][C]Computing time[/C][C]3 seconds[/C][/ROW]
[ROW][C]R Server[/C][C]'Sir Ronald Aylmer Fisher' @ 193.190.124.24[/C][/ROW]
[/TABLE]
Source: https://freestatistics.org/blog/index.php?pk=31488&T=0

Globally Unique Identifier (entire table): ba.freestatistics.org/blog/index.php?pk=31488&T=0

As an alternative you can also use a QR Code:  

The GUIDs for individual cells are displayed in the table below:

Summary of computational transaction
Raw Inputview raw input (R code)
Raw Outputview raw output of R engine
Computing time3 seconds
R Server'Sir Ronald Aylmer Fisher' @ 193.190.124.24


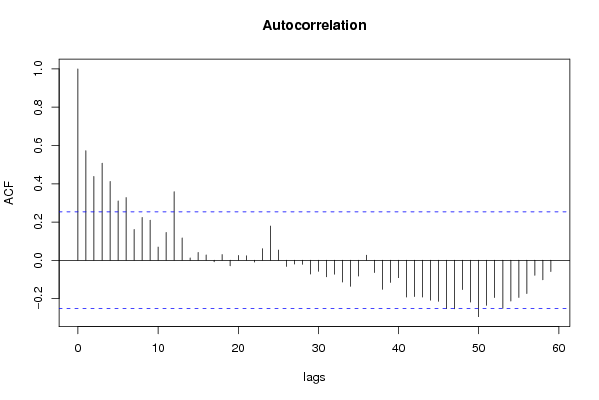
Autocorrelation Function
Time lag kACF(k)T-STATP-value
10.5729464.4382e-05
20.4385343.39690.000608
30.507753.9330.00011
40.4115393.18780.001139
50.3102022.40280.00969
60.3275532.53720.006896
70.1607891.24550.108902
80.2234681.7310.044298
90.2095771.62340.054876
100.0688660.53340.297851
110.1454391.12660.132206
120.3583012.77540.003671
130.1161680.89980.185904
140.0119490.09260.463282
150.0407480.31560.376689
160.0272950.21140.416636
17-0.007523-0.05830.476862
180.0297140.23020.409373
19-0.029179-0.2260.410976
200.025120.19460.42319
210.0231440.17930.429164
22-0.009254-0.07170.471548
230.0603450.46740.320943
240.1786521.38380.085769
250.0533370.41310.340486
26-0.032023-0.2480.402473
27-0.019748-0.1530.43947
28-0.021267-0.16470.434852
29-0.072115-0.55860.289258
30-0.057822-0.44790.327923
31-0.086566-0.67050.252543
32-0.072505-0.56160.288233
33-0.113692-0.88070.191009
34-0.135471-1.04940.149112
35-0.082444-0.63860.262754
360.0262220.20310.419866
37-0.063773-0.4940.31156
38-0.151454-1.17320.122684
39-0.115738-0.89650.186784
40-0.09064-0.70210.242669
41-0.191945-1.48680.071152
42-0.189647-1.4690.073529
43-0.191876-1.48630.071222
44-0.208308-1.61350.055937
45-0.214388-1.66060.051001
46-0.252754-1.95780.027453
47-0.253249-1.96170.027223
48-0.152459-1.18090.121143
49-0.217903-1.68790.048314
50-0.2946-2.2820.013026
51-0.234702-1.8180.037029
52-0.194214-1.50440.068865
53-0.250352-1.93920.028591
54-0.212745-1.64790.052299
55-0.194088-1.50340.068991
56-0.173901-1.3470.091518
57-0.078554-0.60850.272585
58-0.101521-0.78640.217371
59-0.059237-0.45880.324001
60NANANA

\begin{tabular}{lllllllll}
\hline
Autocorrelation Function \tabularnewline
Time lag k & ACF(k) & T-STAT & P-value \tabularnewline
1 & 0.572946 & 4.438 & 2e-05 \tabularnewline
2 & 0.438534 & 3.3969 & 0.000608 \tabularnewline
3 & 0.50775 & 3.933 & 0.00011 \tabularnewline
4 & 0.411539 & 3.1878 & 0.001139 \tabularnewline
5 & 0.310202 & 2.4028 & 0.00969 \tabularnewline
6 & 0.327553 & 2.5372 & 0.006896 \tabularnewline
7 & 0.160789 & 1.2455 & 0.108902 \tabularnewline
8 & 0.223468 & 1.731 & 0.044298 \tabularnewline
9 & 0.209577 & 1.6234 & 0.054876 \tabularnewline
10 & 0.068866 & 0.5334 & 0.297851 \tabularnewline
11 & 0.145439 & 1.1266 & 0.132206 \tabularnewline
12 & 0.358301 & 2.7754 & 0.003671 \tabularnewline
13 & 0.116168 & 0.8998 & 0.185904 \tabularnewline
14 & 0.011949 & 0.0926 & 0.463282 \tabularnewline
15 & 0.040748 & 0.3156 & 0.376689 \tabularnewline
16 & 0.027295 & 0.2114 & 0.416636 \tabularnewline
17 & -0.007523 & -0.0583 & 0.476862 \tabularnewline
18 & 0.029714 & 0.2302 & 0.409373 \tabularnewline
19 & -0.029179 & -0.226 & 0.410976 \tabularnewline
20 & 0.02512 & 0.1946 & 0.42319 \tabularnewline
21 & 0.023144 & 0.1793 & 0.429164 \tabularnewline
22 & -0.009254 & -0.0717 & 0.471548 \tabularnewline
23 & 0.060345 & 0.4674 & 0.320943 \tabularnewline
24 & 0.178652 & 1.3838 & 0.085769 \tabularnewline
25 & 0.053337 & 0.4131 & 0.340486 \tabularnewline
26 & -0.032023 & -0.248 & 0.402473 \tabularnewline
27 & -0.019748 & -0.153 & 0.43947 \tabularnewline
28 & -0.021267 & -0.1647 & 0.434852 \tabularnewline
29 & -0.072115 & -0.5586 & 0.289258 \tabularnewline
30 & -0.057822 & -0.4479 & 0.327923 \tabularnewline
31 & -0.086566 & -0.6705 & 0.252543 \tabularnewline
32 & -0.072505 & -0.5616 & 0.288233 \tabularnewline
33 & -0.113692 & -0.8807 & 0.191009 \tabularnewline
34 & -0.135471 & -1.0494 & 0.149112 \tabularnewline
35 & -0.082444 & -0.6386 & 0.262754 \tabularnewline
36 & 0.026222 & 0.2031 & 0.419866 \tabularnewline
37 & -0.063773 & -0.494 & 0.31156 \tabularnewline
38 & -0.151454 & -1.1732 & 0.122684 \tabularnewline
39 & -0.115738 & -0.8965 & 0.186784 \tabularnewline
40 & -0.09064 & -0.7021 & 0.242669 \tabularnewline
41 & -0.191945 & -1.4868 & 0.071152 \tabularnewline
42 & -0.189647 & -1.469 & 0.073529 \tabularnewline
43 & -0.191876 & -1.4863 & 0.071222 \tabularnewline
44 & -0.208308 & -1.6135 & 0.055937 \tabularnewline
45 & -0.214388 & -1.6606 & 0.051001 \tabularnewline
46 & -0.252754 & -1.9578 & 0.027453 \tabularnewline
47 & -0.253249 & -1.9617 & 0.027223 \tabularnewline
48 & -0.152459 & -1.1809 & 0.121143 \tabularnewline
49 & -0.217903 & -1.6879 & 0.048314 \tabularnewline
50 & -0.2946 & -2.282 & 0.013026 \tabularnewline
51 & -0.234702 & -1.818 & 0.037029 \tabularnewline
52 & -0.194214 & -1.5044 & 0.068865 \tabularnewline
53 & -0.250352 & -1.9392 & 0.028591 \tabularnewline
54 & -0.212745 & -1.6479 & 0.052299 \tabularnewline
55 & -0.194088 & -1.5034 & 0.068991 \tabularnewline
56 & -0.173901 & -1.347 & 0.091518 \tabularnewline
57 & -0.078554 & -0.6085 & 0.272585 \tabularnewline
58 & -0.101521 & -0.7864 & 0.217371 \tabularnewline
59 & -0.059237 & -0.4588 & 0.324001 \tabularnewline
60 & NA & NA & NA \tabularnewline
\hline
\end{tabular}
%Source: https://freestatistics.org/blog/index.php?pk=31488&T=1

[TABLE]
[ROW][C]Autocorrelation Function[/C][/ROW]
[ROW][C]Time lag k[/C][C]ACF(k)[/C][C]T-STAT[/C][C]P-value[/C][/ROW]
[ROW][C]1[/C][C]0.572946[/C][C]4.438[/C][C]2e-05[/C][/ROW]
[ROW][C]2[/C][C]0.438534[/C][C]3.3969[/C][C]0.000608[/C][/ROW]
[ROW][C]3[/C][C]0.50775[/C][C]3.933[/C][C]0.00011[/C][/ROW]
[ROW][C]4[/C][C]0.411539[/C][C]3.1878[/C][C]0.001139[/C][/ROW]
[ROW][C]5[/C][C]0.310202[/C][C]2.4028[/C][C]0.00969[/C][/ROW]
[ROW][C]6[/C][C]0.327553[/C][C]2.5372[/C][C]0.006896[/C][/ROW]
[ROW][C]7[/C][C]0.160789[/C][C]1.2455[/C][C]0.108902[/C][/ROW]
[ROW][C]8[/C][C]0.223468[/C][C]1.731[/C][C]0.044298[/C][/ROW]
[ROW][C]9[/C][C]0.209577[/C][C]1.6234[/C][C]0.054876[/C][/ROW]
[ROW][C]10[/C][C]0.068866[/C][C]0.5334[/C][C]0.297851[/C][/ROW]
[ROW][C]11[/C][C]0.145439[/C][C]1.1266[/C][C]0.132206[/C][/ROW]
[ROW][C]12[/C][C]0.358301[/C][C]2.7754[/C][C]0.003671[/C][/ROW]
[ROW][C]13[/C][C]0.116168[/C][C]0.8998[/C][C]0.185904[/C][/ROW]
[ROW][C]14[/C][C]0.011949[/C][C]0.0926[/C][C]0.463282[/C][/ROW]
[ROW][C]15[/C][C]0.040748[/C][C]0.3156[/C][C]0.376689[/C][/ROW]
[ROW][C]16[/C][C]0.027295[/C][C]0.2114[/C][C]0.416636[/C][/ROW]
[ROW][C]17[/C][C]-0.007523[/C][C]-0.0583[/C][C]0.476862[/C][/ROW]
[ROW][C]18[/C][C]0.029714[/C][C]0.2302[/C][C]0.409373[/C][/ROW]
[ROW][C]19[/C][C]-0.029179[/C][C]-0.226[/C][C]0.410976[/C][/ROW]
[ROW][C]20[/C][C]0.02512[/C][C]0.1946[/C][C]0.42319[/C][/ROW]
[ROW][C]21[/C][C]0.023144[/C][C]0.1793[/C][C]0.429164[/C][/ROW]
[ROW][C]22[/C][C]-0.009254[/C][C]-0.0717[/C][C]0.471548[/C][/ROW]
[ROW][C]23[/C][C]0.060345[/C][C]0.4674[/C][C]0.320943[/C][/ROW]
[ROW][C]24[/C][C]0.178652[/C][C]1.3838[/C][C]0.085769[/C][/ROW]
[ROW][C]25[/C][C]0.053337[/C][C]0.4131[/C][C]0.340486[/C][/ROW]
[ROW][C]26[/C][C]-0.032023[/C][C]-0.248[/C][C]0.402473[/C][/ROW]
[ROW][C]27[/C][C]-0.019748[/C][C]-0.153[/C][C]0.43947[/C][/ROW]
[ROW][C]28[/C][C]-0.021267[/C][C]-0.1647[/C][C]0.434852[/C][/ROW]
[ROW][C]29[/C][C]-0.072115[/C][C]-0.5586[/C][C]0.289258[/C][/ROW]
[ROW][C]30[/C][C]-0.057822[/C][C]-0.4479[/C][C]0.327923[/C][/ROW]
[ROW][C]31[/C][C]-0.086566[/C][C]-0.6705[/C][C]0.252543[/C][/ROW]
[ROW][C]32[/C][C]-0.072505[/C][C]-0.5616[/C][C]0.288233[/C][/ROW]
[ROW][C]33[/C][C]-0.113692[/C][C]-0.8807[/C][C]0.191009[/C][/ROW]
[ROW][C]34[/C][C]-0.135471[/C][C]-1.0494[/C][C]0.149112[/C][/ROW]
[ROW][C]35[/C][C]-0.082444[/C][C]-0.6386[/C][C]0.262754[/C][/ROW]
[ROW][C]36[/C][C]0.026222[/C][C]0.2031[/C][C]0.419866[/C][/ROW]
[ROW][C]37[/C][C]-0.063773[/C][C]-0.494[/C][C]0.31156[/C][/ROW]
[ROW][C]38[/C][C]-0.151454[/C][C]-1.1732[/C][C]0.122684[/C][/ROW]
[ROW][C]39[/C][C]-0.115738[/C][C]-0.8965[/C][C]0.186784[/C][/ROW]
[ROW][C]40[/C][C]-0.09064[/C][C]-0.7021[/C][C]0.242669[/C][/ROW]
[ROW][C]41[/C][C]-0.191945[/C][C]-1.4868[/C][C]0.071152[/C][/ROW]
[ROW][C]42[/C][C]-0.189647[/C][C]-1.469[/C][C]0.073529[/C][/ROW]
[ROW][C]43[/C][C]-0.191876[/C][C]-1.4863[/C][C]0.071222[/C][/ROW]
[ROW][C]44[/C][C]-0.208308[/C][C]-1.6135[/C][C]0.055937[/C][/ROW]
[ROW][C]45[/C][C]-0.214388[/C][C]-1.6606[/C][C]0.051001[/C][/ROW]
[ROW][C]46[/C][C]-0.252754[/C][C]-1.9578[/C][C]0.027453[/C][/ROW]
[ROW][C]47[/C][C]-0.253249[/C][C]-1.9617[/C][C]0.027223[/C][/ROW]
[ROW][C]48[/C][C]-0.152459[/C][C]-1.1809[/C][C]0.121143[/C][/ROW]
[ROW][C]49[/C][C]-0.217903[/C][C]-1.6879[/C][C]0.048314[/C][/ROW]
[ROW][C]50[/C][C]-0.2946[/C][C]-2.282[/C][C]0.013026[/C][/ROW]
[ROW][C]51[/C][C]-0.234702[/C][C]-1.818[/C][C]0.037029[/C][/ROW]
[ROW][C]52[/C][C]-0.194214[/C][C]-1.5044[/C][C]0.068865[/C][/ROW]
[ROW][C]53[/C][C]-0.250352[/C][C]-1.9392[/C][C]0.028591[/C][/ROW]
[ROW][C]54[/C][C]-0.212745[/C][C]-1.6479[/C][C]0.052299[/C][/ROW]
[ROW][C]55[/C][C]-0.194088[/C][C]-1.5034[/C][C]0.068991[/C][/ROW]
[ROW][C]56[/C][C]-0.173901[/C][C]-1.347[/C][C]0.091518[/C][/ROW]
[ROW][C]57[/C][C]-0.078554[/C][C]-0.6085[/C][C]0.272585[/C][/ROW]
[ROW][C]58[/C][C]-0.101521[/C][C]-0.7864[/C][C]0.217371[/C][/ROW]
[ROW][C]59[/C][C]-0.059237[/C][C]-0.4588[/C][C]0.324001[/C][/ROW]
[ROW][C]60[/C][C]NA[/C][C]NA[/C][C]NA[/C][/ROW]
[/TABLE]
Source: https://freestatistics.org/blog/index.php?pk=31488&T=1

Globally Unique Identifier (entire table): ba.freestatistics.org/blog/index.php?pk=31488&T=1

As an alternative you can also use a QR Code:  

The GUIDs for individual cells are displayed in the table below:

Autocorrelation Function
Time lag kACF(k)T-STATP-value
10.5729464.4382e-05
20.4385343.39690.000608
30.507753.9330.00011
40.4115393.18780.001139
50.3102022.40280.00969
60.3275532.53720.006896
70.1607891.24550.108902
80.2234681.7310.044298
90.2095771.62340.054876
100.0688660.53340.297851
110.1454391.12660.132206
120.3583012.77540.003671
130.1161680.89980.185904
140.0119490.09260.463282
150.0407480.31560.376689
160.0272950.21140.416636
17-0.007523-0.05830.476862
180.0297140.23020.409373
19-0.029179-0.2260.410976
200.025120.19460.42319
210.0231440.17930.429164
22-0.009254-0.07170.471548
230.0603450.46740.320943
240.1786521.38380.085769
250.0533370.41310.340486
26-0.032023-0.2480.402473
27-0.019748-0.1530.43947
28-0.021267-0.16470.434852
29-0.072115-0.55860.289258
30-0.057822-0.44790.327923
31-0.086566-0.67050.252543
32-0.072505-0.56160.288233
33-0.113692-0.88070.191009
34-0.135471-1.04940.149112
35-0.082444-0.63860.262754
360.0262220.20310.419866
37-0.063773-0.4940.31156
38-0.151454-1.17320.122684
39-0.115738-0.89650.186784
40-0.09064-0.70210.242669
41-0.191945-1.48680.071152
42-0.189647-1.4690.073529
43-0.191876-1.48630.071222
44-0.208308-1.61350.055937
45-0.214388-1.66060.051001
46-0.252754-1.95780.027453
47-0.253249-1.96170.027223
48-0.152459-1.18090.121143
49-0.217903-1.68790.048314
50-0.2946-2.2820.013026
51-0.234702-1.8180.037029
52-0.194214-1.50440.068865
53-0.250352-1.93920.028591
54-0.212745-1.64790.052299
55-0.194088-1.50340.068991
56-0.173901-1.3470.091518
57-0.078554-0.60850.272585
58-0.101521-0.78640.217371
59-0.059237-0.45880.324001
60NANANA


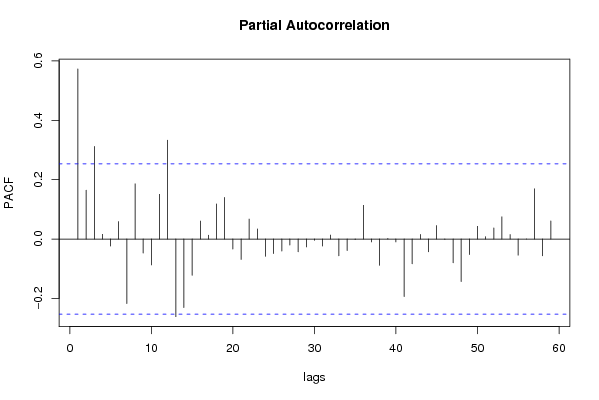
Partial Autocorrelation Function
Time lag kPACF(k)T-STATP-value
10.5729464.4382e-05
20.1641541.27150.104223
30.3116232.41380.009427
40.0157050.12160.451792
5-0.023698-0.18360.427487
60.0586010.45390.325761
7-0.217135-1.68190.048891
80.1858091.43930.077635
9-0.047082-0.36470.35831
10-0.087278-0.67610.250801
110.1504971.16570.124165
120.3327032.57710.00622
13-0.261578-2.02620.0236
14-0.231116-1.79020.039232
15-0.122053-0.94540.174118
160.0603080.46710.321045
170.0126680.09810.46108
180.1178560.91290.182472
190.1398151.0830.14157
20-0.033542-0.25980.397948
21-0.068663-0.53190.298392
220.0670510.51940.302706
230.0339930.26330.396609
24-0.058369-0.45210.326404
25-0.049038-0.37980.3527
26-0.0406-0.31450.377121
27-0.020336-0.15750.437681
28-0.043075-0.33370.369899
29-0.026528-0.20550.418943
30-0.004232-0.03280.48698
31-0.023699-0.18360.427483
320.0132880.10290.459181
33-0.056225-0.43550.332375
34-0.038819-0.30070.382345
35-0.001934-0.0150.494048
360.1134630.87890.191486
37-0.009845-0.07630.469733
38-0.088511-0.68560.247801
390.0019970.01550.493854
40-0.009727-0.07530.470097
41-0.193608-1.49970.06947
42-0.083425-0.64620.260305
430.0149890.11610.453978
44-0.042713-0.33090.370954
450.0451180.34950.363975
46-0.001294-0.010.496018
47-0.08004-0.620.268806
48-0.142978-1.10750.136248
49-0.052202-0.40440.343694
500.0427450.33110.370861
510.0074260.05750.477161
520.0375120.29060.386193
530.0746490.57820.282637
540.0149710.1160.454033
55-0.054324-0.42080.337705
56-0.000226-0.00170.499306
570.1690291.30930.097713
58-0.056293-0.4360.332184
590.0610460.47290.319015
60NANANA

\begin{tabular}{lllllllll}
\hline
Partial Autocorrelation Function \tabularnewline
Time lag k & PACF(k) & T-STAT & P-value \tabularnewline
1 & 0.572946 & 4.438 & 2e-05 \tabularnewline
2 & 0.164154 & 1.2715 & 0.104223 \tabularnewline
3 & 0.311623 & 2.4138 & 0.009427 \tabularnewline
4 & 0.015705 & 0.1216 & 0.451792 \tabularnewline
5 & -0.023698 & -0.1836 & 0.427487 \tabularnewline
6 & 0.058601 & 0.4539 & 0.325761 \tabularnewline
7 & -0.217135 & -1.6819 & 0.048891 \tabularnewline
8 & 0.185809 & 1.4393 & 0.077635 \tabularnewline
9 & -0.047082 & -0.3647 & 0.35831 \tabularnewline
10 & -0.087278 & -0.6761 & 0.250801 \tabularnewline
11 & 0.150497 & 1.1657 & 0.124165 \tabularnewline
12 & 0.332703 & 2.5771 & 0.00622 \tabularnewline
13 & -0.261578 & -2.0262 & 0.0236 \tabularnewline
14 & -0.231116 & -1.7902 & 0.039232 \tabularnewline
15 & -0.122053 & -0.9454 & 0.174118 \tabularnewline
16 & 0.060308 & 0.4671 & 0.321045 \tabularnewline
17 & 0.012668 & 0.0981 & 0.46108 \tabularnewline
18 & 0.117856 & 0.9129 & 0.182472 \tabularnewline
19 & 0.139815 & 1.083 & 0.14157 \tabularnewline
20 & -0.033542 & -0.2598 & 0.397948 \tabularnewline
21 & -0.068663 & -0.5319 & 0.298392 \tabularnewline
22 & 0.067051 & 0.5194 & 0.302706 \tabularnewline
23 & 0.033993 & 0.2633 & 0.396609 \tabularnewline
24 & -0.058369 & -0.4521 & 0.326404 \tabularnewline
25 & -0.049038 & -0.3798 & 0.3527 \tabularnewline
26 & -0.0406 & -0.3145 & 0.377121 \tabularnewline
27 & -0.020336 & -0.1575 & 0.437681 \tabularnewline
28 & -0.043075 & -0.3337 & 0.369899 \tabularnewline
29 & -0.026528 & -0.2055 & 0.418943 \tabularnewline
30 & -0.004232 & -0.0328 & 0.48698 \tabularnewline
31 & -0.023699 & -0.1836 & 0.427483 \tabularnewline
32 & 0.013288 & 0.1029 & 0.459181 \tabularnewline
33 & -0.056225 & -0.4355 & 0.332375 \tabularnewline
34 & -0.038819 & -0.3007 & 0.382345 \tabularnewline
35 & -0.001934 & -0.015 & 0.494048 \tabularnewline
36 & 0.113463 & 0.8789 & 0.191486 \tabularnewline
37 & -0.009845 & -0.0763 & 0.469733 \tabularnewline
38 & -0.088511 & -0.6856 & 0.247801 \tabularnewline
39 & 0.001997 & 0.0155 & 0.493854 \tabularnewline
40 & -0.009727 & -0.0753 & 0.470097 \tabularnewline
41 & -0.193608 & -1.4997 & 0.06947 \tabularnewline
42 & -0.083425 & -0.6462 & 0.260305 \tabularnewline
43 & 0.014989 & 0.1161 & 0.453978 \tabularnewline
44 & -0.042713 & -0.3309 & 0.370954 \tabularnewline
45 & 0.045118 & 0.3495 & 0.363975 \tabularnewline
46 & -0.001294 & -0.01 & 0.496018 \tabularnewline
47 & -0.08004 & -0.62 & 0.268806 \tabularnewline
48 & -0.142978 & -1.1075 & 0.136248 \tabularnewline
49 & -0.052202 & -0.4044 & 0.343694 \tabularnewline
50 & 0.042745 & 0.3311 & 0.370861 \tabularnewline
51 & 0.007426 & 0.0575 & 0.477161 \tabularnewline
52 & 0.037512 & 0.2906 & 0.386193 \tabularnewline
53 & 0.074649 & 0.5782 & 0.282637 \tabularnewline
54 & 0.014971 & 0.116 & 0.454033 \tabularnewline
55 & -0.054324 & -0.4208 & 0.337705 \tabularnewline
56 & -0.000226 & -0.0017 & 0.499306 \tabularnewline
57 & 0.169029 & 1.3093 & 0.097713 \tabularnewline
58 & -0.056293 & -0.436 & 0.332184 \tabularnewline
59 & 0.061046 & 0.4729 & 0.319015 \tabularnewline
60 & NA & NA & NA \tabularnewline
\hline
\end{tabular}
%Source: https://freestatistics.org/blog/index.php?pk=31488&T=2

[TABLE]
[ROW][C]Partial Autocorrelation Function[/C][/ROW]
[ROW][C]Time lag k[/C][C]PACF(k)[/C][C]T-STAT[/C][C]P-value[/C][/ROW]
[ROW][C]1[/C][C]0.572946[/C][C]4.438[/C][C]2e-05[/C][/ROW]
[ROW][C]2[/C][C]0.164154[/C][C]1.2715[/C][C]0.104223[/C][/ROW]
[ROW][C]3[/C][C]0.311623[/C][C]2.4138[/C][C]0.009427[/C][/ROW]
[ROW][C]4[/C][C]0.015705[/C][C]0.1216[/C][C]0.451792[/C][/ROW]
[ROW][C]5[/C][C]-0.023698[/C][C]-0.1836[/C][C]0.427487[/C][/ROW]
[ROW][C]6[/C][C]0.058601[/C][C]0.4539[/C][C]0.325761[/C][/ROW]
[ROW][C]7[/C][C]-0.217135[/C][C]-1.6819[/C][C]0.048891[/C][/ROW]
[ROW][C]8[/C][C]0.185809[/C][C]1.4393[/C][C]0.077635[/C][/ROW]
[ROW][C]9[/C][C]-0.047082[/C][C]-0.3647[/C][C]0.35831[/C][/ROW]
[ROW][C]10[/C][C]-0.087278[/C][C]-0.6761[/C][C]0.250801[/C][/ROW]
[ROW][C]11[/C][C]0.150497[/C][C]1.1657[/C][C]0.124165[/C][/ROW]
[ROW][C]12[/C][C]0.332703[/C][C]2.5771[/C][C]0.00622[/C][/ROW]
[ROW][C]13[/C][C]-0.261578[/C][C]-2.0262[/C][C]0.0236[/C][/ROW]
[ROW][C]14[/C][C]-0.231116[/C][C]-1.7902[/C][C]0.039232[/C][/ROW]
[ROW][C]15[/C][C]-0.122053[/C][C]-0.9454[/C][C]0.174118[/C][/ROW]
[ROW][C]16[/C][C]0.060308[/C][C]0.4671[/C][C]0.321045[/C][/ROW]
[ROW][C]17[/C][C]0.012668[/C][C]0.0981[/C][C]0.46108[/C][/ROW]
[ROW][C]18[/C][C]0.117856[/C][C]0.9129[/C][C]0.182472[/C][/ROW]
[ROW][C]19[/C][C]0.139815[/C][C]1.083[/C][C]0.14157[/C][/ROW]
[ROW][C]20[/C][C]-0.033542[/C][C]-0.2598[/C][C]0.397948[/C][/ROW]
[ROW][C]21[/C][C]-0.068663[/C][C]-0.5319[/C][C]0.298392[/C][/ROW]
[ROW][C]22[/C][C]0.067051[/C][C]0.5194[/C][C]0.302706[/C][/ROW]
[ROW][C]23[/C][C]0.033993[/C][C]0.2633[/C][C]0.396609[/C][/ROW]
[ROW][C]24[/C][C]-0.058369[/C][C]-0.4521[/C][C]0.326404[/C][/ROW]
[ROW][C]25[/C][C]-0.049038[/C][C]-0.3798[/C][C]0.3527[/C][/ROW]
[ROW][C]26[/C][C]-0.0406[/C][C]-0.3145[/C][C]0.377121[/C][/ROW]
[ROW][C]27[/C][C]-0.020336[/C][C]-0.1575[/C][C]0.437681[/C][/ROW]
[ROW][C]28[/C][C]-0.043075[/C][C]-0.3337[/C][C]0.369899[/C][/ROW]
[ROW][C]29[/C][C]-0.026528[/C][C]-0.2055[/C][C]0.418943[/C][/ROW]
[ROW][C]30[/C][C]-0.004232[/C][C]-0.0328[/C][C]0.48698[/C][/ROW]
[ROW][C]31[/C][C]-0.023699[/C][C]-0.1836[/C][C]0.427483[/C][/ROW]
[ROW][C]32[/C][C]0.013288[/C][C]0.1029[/C][C]0.459181[/C][/ROW]
[ROW][C]33[/C][C]-0.056225[/C][C]-0.4355[/C][C]0.332375[/C][/ROW]
[ROW][C]34[/C][C]-0.038819[/C][C]-0.3007[/C][C]0.382345[/C][/ROW]
[ROW][C]35[/C][C]-0.001934[/C][C]-0.015[/C][C]0.494048[/C][/ROW]
[ROW][C]36[/C][C]0.113463[/C][C]0.8789[/C][C]0.191486[/C][/ROW]
[ROW][C]37[/C][C]-0.009845[/C][C]-0.0763[/C][C]0.469733[/C][/ROW]
[ROW][C]38[/C][C]-0.088511[/C][C]-0.6856[/C][C]0.247801[/C][/ROW]
[ROW][C]39[/C][C]0.001997[/C][C]0.0155[/C][C]0.493854[/C][/ROW]
[ROW][C]40[/C][C]-0.009727[/C][C]-0.0753[/C][C]0.470097[/C][/ROW]
[ROW][C]41[/C][C]-0.193608[/C][C]-1.4997[/C][C]0.06947[/C][/ROW]
[ROW][C]42[/C][C]-0.083425[/C][C]-0.6462[/C][C]0.260305[/C][/ROW]
[ROW][C]43[/C][C]0.014989[/C][C]0.1161[/C][C]0.453978[/C][/ROW]
[ROW][C]44[/C][C]-0.042713[/C][C]-0.3309[/C][C]0.370954[/C][/ROW]
[ROW][C]45[/C][C]0.045118[/C][C]0.3495[/C][C]0.363975[/C][/ROW]
[ROW][C]46[/C][C]-0.001294[/C][C]-0.01[/C][C]0.496018[/C][/ROW]
[ROW][C]47[/C][C]-0.08004[/C][C]-0.62[/C][C]0.268806[/C][/ROW]
[ROW][C]48[/C][C]-0.142978[/C][C]-1.1075[/C][C]0.136248[/C][/ROW]
[ROW][C]49[/C][C]-0.052202[/C][C]-0.4044[/C][C]0.343694[/C][/ROW]
[ROW][C]50[/C][C]0.042745[/C][C]0.3311[/C][C]0.370861[/C][/ROW]
[ROW][C]51[/C][C]0.007426[/C][C]0.0575[/C][C]0.477161[/C][/ROW]
[ROW][C]52[/C][C]0.037512[/C][C]0.2906[/C][C]0.386193[/C][/ROW]
[ROW][C]53[/C][C]0.074649[/C][C]0.5782[/C][C]0.282637[/C][/ROW]
[ROW][C]54[/C][C]0.014971[/C][C]0.116[/C][C]0.454033[/C][/ROW]
[ROW][C]55[/C][C]-0.054324[/C][C]-0.4208[/C][C]0.337705[/C][/ROW]
[ROW][C]56[/C][C]-0.000226[/C][C]-0.0017[/C][C]0.499306[/C][/ROW]
[ROW][C]57[/C][C]0.169029[/C][C]1.3093[/C][C]0.097713[/C][/ROW]
[ROW][C]58[/C][C]-0.056293[/C][C]-0.436[/C][C]0.332184[/C][/ROW]
[ROW][C]59[/C][C]0.061046[/C][C]0.4729[/C][C]0.319015[/C][/ROW]
[ROW][C]60[/C][C]NA[/C][C]NA[/C][C]NA[/C][/ROW]
[/TABLE]
Source: https://freestatistics.org/blog/index.php?pk=31488&T=2

Globally Unique Identifier (entire table): ba.freestatistics.org/blog/index.php?pk=31488&T=2

As an alternative you can also use a QR Code:  

The GUIDs for individual cells are displayed in the table below:

Partial Autocorrelation Function
Time lag kPACF(k)T-STATP-value
10.5729464.4382e-05
20.1641541.27150.104223
30.3116232.41380.009427
40.0157050.12160.451792
5-0.023698-0.18360.427487
60.0586010.45390.325761
7-0.217135-1.68190.048891
80.1858091.43930.077635
9-0.047082-0.36470.35831
10-0.087278-0.67610.250801
110.1504971.16570.124165
120.3327032.57710.00622
13-0.261578-2.02620.0236
14-0.231116-1.79020.039232
15-0.122053-0.94540.174118
160.0603080.46710.321045
170.0126680.09810.46108
180.1178560.91290.182472
190.1398151.0830.14157
20-0.033542-0.25980.397948
21-0.068663-0.53190.298392
220.0670510.51940.302706
230.0339930.26330.396609
24-0.058369-0.45210.326404
25-0.049038-0.37980.3527
26-0.0406-0.31450.377121
27-0.020336-0.15750.437681
28-0.043075-0.33370.369899
29-0.026528-0.20550.418943
30-0.004232-0.03280.48698
31-0.023699-0.18360.427483
320.0132880.10290.459181
33-0.056225-0.43550.332375
34-0.038819-0.30070.382345
35-0.001934-0.0150.494048
360.1134630.87890.191486
37-0.009845-0.07630.469733
38-0.088511-0.68560.247801
390.0019970.01550.493854
40-0.009727-0.07530.470097
41-0.193608-1.49970.06947
42-0.083425-0.64620.260305
430.0149890.11610.453978
44-0.042713-0.33090.370954
450.0451180.34950.363975
46-0.001294-0.010.496018
47-0.08004-0.620.268806
48-0.142978-1.10750.136248
49-0.052202-0.40440.343694
500.0427450.33110.370861
510.0074260.05750.477161
520.0375120.29060.386193
530.0746490.57820.282637
540.0149710.1160.454033
55-0.054324-0.42080.337705
56-0.000226-0.00170.499306
570.1690291.30930.097713
58-0.056293-0.4360.332184
590.0610460.47290.319015
60NANANA


Parameters (Session):
par1 = 60 ; par2 = 1 ; par3 = 0 ; par4 = 0 ; par5 = 12 ;
Parameters (R input):
par1 = 60 ; par2 = 1 ; par3 = 0 ; par4 = 0 ; par5 = 12 ;
R code (references can be found in the software module):
if (par1 == 'Default') {
par1 = 10*log10(length(x))
} else {
par1 <- as.numeric(par1)
}
par2 <- as.numeric(par2)
par3 <- as.numeric(par3)
par4 <- as.numeric(par4)
par5 <- as.numeric(par5)
if (par2 == 0) {
x <- log(x)
} else {
x <- (x ^ par2 - 1) / par2
}
if (par3 > 0) x <- diff(x,lag=1,difference=par3)
if (par4 > 0) x <- diff(x,lag=par5,difference=par4)
bitmap(file='pic1.png')
racf <- acf(x,par1,main='Autocorrelation',xlab='lags',ylab='ACF')
dev.off()
bitmap(file='pic2.png')
rpacf <- pacf(x,par1,main='Partial Autocorrelation',xlab='lags',ylab='PACF')
dev.off()
(myacf <- c(racf$acf))
(mypacf <- c(rpacf$acf))
lengthx <- length(x)
sqrtn <- sqrt(lengthx)
load(file='createtable')
a<-table.start()
a<-table.row.start(a)
a<-table.element(a,'Autocorrelation Function',4,TRUE)
a<-table.row.end(a)
a<-table.row.start(a)
a<-table.element(a,'Time lag k',header=TRUE)
a<-table.element(a,hyperlink('basics.htm','ACF(k)','click here for more information about the Autocorrelation Function'),header=TRUE)
a<-table.element(a,'T-STAT',header=TRUE)
a<-table.element(a,'P-value',header=TRUE)
a<-table.row.end(a)
for (i in 2:(par1+1)) {
a<-table.row.start(a)
a<-table.element(a,i-1,header=TRUE)
a<-table.element(a,round(myacf[i],6))
mytstat <- myacf[i]*sqrtn
a<-table.element(a,round(mytstat,4))
a<-table.element(a,round(1-pt(abs(mytstat),lengthx),6))
a<-table.row.end(a)
}
a<-table.end(a)
table.save(a,file='mytable.tab')
a<-table.start()
a<-table.row.start(a)
a<-table.element(a,'Partial Autocorrelation Function',4,TRUE)
a<-table.row.end(a)
a<-table.row.start(a)
a<-table.element(a,'Time lag k',header=TRUE)
a<-table.element(a,hyperlink('basics.htm','PACF(k)','click here for more information about the Partial Autocorrelation Function'),header=TRUE)
a<-table.element(a,'T-STAT',header=TRUE)
a<-table.element(a,'P-value',header=TRUE)
a<-table.row.end(a)
for (i in 1:par1) {
a<-table.row.start(a)
a<-table.element(a,i,header=TRUE)
a<-table.element(a,round(mypacf[i],6))
mytstat <- mypacf[i]*sqrtn
a<-table.element(a,round(mytstat,4))
a<-table.element(a,round(1-pt(abs(mytstat),lengthx),6))
a<-table.row.end(a)
}
a<-table.end(a)
table.save(a,file='mytable1.tab')