Free Statistics

of Irreproducible Research!

Author's title

Author*The author of this computation has been verified*
R Software Modulerwasp_autocorrelation.wasp
Title produced by software(Partial) Autocorrelation Function
Date of computationTue, 09 Dec 2008 07:01:52 -0700
Cite this page as followsStatistical Computations at FreeStatistics.org, Office for Research Development and Education, URL https://freestatistics.org/blog/index.php?v=date/2008/Dec/09/t1228831421d22xs2caxiwao11.htm/, Retrieved Fri, 17 May 2024 03:04:59 +0000
Statistical Computations at FreeStatistics.org, Office for Research Development and Education, URL https://freestatistics.org/blog/index.php?pk=31407, Retrieved Fri, 17 May 2024 03:04:59 +0000
QR Codes:

Original text written by user:
IsPrivate?No (this computation is public)
User-defined keywords
Estimated Impact206
Family? (F = Feedback message, R = changed R code, M = changed R Module, P = changed Parameters, D = changed Data)
F     [Univariate Data Series] [Airline data] [2007-10-18 09:58:47] [42daae401fd3def69a25014f2252b4c2]
F RMPD  [Spectral Analysis] [airline data] [2008-12-02 12:35:12] [0e5eff269cdcaf8789c45b6ee36b0c3d]
F RMPD    [Cross Correlation Function] [airline data] [2008-12-02 13:18:05] [0e5eff269cdcaf8789c45b6ee36b0c3d]
- RMPD      [(Partial) Autocorrelation Function] [paper] [2008-12-02 14:55:43] [0e5eff269cdcaf8789c45b6ee36b0c3d]
-   P           [(Partial) Autocorrelation Function] [cf] [2008-12-09 14:01:52] [09074fbe368d26382bb94e5bb318a104] [Current]
Feedback Forum

Post a new message
Dataseries X:
1202454.6
1201423.4
1505916
1513377.6
1977605.3
1873829.6
1424049.1
1322740
1584825.5
1680460.3
1648573.7
3095468.7
1307982.9
1367588.9
1572718.3
1611602.9
1641196.4
1845262.4
1464237.6
1402385.7
2077099.8
1691129.6
1729012.7
3347792.1
1365087.7
1545460
1844355.1
1775549.8
1721779.2
2128726.1
1664319.9
1769471.4
1904578.4
1872042.3
1802181
3222199.4
1491414.2
1658519.2
2079206.9
1748767.4
2084447.4
2067181.6
1718122.8
1782337.1
1958118.4
2028681.3
2076128.1
3383873
1870369
1654852.9
2074338.3
1888653.7
1991137.8
2168237.9
1867424.1
1842359.6
1927476.3
2065555.4
2455608.5
3336170.9


Summary of computational transaction
Raw Inputview raw input (R code)
Raw Outputview raw output of R engine
Computing time1 seconds
R Server'Gwilym Jenkins' @ 72.249.127.135

\begin{tabular}{lllllllll}
\hline
Summary of computational transaction \tabularnewline
Raw Input & view raw input (R code)  \tabularnewline
Raw Output & view raw output of R engine  \tabularnewline
Computing time & 1 seconds \tabularnewline
R Server & 'Gwilym Jenkins' @ 72.249.127.135 \tabularnewline
\hline
\end{tabular}
%Source: https://freestatistics.org/blog/index.php?pk=31407&T=0

[TABLE]
[ROW][C]Summary of computational transaction[/C][/ROW]
[ROW][C]Raw Input[/C][C]view raw input (R code) [/C][/ROW]
[ROW][C]Raw Output[/C][C]view raw output of R engine [/C][/ROW]
[ROW][C]Computing time[/C][C]1 seconds[/C][/ROW]
[ROW][C]R Server[/C][C]'Gwilym Jenkins' @ 72.249.127.135[/C][/ROW]
[/TABLE]
Source: https://freestatistics.org/blog/index.php?pk=31407&T=0

Globally Unique Identifier (entire table): ba.freestatistics.org/blog/index.php?pk=31407&T=0

As an alternative you can also use a QR Code:  

The GUIDs for individual cells are displayed in the table below:

Summary of computational transaction
Raw Inputview raw input (R code)
Raw Outputview raw output of R engine
Computing time1 seconds
R Server'Gwilym Jenkins' @ 72.249.127.135


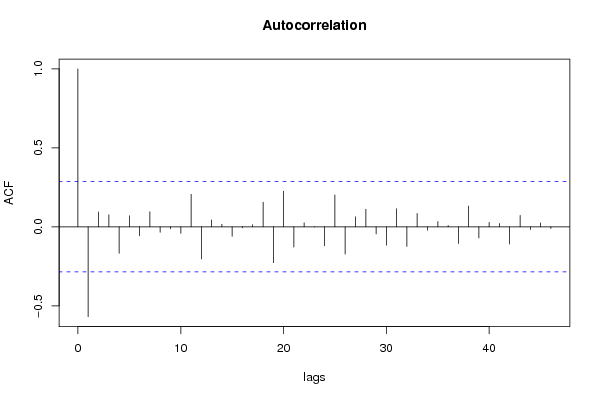
Autocorrelation Function
Time lag kACF(k)T-STATP-value
1-0.568941-3.90050.000152
20.0940410.64470.261124
30.0758020.51970.302865
4-0.167888-1.1510.127781
50.070030.48010.31669
6-0.056917-0.39020.349074
70.0948440.65020.259358
8-0.034718-0.2380.406452
9-0.012456-0.08540.466156
10-0.040731-0.27920.390645
110.206061.41270.082169
12-0.203116-1.39250.085163
130.0438890.30090.382414
140.0169890.11650.453889
15-0.060274-0.41320.340663
16-0.006257-0.04290.482984
170.0132790.0910.463926
180.1563981.07220.14455
19-0.227242-1.55790.062984
200.2255251.54610.064392
21-0.128178-0.87870.192006
220.0253620.17390.431357
23-0.000439-0.0030.498805
24-0.1201-0.82340.20723
250.2016331.38230.086703
26-0.172855-1.1850.120981
270.0635630.43580.332501
280.1117120.76590.223796
29-0.044926-0.3080.379722
30-0.115941-0.79490.215347
310.1150370.78870.217137
32-0.124059-0.85050.199677
330.0851620.58380.281058
34-0.021643-0.14840.44134
350.0335850.23020.409449
360.0087920.06030.476097
37-0.106185-0.7280.235123
380.1317580.90330.185489
39-0.07064-0.48430.315216
400.0281970.19330.423776
410.0218020.14950.440912
42-0.109167-0.74840.228971
430.0722480.49530.311345
44-0.017191-0.11790.453342
450.024880.17060.432647
46-0.010725-0.07350.47085
47NANANA
48NANANA
49NANANA
50NANANA
51NANANA
52NANANA
53NANANA
54NANANA
55NANANA
56NANANA
57NANANA
58NANANA
59NANANA
60NANANA

\begin{tabular}{lllllllll}
\hline
Autocorrelation Function \tabularnewline
Time lag k & ACF(k) & T-STAT & P-value \tabularnewline
1 & -0.568941 & -3.9005 & 0.000152 \tabularnewline
2 & 0.094041 & 0.6447 & 0.261124 \tabularnewline
3 & 0.075802 & 0.5197 & 0.302865 \tabularnewline
4 & -0.167888 & -1.151 & 0.127781 \tabularnewline
5 & 0.07003 & 0.4801 & 0.31669 \tabularnewline
6 & -0.056917 & -0.3902 & 0.349074 \tabularnewline
7 & 0.094844 & 0.6502 & 0.259358 \tabularnewline
8 & -0.034718 & -0.238 & 0.406452 \tabularnewline
9 & -0.012456 & -0.0854 & 0.466156 \tabularnewline
10 & -0.040731 & -0.2792 & 0.390645 \tabularnewline
11 & 0.20606 & 1.4127 & 0.082169 \tabularnewline
12 & -0.203116 & -1.3925 & 0.085163 \tabularnewline
13 & 0.043889 & 0.3009 & 0.382414 \tabularnewline
14 & 0.016989 & 0.1165 & 0.453889 \tabularnewline
15 & -0.060274 & -0.4132 & 0.340663 \tabularnewline
16 & -0.006257 & -0.0429 & 0.482984 \tabularnewline
17 & 0.013279 & 0.091 & 0.463926 \tabularnewline
18 & 0.156398 & 1.0722 & 0.14455 \tabularnewline
19 & -0.227242 & -1.5579 & 0.062984 \tabularnewline
20 & 0.225525 & 1.5461 & 0.064392 \tabularnewline
21 & -0.128178 & -0.8787 & 0.192006 \tabularnewline
22 & 0.025362 & 0.1739 & 0.431357 \tabularnewline
23 & -0.000439 & -0.003 & 0.498805 \tabularnewline
24 & -0.1201 & -0.8234 & 0.20723 \tabularnewline
25 & 0.201633 & 1.3823 & 0.086703 \tabularnewline
26 & -0.172855 & -1.185 & 0.120981 \tabularnewline
27 & 0.063563 & 0.4358 & 0.332501 \tabularnewline
28 & 0.111712 & 0.7659 & 0.223796 \tabularnewline
29 & -0.044926 & -0.308 & 0.379722 \tabularnewline
30 & -0.115941 & -0.7949 & 0.215347 \tabularnewline
31 & 0.115037 & 0.7887 & 0.217137 \tabularnewline
32 & -0.124059 & -0.8505 & 0.199677 \tabularnewline
33 & 0.085162 & 0.5838 & 0.281058 \tabularnewline
34 & -0.021643 & -0.1484 & 0.44134 \tabularnewline
35 & 0.033585 & 0.2302 & 0.409449 \tabularnewline
36 & 0.008792 & 0.0603 & 0.476097 \tabularnewline
37 & -0.106185 & -0.728 & 0.235123 \tabularnewline
38 & 0.131758 & 0.9033 & 0.185489 \tabularnewline
39 & -0.07064 & -0.4843 & 0.315216 \tabularnewline
40 & 0.028197 & 0.1933 & 0.423776 \tabularnewline
41 & 0.021802 & 0.1495 & 0.440912 \tabularnewline
42 & -0.109167 & -0.7484 & 0.228971 \tabularnewline
43 & 0.072248 & 0.4953 & 0.311345 \tabularnewline
44 & -0.017191 & -0.1179 & 0.453342 \tabularnewline
45 & 0.02488 & 0.1706 & 0.432647 \tabularnewline
46 & -0.010725 & -0.0735 & 0.47085 \tabularnewline
47 & NA & NA & NA \tabularnewline
48 & NA & NA & NA \tabularnewline
49 & NA & NA & NA \tabularnewline
50 & NA & NA & NA \tabularnewline
51 & NA & NA & NA \tabularnewline
52 & NA & NA & NA \tabularnewline
53 & NA & NA & NA \tabularnewline
54 & NA & NA & NA \tabularnewline
55 & NA & NA & NA \tabularnewline
56 & NA & NA & NA \tabularnewline
57 & NA & NA & NA \tabularnewline
58 & NA & NA & NA \tabularnewline
59 & NA & NA & NA \tabularnewline
60 & NA & NA & NA \tabularnewline
\hline
\end{tabular}
%Source: https://freestatistics.org/blog/index.php?pk=31407&T=1

[TABLE]
[ROW][C]Autocorrelation Function[/C][/ROW]
[ROW][C]Time lag k[/C][C]ACF(k)[/C][C]T-STAT[/C][C]P-value[/C][/ROW]
[ROW][C]1[/C][C]-0.568941[/C][C]-3.9005[/C][C]0.000152[/C][/ROW]
[ROW][C]2[/C][C]0.094041[/C][C]0.6447[/C][C]0.261124[/C][/ROW]
[ROW][C]3[/C][C]0.075802[/C][C]0.5197[/C][C]0.302865[/C][/ROW]
[ROW][C]4[/C][C]-0.167888[/C][C]-1.151[/C][C]0.127781[/C][/ROW]
[ROW][C]5[/C][C]0.07003[/C][C]0.4801[/C][C]0.31669[/C][/ROW]
[ROW][C]6[/C][C]-0.056917[/C][C]-0.3902[/C][C]0.349074[/C][/ROW]
[ROW][C]7[/C][C]0.094844[/C][C]0.6502[/C][C]0.259358[/C][/ROW]
[ROW][C]8[/C][C]-0.034718[/C][C]-0.238[/C][C]0.406452[/C][/ROW]
[ROW][C]9[/C][C]-0.012456[/C][C]-0.0854[/C][C]0.466156[/C][/ROW]
[ROW][C]10[/C][C]-0.040731[/C][C]-0.2792[/C][C]0.390645[/C][/ROW]
[ROW][C]11[/C][C]0.20606[/C][C]1.4127[/C][C]0.082169[/C][/ROW]
[ROW][C]12[/C][C]-0.203116[/C][C]-1.3925[/C][C]0.085163[/C][/ROW]
[ROW][C]13[/C][C]0.043889[/C][C]0.3009[/C][C]0.382414[/C][/ROW]
[ROW][C]14[/C][C]0.016989[/C][C]0.1165[/C][C]0.453889[/C][/ROW]
[ROW][C]15[/C][C]-0.060274[/C][C]-0.4132[/C][C]0.340663[/C][/ROW]
[ROW][C]16[/C][C]-0.006257[/C][C]-0.0429[/C][C]0.482984[/C][/ROW]
[ROW][C]17[/C][C]0.013279[/C][C]0.091[/C][C]0.463926[/C][/ROW]
[ROW][C]18[/C][C]0.156398[/C][C]1.0722[/C][C]0.14455[/C][/ROW]
[ROW][C]19[/C][C]-0.227242[/C][C]-1.5579[/C][C]0.062984[/C][/ROW]
[ROW][C]20[/C][C]0.225525[/C][C]1.5461[/C][C]0.064392[/C][/ROW]
[ROW][C]21[/C][C]-0.128178[/C][C]-0.8787[/C][C]0.192006[/C][/ROW]
[ROW][C]22[/C][C]0.025362[/C][C]0.1739[/C][C]0.431357[/C][/ROW]
[ROW][C]23[/C][C]-0.000439[/C][C]-0.003[/C][C]0.498805[/C][/ROW]
[ROW][C]24[/C][C]-0.1201[/C][C]-0.8234[/C][C]0.20723[/C][/ROW]
[ROW][C]25[/C][C]0.201633[/C][C]1.3823[/C][C]0.086703[/C][/ROW]
[ROW][C]26[/C][C]-0.172855[/C][C]-1.185[/C][C]0.120981[/C][/ROW]
[ROW][C]27[/C][C]0.063563[/C][C]0.4358[/C][C]0.332501[/C][/ROW]
[ROW][C]28[/C][C]0.111712[/C][C]0.7659[/C][C]0.223796[/C][/ROW]
[ROW][C]29[/C][C]-0.044926[/C][C]-0.308[/C][C]0.379722[/C][/ROW]
[ROW][C]30[/C][C]-0.115941[/C][C]-0.7949[/C][C]0.215347[/C][/ROW]
[ROW][C]31[/C][C]0.115037[/C][C]0.7887[/C][C]0.217137[/C][/ROW]
[ROW][C]32[/C][C]-0.124059[/C][C]-0.8505[/C][C]0.199677[/C][/ROW]
[ROW][C]33[/C][C]0.085162[/C][C]0.5838[/C][C]0.281058[/C][/ROW]
[ROW][C]34[/C][C]-0.021643[/C][C]-0.1484[/C][C]0.44134[/C][/ROW]
[ROW][C]35[/C][C]0.033585[/C][C]0.2302[/C][C]0.409449[/C][/ROW]
[ROW][C]36[/C][C]0.008792[/C][C]0.0603[/C][C]0.476097[/C][/ROW]
[ROW][C]37[/C][C]-0.106185[/C][C]-0.728[/C][C]0.235123[/C][/ROW]
[ROW][C]38[/C][C]0.131758[/C][C]0.9033[/C][C]0.185489[/C][/ROW]
[ROW][C]39[/C][C]-0.07064[/C][C]-0.4843[/C][C]0.315216[/C][/ROW]
[ROW][C]40[/C][C]0.028197[/C][C]0.1933[/C][C]0.423776[/C][/ROW]
[ROW][C]41[/C][C]0.021802[/C][C]0.1495[/C][C]0.440912[/C][/ROW]
[ROW][C]42[/C][C]-0.109167[/C][C]-0.7484[/C][C]0.228971[/C][/ROW]
[ROW][C]43[/C][C]0.072248[/C][C]0.4953[/C][C]0.311345[/C][/ROW]
[ROW][C]44[/C][C]-0.017191[/C][C]-0.1179[/C][C]0.453342[/C][/ROW]
[ROW][C]45[/C][C]0.02488[/C][C]0.1706[/C][C]0.432647[/C][/ROW]
[ROW][C]46[/C][C]-0.010725[/C][C]-0.0735[/C][C]0.47085[/C][/ROW]
[ROW][C]47[/C][C]NA[/C][C]NA[/C][C]NA[/C][/ROW]
[ROW][C]48[/C][C]NA[/C][C]NA[/C][C]NA[/C][/ROW]
[ROW][C]49[/C][C]NA[/C][C]NA[/C][C]NA[/C][/ROW]
[ROW][C]50[/C][C]NA[/C][C]NA[/C][C]NA[/C][/ROW]
[ROW][C]51[/C][C]NA[/C][C]NA[/C][C]NA[/C][/ROW]
[ROW][C]52[/C][C]NA[/C][C]NA[/C][C]NA[/C][/ROW]
[ROW][C]53[/C][C]NA[/C][C]NA[/C][C]NA[/C][/ROW]
[ROW][C]54[/C][C]NA[/C][C]NA[/C][C]NA[/C][/ROW]
[ROW][C]55[/C][C]NA[/C][C]NA[/C][C]NA[/C][/ROW]
[ROW][C]56[/C][C]NA[/C][C]NA[/C][C]NA[/C][/ROW]
[ROW][C]57[/C][C]NA[/C][C]NA[/C][C]NA[/C][/ROW]
[ROW][C]58[/C][C]NA[/C][C]NA[/C][C]NA[/C][/ROW]
[ROW][C]59[/C][C]NA[/C][C]NA[/C][C]NA[/C][/ROW]
[ROW][C]60[/C][C]NA[/C][C]NA[/C][C]NA[/C][/ROW]
[/TABLE]
Source: https://freestatistics.org/blog/index.php?pk=31407&T=1

Globally Unique Identifier (entire table): ba.freestatistics.org/blog/index.php?pk=31407&T=1

As an alternative you can also use a QR Code:  

The GUIDs for individual cells are displayed in the table below:

Autocorrelation Function
Time lag kACF(k)T-STATP-value
1-0.568941-3.90050.000152
20.0940410.64470.261124
30.0758020.51970.302865
4-0.167888-1.1510.127781
50.070030.48010.31669
6-0.056917-0.39020.349074
70.0948440.65020.259358
8-0.034718-0.2380.406452
9-0.012456-0.08540.466156
10-0.040731-0.27920.390645
110.206061.41270.082169
12-0.203116-1.39250.085163
130.0438890.30090.382414
140.0169890.11650.453889
15-0.060274-0.41320.340663
16-0.006257-0.04290.482984
170.0132790.0910.463926
180.1563981.07220.14455
19-0.227242-1.55790.062984
200.2255251.54610.064392
21-0.128178-0.87870.192006
220.0253620.17390.431357
23-0.000439-0.0030.498805
24-0.1201-0.82340.20723
250.2016331.38230.086703
26-0.172855-1.1850.120981
270.0635630.43580.332501
280.1117120.76590.223796
29-0.044926-0.3080.379722
30-0.115941-0.79490.215347
310.1150370.78870.217137
32-0.124059-0.85050.199677
330.0851620.58380.281058
34-0.021643-0.14840.44134
350.0335850.23020.409449
360.0087920.06030.476097
37-0.106185-0.7280.235123
380.1317580.90330.185489
39-0.07064-0.48430.315216
400.0281970.19330.423776
410.0218020.14950.440912
42-0.109167-0.74840.228971
430.0722480.49530.311345
44-0.017191-0.11790.453342
450.024880.17060.432647
46-0.010725-0.07350.47085
47NANANA
48NANANA
49NANANA
50NANANA
51NANANA
52NANANA
53NANANA
54NANANA
55NANANA
56NANANA
57NANANA
58NANANA
59NANANA
60NANANA


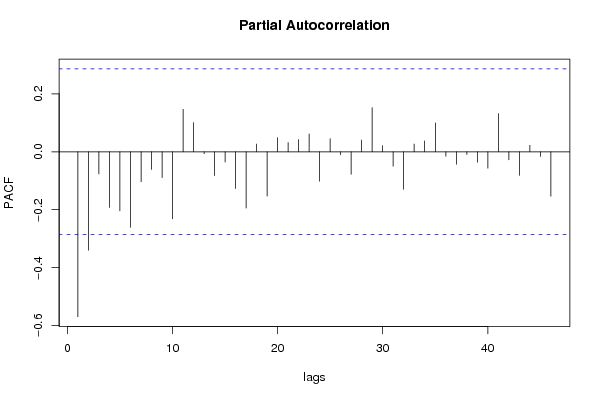
Partial Autocorrelation Function
Time lag kPACF(k)T-STATP-value
1-0.568941-3.90050.000152
2-0.339571-2.3280.012134
3-0.076416-0.52390.301411
4-0.192013-1.31640.097216
5-0.203571-1.39560.084695
6-0.260712-1.78740.040165
7-0.103743-0.71120.24023
8-0.061109-0.41890.338584
9-0.088846-0.60910.272696
10-0.231134-1.58460.059885
110.1467911.00640.1597
120.1010310.69260.245973
13-0.006578-0.04510.48211
14-0.082126-0.5630.288046
15-0.035473-0.24320.404458
16-0.126809-0.86940.194535
17-0.194139-1.33090.094814
180.0267310.18330.427692
19-0.152933-1.04850.149896
200.0484750.33230.370561
210.0320670.21980.413475
220.0421680.28910.386892
230.0615490.4220.33749
24-0.101532-0.69610.244908
250.0451230.30930.379212
26-0.009872-0.06770.473163
27-0.077756-0.53310.29825
280.0404970.27760.391256
290.1523081.04420.150873
300.0211130.14470.442766
31-0.049487-0.33930.36796
32-0.129324-0.88660.189905
330.0267920.18370.427529
340.037690.25840.398617
350.0995750.68270.249089
36-0.015225-0.10440.458656
37-0.042806-0.29350.385229
38-0.009242-0.06340.474874
39-0.035767-0.24520.403681
40-0.056609-0.38810.349849
410.1317440.90320.185515
42-0.027779-0.19040.424891
43-0.081208-0.55670.290174
440.0223540.15330.439428
45-0.016195-0.1110.456033
46-0.153026-1.04910.14975
47NANANA
48NANANA
49NANANA
50NANANA
51NANANA
52NANANA
53NANANA
54NANANA
55NANANA
56NANANA
57NANANA
58NANANA
59NANANA
60NANANA

\begin{tabular}{lllllllll}
\hline
Partial Autocorrelation Function \tabularnewline
Time lag k & PACF(k) & T-STAT & P-value \tabularnewline
1 & -0.568941 & -3.9005 & 0.000152 \tabularnewline
2 & -0.339571 & -2.328 & 0.012134 \tabularnewline
3 & -0.076416 & -0.5239 & 0.301411 \tabularnewline
4 & -0.192013 & -1.3164 & 0.097216 \tabularnewline
5 & -0.203571 & -1.3956 & 0.084695 \tabularnewline
6 & -0.260712 & -1.7874 & 0.040165 \tabularnewline
7 & -0.103743 & -0.7112 & 0.24023 \tabularnewline
8 & -0.061109 & -0.4189 & 0.338584 \tabularnewline
9 & -0.088846 & -0.6091 & 0.272696 \tabularnewline
10 & -0.231134 & -1.5846 & 0.059885 \tabularnewline
11 & 0.146791 & 1.0064 & 0.1597 \tabularnewline
12 & 0.101031 & 0.6926 & 0.245973 \tabularnewline
13 & -0.006578 & -0.0451 & 0.48211 \tabularnewline
14 & -0.082126 & -0.563 & 0.288046 \tabularnewline
15 & -0.035473 & -0.2432 & 0.404458 \tabularnewline
16 & -0.126809 & -0.8694 & 0.194535 \tabularnewline
17 & -0.194139 & -1.3309 & 0.094814 \tabularnewline
18 & 0.026731 & 0.1833 & 0.427692 \tabularnewline
19 & -0.152933 & -1.0485 & 0.149896 \tabularnewline
20 & 0.048475 & 0.3323 & 0.370561 \tabularnewline
21 & 0.032067 & 0.2198 & 0.413475 \tabularnewline
22 & 0.042168 & 0.2891 & 0.386892 \tabularnewline
23 & 0.061549 & 0.422 & 0.33749 \tabularnewline
24 & -0.101532 & -0.6961 & 0.244908 \tabularnewline
25 & 0.045123 & 0.3093 & 0.379212 \tabularnewline
26 & -0.009872 & -0.0677 & 0.473163 \tabularnewline
27 & -0.077756 & -0.5331 & 0.29825 \tabularnewline
28 & 0.040497 & 0.2776 & 0.391256 \tabularnewline
29 & 0.152308 & 1.0442 & 0.150873 \tabularnewline
30 & 0.021113 & 0.1447 & 0.442766 \tabularnewline
31 & -0.049487 & -0.3393 & 0.36796 \tabularnewline
32 & -0.129324 & -0.8866 & 0.189905 \tabularnewline
33 & 0.026792 & 0.1837 & 0.427529 \tabularnewline
34 & 0.03769 & 0.2584 & 0.398617 \tabularnewline
35 & 0.099575 & 0.6827 & 0.249089 \tabularnewline
36 & -0.015225 & -0.1044 & 0.458656 \tabularnewline
37 & -0.042806 & -0.2935 & 0.385229 \tabularnewline
38 & -0.009242 & -0.0634 & 0.474874 \tabularnewline
39 & -0.035767 & -0.2452 & 0.403681 \tabularnewline
40 & -0.056609 & -0.3881 & 0.349849 \tabularnewline
41 & 0.131744 & 0.9032 & 0.185515 \tabularnewline
42 & -0.027779 & -0.1904 & 0.424891 \tabularnewline
43 & -0.081208 & -0.5567 & 0.290174 \tabularnewline
44 & 0.022354 & 0.1533 & 0.439428 \tabularnewline
45 & -0.016195 & -0.111 & 0.456033 \tabularnewline
46 & -0.153026 & -1.0491 & 0.14975 \tabularnewline
47 & NA & NA & NA \tabularnewline
48 & NA & NA & NA \tabularnewline
49 & NA & NA & NA \tabularnewline
50 & NA & NA & NA \tabularnewline
51 & NA & NA & NA \tabularnewline
52 & NA & NA & NA \tabularnewline
53 & NA & NA & NA \tabularnewline
54 & NA & NA & NA \tabularnewline
55 & NA & NA & NA \tabularnewline
56 & NA & NA & NA \tabularnewline
57 & NA & NA & NA \tabularnewline
58 & NA & NA & NA \tabularnewline
59 & NA & NA & NA \tabularnewline
60 & NA & NA & NA \tabularnewline
\hline
\end{tabular}
%Source: https://freestatistics.org/blog/index.php?pk=31407&T=2

[TABLE]
[ROW][C]Partial Autocorrelation Function[/C][/ROW]
[ROW][C]Time lag k[/C][C]PACF(k)[/C][C]T-STAT[/C][C]P-value[/C][/ROW]
[ROW][C]1[/C][C]-0.568941[/C][C]-3.9005[/C][C]0.000152[/C][/ROW]
[ROW][C]2[/C][C]-0.339571[/C][C]-2.328[/C][C]0.012134[/C][/ROW]
[ROW][C]3[/C][C]-0.076416[/C][C]-0.5239[/C][C]0.301411[/C][/ROW]
[ROW][C]4[/C][C]-0.192013[/C][C]-1.3164[/C][C]0.097216[/C][/ROW]
[ROW][C]5[/C][C]-0.203571[/C][C]-1.3956[/C][C]0.084695[/C][/ROW]
[ROW][C]6[/C][C]-0.260712[/C][C]-1.7874[/C][C]0.040165[/C][/ROW]
[ROW][C]7[/C][C]-0.103743[/C][C]-0.7112[/C][C]0.24023[/C][/ROW]
[ROW][C]8[/C][C]-0.061109[/C][C]-0.4189[/C][C]0.338584[/C][/ROW]
[ROW][C]9[/C][C]-0.088846[/C][C]-0.6091[/C][C]0.272696[/C][/ROW]
[ROW][C]10[/C][C]-0.231134[/C][C]-1.5846[/C][C]0.059885[/C][/ROW]
[ROW][C]11[/C][C]0.146791[/C][C]1.0064[/C][C]0.1597[/C][/ROW]
[ROW][C]12[/C][C]0.101031[/C][C]0.6926[/C][C]0.245973[/C][/ROW]
[ROW][C]13[/C][C]-0.006578[/C][C]-0.0451[/C][C]0.48211[/C][/ROW]
[ROW][C]14[/C][C]-0.082126[/C][C]-0.563[/C][C]0.288046[/C][/ROW]
[ROW][C]15[/C][C]-0.035473[/C][C]-0.2432[/C][C]0.404458[/C][/ROW]
[ROW][C]16[/C][C]-0.126809[/C][C]-0.8694[/C][C]0.194535[/C][/ROW]
[ROW][C]17[/C][C]-0.194139[/C][C]-1.3309[/C][C]0.094814[/C][/ROW]
[ROW][C]18[/C][C]0.026731[/C][C]0.1833[/C][C]0.427692[/C][/ROW]
[ROW][C]19[/C][C]-0.152933[/C][C]-1.0485[/C][C]0.149896[/C][/ROW]
[ROW][C]20[/C][C]0.048475[/C][C]0.3323[/C][C]0.370561[/C][/ROW]
[ROW][C]21[/C][C]0.032067[/C][C]0.2198[/C][C]0.413475[/C][/ROW]
[ROW][C]22[/C][C]0.042168[/C][C]0.2891[/C][C]0.386892[/C][/ROW]
[ROW][C]23[/C][C]0.061549[/C][C]0.422[/C][C]0.33749[/C][/ROW]
[ROW][C]24[/C][C]-0.101532[/C][C]-0.6961[/C][C]0.244908[/C][/ROW]
[ROW][C]25[/C][C]0.045123[/C][C]0.3093[/C][C]0.379212[/C][/ROW]
[ROW][C]26[/C][C]-0.009872[/C][C]-0.0677[/C][C]0.473163[/C][/ROW]
[ROW][C]27[/C][C]-0.077756[/C][C]-0.5331[/C][C]0.29825[/C][/ROW]
[ROW][C]28[/C][C]0.040497[/C][C]0.2776[/C][C]0.391256[/C][/ROW]
[ROW][C]29[/C][C]0.152308[/C][C]1.0442[/C][C]0.150873[/C][/ROW]
[ROW][C]30[/C][C]0.021113[/C][C]0.1447[/C][C]0.442766[/C][/ROW]
[ROW][C]31[/C][C]-0.049487[/C][C]-0.3393[/C][C]0.36796[/C][/ROW]
[ROW][C]32[/C][C]-0.129324[/C][C]-0.8866[/C][C]0.189905[/C][/ROW]
[ROW][C]33[/C][C]0.026792[/C][C]0.1837[/C][C]0.427529[/C][/ROW]
[ROW][C]34[/C][C]0.03769[/C][C]0.2584[/C][C]0.398617[/C][/ROW]
[ROW][C]35[/C][C]0.099575[/C][C]0.6827[/C][C]0.249089[/C][/ROW]
[ROW][C]36[/C][C]-0.015225[/C][C]-0.1044[/C][C]0.458656[/C][/ROW]
[ROW][C]37[/C][C]-0.042806[/C][C]-0.2935[/C][C]0.385229[/C][/ROW]
[ROW][C]38[/C][C]-0.009242[/C][C]-0.0634[/C][C]0.474874[/C][/ROW]
[ROW][C]39[/C][C]-0.035767[/C][C]-0.2452[/C][C]0.403681[/C][/ROW]
[ROW][C]40[/C][C]-0.056609[/C][C]-0.3881[/C][C]0.349849[/C][/ROW]
[ROW][C]41[/C][C]0.131744[/C][C]0.9032[/C][C]0.185515[/C][/ROW]
[ROW][C]42[/C][C]-0.027779[/C][C]-0.1904[/C][C]0.424891[/C][/ROW]
[ROW][C]43[/C][C]-0.081208[/C][C]-0.5567[/C][C]0.290174[/C][/ROW]
[ROW][C]44[/C][C]0.022354[/C][C]0.1533[/C][C]0.439428[/C][/ROW]
[ROW][C]45[/C][C]-0.016195[/C][C]-0.111[/C][C]0.456033[/C][/ROW]
[ROW][C]46[/C][C]-0.153026[/C][C]-1.0491[/C][C]0.14975[/C][/ROW]
[ROW][C]47[/C][C]NA[/C][C]NA[/C][C]NA[/C][/ROW]
[ROW][C]48[/C][C]NA[/C][C]NA[/C][C]NA[/C][/ROW]
[ROW][C]49[/C][C]NA[/C][C]NA[/C][C]NA[/C][/ROW]
[ROW][C]50[/C][C]NA[/C][C]NA[/C][C]NA[/C][/ROW]
[ROW][C]51[/C][C]NA[/C][C]NA[/C][C]NA[/C][/ROW]
[ROW][C]52[/C][C]NA[/C][C]NA[/C][C]NA[/C][/ROW]
[ROW][C]53[/C][C]NA[/C][C]NA[/C][C]NA[/C][/ROW]
[ROW][C]54[/C][C]NA[/C][C]NA[/C][C]NA[/C][/ROW]
[ROW][C]55[/C][C]NA[/C][C]NA[/C][C]NA[/C][/ROW]
[ROW][C]56[/C][C]NA[/C][C]NA[/C][C]NA[/C][/ROW]
[ROW][C]57[/C][C]NA[/C][C]NA[/C][C]NA[/C][/ROW]
[ROW][C]58[/C][C]NA[/C][C]NA[/C][C]NA[/C][/ROW]
[ROW][C]59[/C][C]NA[/C][C]NA[/C][C]NA[/C][/ROW]
[ROW][C]60[/C][C]NA[/C][C]NA[/C][C]NA[/C][/ROW]
[/TABLE]
Source: https://freestatistics.org/blog/index.php?pk=31407&T=2

Globally Unique Identifier (entire table): ba.freestatistics.org/blog/index.php?pk=31407&T=2

As an alternative you can also use a QR Code:  

The GUIDs for individual cells are displayed in the table below:

Partial Autocorrelation Function
Time lag kPACF(k)T-STATP-value
1-0.568941-3.90050.000152
2-0.339571-2.3280.012134
3-0.076416-0.52390.301411
4-0.192013-1.31640.097216
5-0.203571-1.39560.084695
6-0.260712-1.78740.040165
7-0.103743-0.71120.24023
8-0.061109-0.41890.338584
9-0.088846-0.60910.272696
10-0.231134-1.58460.059885
110.1467911.00640.1597
120.1010310.69260.245973
13-0.006578-0.04510.48211
14-0.082126-0.5630.288046
15-0.035473-0.24320.404458
16-0.126809-0.86940.194535
17-0.194139-1.33090.094814
180.0267310.18330.427692
19-0.152933-1.04850.149896
200.0484750.33230.370561
210.0320670.21980.413475
220.0421680.28910.386892
230.0615490.4220.33749
24-0.101532-0.69610.244908
250.0451230.30930.379212
26-0.009872-0.06770.473163
27-0.077756-0.53310.29825
280.0404970.27760.391256
290.1523081.04420.150873
300.0211130.14470.442766
31-0.049487-0.33930.36796
32-0.129324-0.88660.189905
330.0267920.18370.427529
340.037690.25840.398617
350.0995750.68270.249089
36-0.015225-0.10440.458656
37-0.042806-0.29350.385229
38-0.009242-0.06340.474874
39-0.035767-0.24520.403681
40-0.056609-0.38810.349849
410.1317440.90320.185515
42-0.027779-0.19040.424891
43-0.081208-0.55670.290174
440.0223540.15330.439428
45-0.016195-0.1110.456033
46-0.153026-1.04910.14975
47NANANA
48NANANA
49NANANA
50NANANA
51NANANA
52NANANA
53NANANA
54NANANA
55NANANA
56NANANA
57NANANA
58NANANA
59NANANA
60NANANA


Parameters (Session):
par1 = 12 ;
Parameters (R input):
par1 = 60 ; par2 = 1 ; par3 = 1 ; par4 = 1 ; par5 = 12 ;
R code (references can be found in the software module):
if (par1 == 'Default') {
par1 = 10*log10(length(x))
} else {
par1 <- as.numeric(par1)
}
par2 <- as.numeric(par2)
par3 <- as.numeric(par3)
par4 <- as.numeric(par4)
par5 <- as.numeric(par5)
if (par2 == 0) {
x <- log(x)
} else {
x <- (x ^ par2 - 1) / par2
}
if (par3 > 0) x <- diff(x,lag=1,difference=par3)
if (par4 > 0) x <- diff(x,lag=par5,difference=par4)
bitmap(file='pic1.png')
racf <- acf(x,par1,main='Autocorrelation',xlab='lags',ylab='ACF')
dev.off()
bitmap(file='pic2.png')
rpacf <- pacf(x,par1,main='Partial Autocorrelation',xlab='lags',ylab='PACF')
dev.off()
(myacf <- c(racf$acf))
(mypacf <- c(rpacf$acf))
lengthx <- length(x)
sqrtn <- sqrt(lengthx)
load(file='createtable')
a<-table.start()
a<-table.row.start(a)
a<-table.element(a,'Autocorrelation Function',4,TRUE)
a<-table.row.end(a)
a<-table.row.start(a)
a<-table.element(a,'Time lag k',header=TRUE)
a<-table.element(a,hyperlink('basics.htm','ACF(k)','click here for more information about the Autocorrelation Function'),header=TRUE)
a<-table.element(a,'T-STAT',header=TRUE)
a<-table.element(a,'P-value',header=TRUE)
a<-table.row.end(a)
for (i in 2:(par1+1)) {
a<-table.row.start(a)
a<-table.element(a,i-1,header=TRUE)
a<-table.element(a,round(myacf[i],6))
mytstat <- myacf[i]*sqrtn
a<-table.element(a,round(mytstat,4))
a<-table.element(a,round(1-pt(abs(mytstat),lengthx),6))
a<-table.row.end(a)
}
a<-table.end(a)
table.save(a,file='mytable.tab')
a<-table.start()
a<-table.row.start(a)
a<-table.element(a,'Partial Autocorrelation Function',4,TRUE)
a<-table.row.end(a)
a<-table.row.start(a)
a<-table.element(a,'Time lag k',header=TRUE)
a<-table.element(a,hyperlink('basics.htm','PACF(k)','click here for more information about the Partial Autocorrelation Function'),header=TRUE)
a<-table.element(a,'T-STAT',header=TRUE)
a<-table.element(a,'P-value',header=TRUE)
a<-table.row.end(a)
for (i in 1:par1) {
a<-table.row.start(a)
a<-table.element(a,i,header=TRUE)
a<-table.element(a,round(mypacf[i],6))
mytstat <- mypacf[i]*sqrtn
a<-table.element(a,round(mytstat,4))
a<-table.element(a,round(1-pt(abs(mytstat),lengthx),6))
a<-table.row.end(a)
}
a<-table.end(a)
table.save(a,file='mytable1.tab')