Free Statistics

of Irreproducible Research!

Author's title

Author*The author of this computation has been verified*
R Software Modulerwasp_multipleregression.wasp
Title produced by softwareMultiple Regression
Date of computationSun, 07 Dec 2008 06:11:11 -0700
Cite this page as followsStatistical Computations at FreeStatistics.org, Office for Research Development and Education, URL https://freestatistics.org/blog/index.php?v=date/2008/Dec/07/t1228655533aecae6v6esrl4tm.htm/, Retrieved Fri, 17 May 2024 03:42:21 +0000
Statistical Computations at FreeStatistics.org, Office for Research Development and Education, URL https://freestatistics.org/blog/index.php?pk=29927, Retrieved Fri, 17 May 2024 03:42:21 +0000
QR Codes:

Original text written by user:
IsPrivate?No (this computation is public)
User-defined keywords
Estimated Impact227
Family? (F = Feedback message, R = changed R code, M = changed R Module, P = changed Parameters, D = changed Data)
F     [Multiple Regression] [] [2007-11-19 20:22:41] [3a1956effdcb54c39e5044435310d6c8]
-    D  [Multiple Regression] [seatbelt_3.2.] [2008-11-23 14:44:53] [922d8ae7bd2fd460a62d9020ccd4931a]
F   PD    [Multiple Regression] [seatbelt3CG2] [2008-11-23 15:00:12] [922d8ae7bd2fd460a62d9020ccd4931a]
-   PD        [Multiple Regression] [dummy4] [2008-12-07 13:11:11] [89a49ebb3ece8e9a225c7f9f53a14c57] [Current]
Feedback Forum

Post a new message
Dataseries X:
3030,29	0
2803,47	0
2767,63	0
2882,6	0
2863,36	0
2897,06	0
3012,61	0
3142,95	0
3032,93	0
3045,78	0
3110,52	0
3013,24	0
2987,1	0
2995,55	0
2833,18	0
2848,96	0
2794,83	0
2845,26	0
2915,02	0
2892,63	0
2604,42	0
2641,65	0
2659,81	0
2638,53	0
2720,25	0
2745,88	0
2735,7	0
2811,7	0
2799,43	0
2555,28	0
2304,98	0
2214,95	0
2065,81	0
1940,49	0
2042	0
1995,37	0
1946,81	0
1765,9	0
1635,25	0
1833,42	0
1910,43	0
1959,67	0
1969,6	0
2061,41	0
2093,48	0
2120,88	0
2174,56	0
2196,72	0
2350,44	0
2440,25	0
2408,64	0
2472,81	0
2407,6	0
2454,62	0
2448,05	0
2497,84	0
2645,64	0
2756,76	0
2849,27	0
2921,44	0
2981,85	0
3080,58	0
3106,22	0
3119,31	0
3061,26	0
3097,31	0
3161,69	0
3257,16	0
3277,01	0
3295,32	0
3363,99	0
3494,17	0
3667,03	0
3813,06	0
3917,96	0
3895,51	0
3801,06	0
3570,12	0
3701,61	0
3862,27	0
3970,1	0
4138,52	0
4199,75	0
4290,89	0
4443,91	0
4502,64	0
4356,98	0
4591,27	0
4696,96	0
4621,4	0
4562,84	1
4202,52	1
4296,49	1
4435,23	1
4105,18	1
4116,68	1
3844,49	1
3720,98	1
3674,4	1
3857,62	1
3801,06	1
3504,37	1
3032,6	1
3047,03	1
2962,34	1
2197,82	1
2014,45	1


Summary of computational transaction
Raw Inputview raw input (R code)
Raw Outputview raw output of R engine
Computing time3 seconds
R Server'Gwilym Jenkins' @ 72.249.127.135

\begin{tabular}{lllllllll}
\hline
Summary of computational transaction \tabularnewline
Raw Input & view raw input (R code)  \tabularnewline
Raw Output & view raw output of R engine  \tabularnewline
Computing time & 3 seconds \tabularnewline
R Server & 'Gwilym Jenkins' @ 72.249.127.135 \tabularnewline
\hline
\end{tabular}
%Source: https://freestatistics.org/blog/index.php?pk=29927&T=0

[TABLE]
[ROW][C]Summary of computational transaction[/C][/ROW]
[ROW][C]Raw Input[/C][C]view raw input (R code) [/C][/ROW]
[ROW][C]Raw Output[/C][C]view raw output of R engine [/C][/ROW]
[ROW][C]Computing time[/C][C]3 seconds[/C][/ROW]
[ROW][C]R Server[/C][C]'Gwilym Jenkins' @ 72.249.127.135[/C][/ROW]
[/TABLE]
Source: https://freestatistics.org/blog/index.php?pk=29927&T=0

Globally Unique Identifier (entire table): ba.freestatistics.org/blog/index.php?pk=29927&T=0

As an alternative you can also use a QR Code:  

The GUIDs for individual cells are displayed in the table below:

Summary of computational transaction
Raw Inputview raw input (R code)
Raw Outputview raw output of R engine
Computing time3 seconds
R Server'Gwilym Jenkins' @ 72.249.127.135


Multiple Linear Regression - Estimated Regression Equation
BEL20[t] = + 2279.77806283829 -106.14423714479`Wel(1)_geen(0)_financiële_crisis`[t] + 98.8007714104707M1[t] + 72.1335498029745M2[t] + 8.96743930658927M3[t] + 91.3113288102044M4[t] + 56.4941072027082M5[t] -28.7331144047884M6[t] -76.076531885086M7[t] -83.4526423814712M8[t] -124.195419544523M9[t] -181.074863374241M10[t] -202.082084981738M11[t] + 15.1272216074964t + e[t]

\begin{tabular}{lllllllll}
\hline
Multiple Linear Regression - Estimated Regression Equation \tabularnewline
BEL20[t] =  +  2279.77806283829 -106.14423714479`Wel(1)_geen(0)_financiële_crisis`[t] +  98.8007714104707M1[t] +  72.1335498029745M2[t] +  8.96743930658927M3[t] +  91.3113288102044M4[t] +  56.4941072027082M5[t] -28.7331144047884M6[t] -76.076531885086M7[t] -83.4526423814712M8[t] -124.195419544523M9[t] -181.074863374241M10[t] -202.082084981738M11[t] +  15.1272216074964t  + e[t] \tabularnewline
\hline
\end{tabular}
%Source: https://freestatistics.org/blog/index.php?pk=29927&T=1

[TABLE]
[ROW][C]Multiple Linear Regression - Estimated Regression Equation[/C][/ROW]
[ROW][C]BEL20[t] =  +  2279.77806283829 -106.14423714479`Wel(1)_geen(0)_financiële_crisis`[t] +  98.8007714104707M1[t] +  72.1335498029745M2[t] +  8.96743930658927M3[t] +  91.3113288102044M4[t] +  56.4941072027082M5[t] -28.7331144047884M6[t] -76.076531885086M7[t] -83.4526423814712M8[t] -124.195419544523M9[t] -181.074863374241M10[t] -202.082084981738M11[t] +  15.1272216074964t  + e[t][/C][/ROW]
[/TABLE]
Source: https://freestatistics.org/blog/index.php?pk=29927&T=1

Globally Unique Identifier (entire table): ba.freestatistics.org/blog/index.php?pk=29927&T=1

As an alternative you can also use a QR Code:  

The GUIDs for individual cells are displayed in the table below:

Multiple Linear Regression - Estimated Regression Equation
BEL20[t] = + 2279.77806283829 -106.14423714479`Wel(1)_geen(0)_financiële_crisis`[t] + 98.8007714104707M1[t] + 72.1335498029745M2[t] + 8.96743930658927M3[t] + 91.3113288102044M4[t] + 56.4941072027082M5[t] -28.7331144047884M6[t] -76.076531885086M7[t] -83.4526423814712M8[t] -124.195419544523M9[t] -181.074863374241M10[t] -202.082084981738M11[t] + 15.1272216074964t + e[t]


Multiple Linear Regression - Ordinary Least Squares
VariableParameterS.D.T-STATH0: parameter = 02-tail p-value1-tail p-value
(Intercept)2279.77806283829267.2819388.529500
`Wel(1)_geen(0)_financiële_crisis`-106.14423714479228.219743-0.46510.6429490.321475
M198.8007714104707322.0298690.30680.7596770.379838
M272.1335498029745321.9458260.22410.8232060.411603
M38.96743930658927321.884150.02790.9778340.488917
M491.3113288102044321.8448530.28370.7772620.388631
M556.4941072027082321.8279430.17550.8610360.430518
M6-28.7331144047884321.833424-0.08930.9290520.464526
M7-76.076531885086322.476483-0.23590.8140190.407009
M8-83.4526423814712322.393489-0.25890.796320.39816
M9-124.195419544523322.332831-0.38530.7008940.350447
M10-181.074863374241322.294521-0.56180.5755830.287792
M11-202.082084981738322.278567-0.6270.5321680.266084
t15.12722160749642.6844295.635200

\begin{tabular}{lllllllll}
\hline
Multiple Linear Regression - Ordinary Least Squares \tabularnewline
Variable & Parameter & S.D. & T-STATH0: parameter = 0 & 2-tail p-value & 1-tail p-value \tabularnewline
(Intercept) & 2279.77806283829 & 267.281938 & 8.5295 & 0 & 0 \tabularnewline
`Wel(1)_geen(0)_financiële_crisis` & -106.14423714479 & 228.219743 & -0.4651 & 0.642949 & 0.321475 \tabularnewline
M1 & 98.8007714104707 & 322.029869 & 0.3068 & 0.759677 & 0.379838 \tabularnewline
M2 & 72.1335498029745 & 321.945826 & 0.2241 & 0.823206 & 0.411603 \tabularnewline
M3 & 8.96743930658927 & 321.88415 & 0.0279 & 0.977834 & 0.488917 \tabularnewline
M4 & 91.3113288102044 & 321.844853 & 0.2837 & 0.777262 & 0.388631 \tabularnewline
M5 & 56.4941072027082 & 321.827943 & 0.1755 & 0.861036 & 0.430518 \tabularnewline
M6 & -28.7331144047884 & 321.833424 & -0.0893 & 0.929052 & 0.464526 \tabularnewline
M7 & -76.076531885086 & 322.476483 & -0.2359 & 0.814019 & 0.407009 \tabularnewline
M8 & -83.4526423814712 & 322.393489 & -0.2589 & 0.79632 & 0.39816 \tabularnewline
M9 & -124.195419544523 & 322.332831 & -0.3853 & 0.700894 & 0.350447 \tabularnewline
M10 & -181.074863374241 & 322.294521 & -0.5618 & 0.575583 & 0.287792 \tabularnewline
M11 & -202.082084981738 & 322.278567 & -0.627 & 0.532168 & 0.266084 \tabularnewline
t & 15.1272216074964 & 2.684429 & 5.6352 & 0 & 0 \tabularnewline
\hline
\end{tabular}
%Source: https://freestatistics.org/blog/index.php?pk=29927&T=2

[TABLE]
[ROW][C]Multiple Linear Regression - Ordinary Least Squares[/C][/ROW]
[ROW][C]Variable[/C][C]Parameter[/C][C]S.D.[/C][C]T-STATH0: parameter = 0[/C][C]2-tail p-value[/C][C]1-tail p-value[/C][/ROW]
[ROW][C](Intercept)[/C][C]2279.77806283829[/C][C]267.281938[/C][C]8.5295[/C][C]0[/C][C]0[/C][/ROW]
[ROW][C]`Wel(1)_geen(0)_financiële_crisis`[/C][C]-106.14423714479[/C][C]228.219743[/C][C]-0.4651[/C][C]0.642949[/C][C]0.321475[/C][/ROW]
[ROW][C]M1[/C][C]98.8007714104707[/C][C]322.029869[/C][C]0.3068[/C][C]0.759677[/C][C]0.379838[/C][/ROW]
[ROW][C]M2[/C][C]72.1335498029745[/C][C]321.945826[/C][C]0.2241[/C][C]0.823206[/C][C]0.411603[/C][/ROW]
[ROW][C]M3[/C][C]8.96743930658927[/C][C]321.88415[/C][C]0.0279[/C][C]0.977834[/C][C]0.488917[/C][/ROW]
[ROW][C]M4[/C][C]91.3113288102044[/C][C]321.844853[/C][C]0.2837[/C][C]0.777262[/C][C]0.388631[/C][/ROW]
[ROW][C]M5[/C][C]56.4941072027082[/C][C]321.827943[/C][C]0.1755[/C][C]0.861036[/C][C]0.430518[/C][/ROW]
[ROW][C]M6[/C][C]-28.7331144047884[/C][C]321.833424[/C][C]-0.0893[/C][C]0.929052[/C][C]0.464526[/C][/ROW]
[ROW][C]M7[/C][C]-76.076531885086[/C][C]322.476483[/C][C]-0.2359[/C][C]0.814019[/C][C]0.407009[/C][/ROW]
[ROW][C]M8[/C][C]-83.4526423814712[/C][C]322.393489[/C][C]-0.2589[/C][C]0.79632[/C][C]0.39816[/C][/ROW]
[ROW][C]M9[/C][C]-124.195419544523[/C][C]322.332831[/C][C]-0.3853[/C][C]0.700894[/C][C]0.350447[/C][/ROW]
[ROW][C]M10[/C][C]-181.074863374241[/C][C]322.294521[/C][C]-0.5618[/C][C]0.575583[/C][C]0.287792[/C][/ROW]
[ROW][C]M11[/C][C]-202.082084981738[/C][C]322.278567[/C][C]-0.627[/C][C]0.532168[/C][C]0.266084[/C][/ROW]
[ROW][C]t[/C][C]15.1272216074964[/C][C]2.684429[/C][C]5.6352[/C][C]0[/C][C]0[/C][/ROW]
[/TABLE]
Source: https://freestatistics.org/blog/index.php?pk=29927&T=2

Globally Unique Identifier (entire table): ba.freestatistics.org/blog/index.php?pk=29927&T=2

As an alternative you can also use a QR Code:  

The GUIDs for individual cells are displayed in the table below:

Multiple Linear Regression - Ordinary Least Squares
VariableParameterS.D.T-STATH0: parameter = 02-tail p-value1-tail p-value
(Intercept)2279.77806283829267.2819388.529500
`Wel(1)_geen(0)_financiële_crisis`-106.14423714479228.219743-0.46510.6429490.321475
M198.8007714104707322.0298690.30680.7596770.379838
M272.1335498029745321.9458260.22410.8232060.411603
M38.96743930658927321.884150.02790.9778340.488917
M491.3113288102044321.8448530.28370.7772620.388631
M556.4941072027082321.8279430.17550.8610360.430518
M6-28.7331144047884321.833424-0.08930.9290520.464526
M7-76.076531885086322.476483-0.23590.8140190.407009
M8-83.4526423814712322.393489-0.25890.796320.39816
M9-124.195419544523322.332831-0.38530.7008940.350447
M10-181.074863374241322.294521-0.56180.5755830.287792
M11-202.082084981738322.278567-0.6270.5321680.266084
t15.12722160749642.6844295.635200


Multiple Linear Regression - Regression Statistics
Multiple R0.585745590243383
R-squared0.343097896489569
Adjusted R-squared0.251272871267680
F-TEST (value)3.73643127960486
F-TEST (DF numerator)13
F-TEST (DF denominator)93
p-value8.57632805393305e-05
Multiple Linear Regression - Residual Statistics
Residual Standard Deviation662.295598720762
Sum Squared Residuals40793097.7878949

\begin{tabular}{lllllllll}
\hline
Multiple Linear Regression - Regression Statistics \tabularnewline
Multiple R & 0.585745590243383 \tabularnewline
R-squared & 0.343097896489569 \tabularnewline
Adjusted R-squared & 0.251272871267680 \tabularnewline
F-TEST (value) & 3.73643127960486 \tabularnewline
F-TEST (DF numerator) & 13 \tabularnewline
F-TEST (DF denominator) & 93 \tabularnewline
p-value & 8.57632805393305e-05 \tabularnewline
Multiple Linear Regression - Residual Statistics \tabularnewline
Residual Standard Deviation & 662.295598720762 \tabularnewline
Sum Squared Residuals & 40793097.7878949 \tabularnewline
\hline
\end{tabular}
%Source: https://freestatistics.org/blog/index.php?pk=29927&T=3

[TABLE]
[ROW][C]Multiple Linear Regression - Regression Statistics[/C][/ROW]
[ROW][C]Multiple R[/C][C]0.585745590243383[/C][/ROW]
[ROW][C]R-squared[/C][C]0.343097896489569[/C][/ROW]
[ROW][C]Adjusted R-squared[/C][C]0.251272871267680[/C][/ROW]
[ROW][C]F-TEST (value)[/C][C]3.73643127960486[/C][/ROW]
[ROW][C]F-TEST (DF numerator)[/C][C]13[/C][/ROW]
[ROW][C]F-TEST (DF denominator)[/C][C]93[/C][/ROW]
[ROW][C]p-value[/C][C]8.57632805393305e-05[/C][/ROW]
[ROW][C]Multiple Linear Regression - Residual Statistics[/C][/ROW]
[ROW][C]Residual Standard Deviation[/C][C]662.295598720762[/C][/ROW]
[ROW][C]Sum Squared Residuals[/C][C]40793097.7878949[/C][/ROW]
[/TABLE]
Source: https://freestatistics.org/blog/index.php?pk=29927&T=3

Globally Unique Identifier (entire table): ba.freestatistics.org/blog/index.php?pk=29927&T=3

As an alternative you can also use a QR Code:  

The GUIDs for individual cells are displayed in the table below:

Multiple Linear Regression - Regression Statistics
Multiple R0.585745590243383
R-squared0.343097896489569
Adjusted R-squared0.251272871267680
F-TEST (value)3.73643127960486
F-TEST (DF numerator)13
F-TEST (DF denominator)93
p-value8.57632805393305e-05
Multiple Linear Regression - Residual Statistics
Residual Standard Deviation662.295598720762
Sum Squared Residuals40793097.7878949


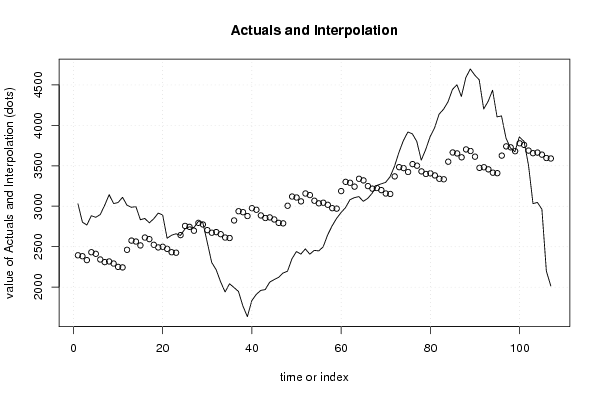
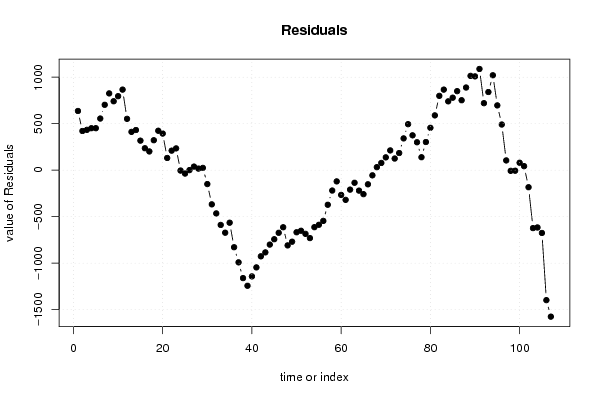
Multiple Linear Regression - Actuals, Interpolation, and Residuals
Time or IndexActualsInterpolationForecastResidualsPrediction Error
13030.292393.70605585627636.583944143732
22803.472382.16605585626421.303944143737
32767.632334.12716696737433.502833032627
42882.62431.59827807848451.001721921516
52863.362411.90827807848451.451721921516
62897.062341.80827807848555.251721921515
73012.612309.59208220568703.017917794317
83142.952317.34319331679825.606806683206
93032.932291.72763776124741.202362238762
103045.782249.97541553902795.804584460984
113110.522244.09541553902866.424584460984
123013.242461.30472212825551.935277871749
132987.12575.23271514622411.867284853782
142995.552563.69271514622431.857284853782
152833.182515.65382625733317.52617374267
162848.962613.12493736844235.835062631559
172794.832593.43493736844201.395062631559
182845.262523.33493736844321.925062631559
192915.022491.11874149564423.90125850436
202892.632498.86985260675393.760147393249
212604.422473.25429705120131.165702948805
222641.652431.50207482897210.147925171027
232659.812425.62207482897234.187925171027
242638.532642.83138141821-4.30138141820711
252720.252756.75937443617-36.5093744361744
262745.882745.219374436170.660625563825185
272735.72697.1804855472938.5195144527138
282811.72794.651596658417.0484033416026
292799.432774.961596658424.4684033416025
302555.282704.8615966584-149.581596658397
312304.982672.64540078560-367.665400785596
322214.952680.39651189671-465.446511896707
332065.812654.78095634115-588.970956341152
341940.492613.02873411893-672.53873411893
3520422607.14873411893-565.148734118929
361995.372824.35804070816-828.988040708164
371946.812938.28603372613-991.476033726131
381765.92926.74603372613-1160.84603372613
391635.252878.70714483724-1243.45714483724
401833.422976.17825594835-1142.75825594835
411910.432956.48825594835-1046.05825594835
421959.672886.38825594835-926.718255948354
431969.62854.17206007555-884.572060075553
442061.412861.92317118666-800.513171186664
452093.482836.30761563111-742.827615631108
462120.882794.55539340889-673.675393408886
472174.562788.67539340889-614.115393408886
482196.723005.88469999812-809.16469999812
492350.443119.81269301609-769.372693016087
502440.253108.27269301609-668.022693016088
512408.643060.2338041272-651.593804127199
522472.813157.70491523831-684.89491523831
532407.63138.01491523831-730.41491523831
542454.623067.91491523831-613.29491523831
552448.053035.69871936551-587.648719365509
562497.843043.44983047662-545.60983047662
572645.643017.83427492106-372.194274921065
582756.762976.08205269884-219.322052698842
592849.272970.20205269884-120.932052698842
602921.443187.41135928808-265.971359288077
612981.853301.33935230604-319.489352306044
623080.583289.79935230604-209.219352306044
633106.223241.76046341716-135.540463417155
643119.313339.23157452827-219.921574528267
653061.263319.54157452827-258.281574528266
663097.313249.44157452827-152.131574528266
673161.693217.22537865547-55.5353786554654
683257.163224.9764897665832.1835102334236
693277.013199.3609342110277.6490657889794
703295.323157.6087119888137.711288011201
713363.993151.7287119888212.261288011201
723494.173368.93801857803125.231981421967
733667.033482.866011596184.163988404
743813.063471.326011596341.733988403999
753917.963423.28712270711494.672877292888
763895.513520.75823381822374.751766181777
773801.063501.06823381822299.991766181777
783570.123430.96823381822139.151766181777
793701.613398.75203794542302.857962054578
803862.273406.50314905653455.766850943467
813970.13380.88759350098589.212406499022
824138.523339.13537127876799.384628721245
834199.753333.25537127876866.494628721245
844290.893550.46467786799740.42532213201
854443.913664.39267088596779.517329114043
864502.643652.85267088596849.787329114044
874356.983604.81378199707752.166218002932
884591.273702.28489310818888.985106891821
894696.963682.594893108181014.36510689182
904621.43612.494893108181008.90510689182
914562.843474.134460090591088.70553990941
924202.523481.8855712017720.634428798302
934296.493456.27001564614840.219984353856
944435.233414.517793423921020.71220657608
954105.183408.63779342392696.542206576079
964116.683625.84710001316490.832899986845
973844.493739.77509303112104.714906968877
983720.983728.23509303112-7.25509303112316
993674.43680.19620414223-5.79620414223422
1003857.623777.6673152533579.9526847466544
1013801.063757.9773152533543.0826847466542
1023504.373687.87731525335-183.507315253346
1033032.63655.66111938054-623.061119380545
1043047.033663.41223049166-616.382230491655
1052962.343637.7966749361-675.4566749361
1062197.823596.04445271388-1398.22445271388
1072014.453590.16445271388-1575.71445271388

\begin{tabular}{lllllllll}
\hline
Multiple Linear Regression - Actuals, Interpolation, and Residuals \tabularnewline
Time or Index & Actuals & InterpolationForecast & ResidualsPrediction Error \tabularnewline
1 & 3030.29 & 2393.70605585627 & 636.583944143732 \tabularnewline
2 & 2803.47 & 2382.16605585626 & 421.303944143737 \tabularnewline
3 & 2767.63 & 2334.12716696737 & 433.502833032627 \tabularnewline
4 & 2882.6 & 2431.59827807848 & 451.001721921516 \tabularnewline
5 & 2863.36 & 2411.90827807848 & 451.451721921516 \tabularnewline
6 & 2897.06 & 2341.80827807848 & 555.251721921515 \tabularnewline
7 & 3012.61 & 2309.59208220568 & 703.017917794317 \tabularnewline
8 & 3142.95 & 2317.34319331679 & 825.606806683206 \tabularnewline
9 & 3032.93 & 2291.72763776124 & 741.202362238762 \tabularnewline
10 & 3045.78 & 2249.97541553902 & 795.804584460984 \tabularnewline
11 & 3110.52 & 2244.09541553902 & 866.424584460984 \tabularnewline
12 & 3013.24 & 2461.30472212825 & 551.935277871749 \tabularnewline
13 & 2987.1 & 2575.23271514622 & 411.867284853782 \tabularnewline
14 & 2995.55 & 2563.69271514622 & 431.857284853782 \tabularnewline
15 & 2833.18 & 2515.65382625733 & 317.52617374267 \tabularnewline
16 & 2848.96 & 2613.12493736844 & 235.835062631559 \tabularnewline
17 & 2794.83 & 2593.43493736844 & 201.395062631559 \tabularnewline
18 & 2845.26 & 2523.33493736844 & 321.925062631559 \tabularnewline
19 & 2915.02 & 2491.11874149564 & 423.90125850436 \tabularnewline
20 & 2892.63 & 2498.86985260675 & 393.760147393249 \tabularnewline
21 & 2604.42 & 2473.25429705120 & 131.165702948805 \tabularnewline
22 & 2641.65 & 2431.50207482897 & 210.147925171027 \tabularnewline
23 & 2659.81 & 2425.62207482897 & 234.187925171027 \tabularnewline
24 & 2638.53 & 2642.83138141821 & -4.30138141820711 \tabularnewline
25 & 2720.25 & 2756.75937443617 & -36.5093744361744 \tabularnewline
26 & 2745.88 & 2745.21937443617 & 0.660625563825185 \tabularnewline
27 & 2735.7 & 2697.18048554729 & 38.5195144527138 \tabularnewline
28 & 2811.7 & 2794.6515966584 & 17.0484033416026 \tabularnewline
29 & 2799.43 & 2774.9615966584 & 24.4684033416025 \tabularnewline
30 & 2555.28 & 2704.8615966584 & -149.581596658397 \tabularnewline
31 & 2304.98 & 2672.64540078560 & -367.665400785596 \tabularnewline
32 & 2214.95 & 2680.39651189671 & -465.446511896707 \tabularnewline
33 & 2065.81 & 2654.78095634115 & -588.970956341152 \tabularnewline
34 & 1940.49 & 2613.02873411893 & -672.53873411893 \tabularnewline
35 & 2042 & 2607.14873411893 & -565.148734118929 \tabularnewline
36 & 1995.37 & 2824.35804070816 & -828.988040708164 \tabularnewline
37 & 1946.81 & 2938.28603372613 & -991.476033726131 \tabularnewline
38 & 1765.9 & 2926.74603372613 & -1160.84603372613 \tabularnewline
39 & 1635.25 & 2878.70714483724 & -1243.45714483724 \tabularnewline
40 & 1833.42 & 2976.17825594835 & -1142.75825594835 \tabularnewline
41 & 1910.43 & 2956.48825594835 & -1046.05825594835 \tabularnewline
42 & 1959.67 & 2886.38825594835 & -926.718255948354 \tabularnewline
43 & 1969.6 & 2854.17206007555 & -884.572060075553 \tabularnewline
44 & 2061.41 & 2861.92317118666 & -800.513171186664 \tabularnewline
45 & 2093.48 & 2836.30761563111 & -742.827615631108 \tabularnewline
46 & 2120.88 & 2794.55539340889 & -673.675393408886 \tabularnewline
47 & 2174.56 & 2788.67539340889 & -614.115393408886 \tabularnewline
48 & 2196.72 & 3005.88469999812 & -809.16469999812 \tabularnewline
49 & 2350.44 & 3119.81269301609 & -769.372693016087 \tabularnewline
50 & 2440.25 & 3108.27269301609 & -668.022693016088 \tabularnewline
51 & 2408.64 & 3060.2338041272 & -651.593804127199 \tabularnewline
52 & 2472.81 & 3157.70491523831 & -684.89491523831 \tabularnewline
53 & 2407.6 & 3138.01491523831 & -730.41491523831 \tabularnewline
54 & 2454.62 & 3067.91491523831 & -613.29491523831 \tabularnewline
55 & 2448.05 & 3035.69871936551 & -587.648719365509 \tabularnewline
56 & 2497.84 & 3043.44983047662 & -545.60983047662 \tabularnewline
57 & 2645.64 & 3017.83427492106 & -372.194274921065 \tabularnewline
58 & 2756.76 & 2976.08205269884 & -219.322052698842 \tabularnewline
59 & 2849.27 & 2970.20205269884 & -120.932052698842 \tabularnewline
60 & 2921.44 & 3187.41135928808 & -265.971359288077 \tabularnewline
61 & 2981.85 & 3301.33935230604 & -319.489352306044 \tabularnewline
62 & 3080.58 & 3289.79935230604 & -209.219352306044 \tabularnewline
63 & 3106.22 & 3241.76046341716 & -135.540463417155 \tabularnewline
64 & 3119.31 & 3339.23157452827 & -219.921574528267 \tabularnewline
65 & 3061.26 & 3319.54157452827 & -258.281574528266 \tabularnewline
66 & 3097.31 & 3249.44157452827 & -152.131574528266 \tabularnewline
67 & 3161.69 & 3217.22537865547 & -55.5353786554654 \tabularnewline
68 & 3257.16 & 3224.97648976658 & 32.1835102334236 \tabularnewline
69 & 3277.01 & 3199.36093421102 & 77.6490657889794 \tabularnewline
70 & 3295.32 & 3157.6087119888 & 137.711288011201 \tabularnewline
71 & 3363.99 & 3151.7287119888 & 212.261288011201 \tabularnewline
72 & 3494.17 & 3368.93801857803 & 125.231981421967 \tabularnewline
73 & 3667.03 & 3482.866011596 & 184.163988404 \tabularnewline
74 & 3813.06 & 3471.326011596 & 341.733988403999 \tabularnewline
75 & 3917.96 & 3423.28712270711 & 494.672877292888 \tabularnewline
76 & 3895.51 & 3520.75823381822 & 374.751766181777 \tabularnewline
77 & 3801.06 & 3501.06823381822 & 299.991766181777 \tabularnewline
78 & 3570.12 & 3430.96823381822 & 139.151766181777 \tabularnewline
79 & 3701.61 & 3398.75203794542 & 302.857962054578 \tabularnewline
80 & 3862.27 & 3406.50314905653 & 455.766850943467 \tabularnewline
81 & 3970.1 & 3380.88759350098 & 589.212406499022 \tabularnewline
82 & 4138.52 & 3339.13537127876 & 799.384628721245 \tabularnewline
83 & 4199.75 & 3333.25537127876 & 866.494628721245 \tabularnewline
84 & 4290.89 & 3550.46467786799 & 740.42532213201 \tabularnewline
85 & 4443.91 & 3664.39267088596 & 779.517329114043 \tabularnewline
86 & 4502.64 & 3652.85267088596 & 849.787329114044 \tabularnewline
87 & 4356.98 & 3604.81378199707 & 752.166218002932 \tabularnewline
88 & 4591.27 & 3702.28489310818 & 888.985106891821 \tabularnewline
89 & 4696.96 & 3682.59489310818 & 1014.36510689182 \tabularnewline
90 & 4621.4 & 3612.49489310818 & 1008.90510689182 \tabularnewline
91 & 4562.84 & 3474.13446009059 & 1088.70553990941 \tabularnewline
92 & 4202.52 & 3481.8855712017 & 720.634428798302 \tabularnewline
93 & 4296.49 & 3456.27001564614 & 840.219984353856 \tabularnewline
94 & 4435.23 & 3414.51779342392 & 1020.71220657608 \tabularnewline
95 & 4105.18 & 3408.63779342392 & 696.542206576079 \tabularnewline
96 & 4116.68 & 3625.84710001316 & 490.832899986845 \tabularnewline
97 & 3844.49 & 3739.77509303112 & 104.714906968877 \tabularnewline
98 & 3720.98 & 3728.23509303112 & -7.25509303112316 \tabularnewline
99 & 3674.4 & 3680.19620414223 & -5.79620414223422 \tabularnewline
100 & 3857.62 & 3777.66731525335 & 79.9526847466544 \tabularnewline
101 & 3801.06 & 3757.97731525335 & 43.0826847466542 \tabularnewline
102 & 3504.37 & 3687.87731525335 & -183.507315253346 \tabularnewline
103 & 3032.6 & 3655.66111938054 & -623.061119380545 \tabularnewline
104 & 3047.03 & 3663.41223049166 & -616.382230491655 \tabularnewline
105 & 2962.34 & 3637.7966749361 & -675.4566749361 \tabularnewline
106 & 2197.82 & 3596.04445271388 & -1398.22445271388 \tabularnewline
107 & 2014.45 & 3590.16445271388 & -1575.71445271388 \tabularnewline
\hline
\end{tabular}
%Source: https://freestatistics.org/blog/index.php?pk=29927&T=4

[TABLE]
[ROW][C]Multiple Linear Regression - Actuals, Interpolation, and Residuals[/C][/ROW]
[ROW][C]Time or Index[/C][C]Actuals[/C][C]InterpolationForecast[/C][C]ResidualsPrediction Error[/C][/ROW]
[ROW][C]1[/C][C]3030.29[/C][C]2393.70605585627[/C][C]636.583944143732[/C][/ROW]
[ROW][C]2[/C][C]2803.47[/C][C]2382.16605585626[/C][C]421.303944143737[/C][/ROW]
[ROW][C]3[/C][C]2767.63[/C][C]2334.12716696737[/C][C]433.502833032627[/C][/ROW]
[ROW][C]4[/C][C]2882.6[/C][C]2431.59827807848[/C][C]451.001721921516[/C][/ROW]
[ROW][C]5[/C][C]2863.36[/C][C]2411.90827807848[/C][C]451.451721921516[/C][/ROW]
[ROW][C]6[/C][C]2897.06[/C][C]2341.80827807848[/C][C]555.251721921515[/C][/ROW]
[ROW][C]7[/C][C]3012.61[/C][C]2309.59208220568[/C][C]703.017917794317[/C][/ROW]
[ROW][C]8[/C][C]3142.95[/C][C]2317.34319331679[/C][C]825.606806683206[/C][/ROW]
[ROW][C]9[/C][C]3032.93[/C][C]2291.72763776124[/C][C]741.202362238762[/C][/ROW]
[ROW][C]10[/C][C]3045.78[/C][C]2249.97541553902[/C][C]795.804584460984[/C][/ROW]
[ROW][C]11[/C][C]3110.52[/C][C]2244.09541553902[/C][C]866.424584460984[/C][/ROW]
[ROW][C]12[/C][C]3013.24[/C][C]2461.30472212825[/C][C]551.935277871749[/C][/ROW]
[ROW][C]13[/C][C]2987.1[/C][C]2575.23271514622[/C][C]411.867284853782[/C][/ROW]
[ROW][C]14[/C][C]2995.55[/C][C]2563.69271514622[/C][C]431.857284853782[/C][/ROW]
[ROW][C]15[/C][C]2833.18[/C][C]2515.65382625733[/C][C]317.52617374267[/C][/ROW]
[ROW][C]16[/C][C]2848.96[/C][C]2613.12493736844[/C][C]235.835062631559[/C][/ROW]
[ROW][C]17[/C][C]2794.83[/C][C]2593.43493736844[/C][C]201.395062631559[/C][/ROW]
[ROW][C]18[/C][C]2845.26[/C][C]2523.33493736844[/C][C]321.925062631559[/C][/ROW]
[ROW][C]19[/C][C]2915.02[/C][C]2491.11874149564[/C][C]423.90125850436[/C][/ROW]
[ROW][C]20[/C][C]2892.63[/C][C]2498.86985260675[/C][C]393.760147393249[/C][/ROW]
[ROW][C]21[/C][C]2604.42[/C][C]2473.25429705120[/C][C]131.165702948805[/C][/ROW]
[ROW][C]22[/C][C]2641.65[/C][C]2431.50207482897[/C][C]210.147925171027[/C][/ROW]
[ROW][C]23[/C][C]2659.81[/C][C]2425.62207482897[/C][C]234.187925171027[/C][/ROW]
[ROW][C]24[/C][C]2638.53[/C][C]2642.83138141821[/C][C]-4.30138141820711[/C][/ROW]
[ROW][C]25[/C][C]2720.25[/C][C]2756.75937443617[/C][C]-36.5093744361744[/C][/ROW]
[ROW][C]26[/C][C]2745.88[/C][C]2745.21937443617[/C][C]0.660625563825185[/C][/ROW]
[ROW][C]27[/C][C]2735.7[/C][C]2697.18048554729[/C][C]38.5195144527138[/C][/ROW]
[ROW][C]28[/C][C]2811.7[/C][C]2794.6515966584[/C][C]17.0484033416026[/C][/ROW]
[ROW][C]29[/C][C]2799.43[/C][C]2774.9615966584[/C][C]24.4684033416025[/C][/ROW]
[ROW][C]30[/C][C]2555.28[/C][C]2704.8615966584[/C][C]-149.581596658397[/C][/ROW]
[ROW][C]31[/C][C]2304.98[/C][C]2672.64540078560[/C][C]-367.665400785596[/C][/ROW]
[ROW][C]32[/C][C]2214.95[/C][C]2680.39651189671[/C][C]-465.446511896707[/C][/ROW]
[ROW][C]33[/C][C]2065.81[/C][C]2654.78095634115[/C][C]-588.970956341152[/C][/ROW]
[ROW][C]34[/C][C]1940.49[/C][C]2613.02873411893[/C][C]-672.53873411893[/C][/ROW]
[ROW][C]35[/C][C]2042[/C][C]2607.14873411893[/C][C]-565.148734118929[/C][/ROW]
[ROW][C]36[/C][C]1995.37[/C][C]2824.35804070816[/C][C]-828.988040708164[/C][/ROW]
[ROW][C]37[/C][C]1946.81[/C][C]2938.28603372613[/C][C]-991.476033726131[/C][/ROW]
[ROW][C]38[/C][C]1765.9[/C][C]2926.74603372613[/C][C]-1160.84603372613[/C][/ROW]
[ROW][C]39[/C][C]1635.25[/C][C]2878.70714483724[/C][C]-1243.45714483724[/C][/ROW]
[ROW][C]40[/C][C]1833.42[/C][C]2976.17825594835[/C][C]-1142.75825594835[/C][/ROW]
[ROW][C]41[/C][C]1910.43[/C][C]2956.48825594835[/C][C]-1046.05825594835[/C][/ROW]
[ROW][C]42[/C][C]1959.67[/C][C]2886.38825594835[/C][C]-926.718255948354[/C][/ROW]
[ROW][C]43[/C][C]1969.6[/C][C]2854.17206007555[/C][C]-884.572060075553[/C][/ROW]
[ROW][C]44[/C][C]2061.41[/C][C]2861.92317118666[/C][C]-800.513171186664[/C][/ROW]
[ROW][C]45[/C][C]2093.48[/C][C]2836.30761563111[/C][C]-742.827615631108[/C][/ROW]
[ROW][C]46[/C][C]2120.88[/C][C]2794.55539340889[/C][C]-673.675393408886[/C][/ROW]
[ROW][C]47[/C][C]2174.56[/C][C]2788.67539340889[/C][C]-614.115393408886[/C][/ROW]
[ROW][C]48[/C][C]2196.72[/C][C]3005.88469999812[/C][C]-809.16469999812[/C][/ROW]
[ROW][C]49[/C][C]2350.44[/C][C]3119.81269301609[/C][C]-769.372693016087[/C][/ROW]
[ROW][C]50[/C][C]2440.25[/C][C]3108.27269301609[/C][C]-668.022693016088[/C][/ROW]
[ROW][C]51[/C][C]2408.64[/C][C]3060.2338041272[/C][C]-651.593804127199[/C][/ROW]
[ROW][C]52[/C][C]2472.81[/C][C]3157.70491523831[/C][C]-684.89491523831[/C][/ROW]
[ROW][C]53[/C][C]2407.6[/C][C]3138.01491523831[/C][C]-730.41491523831[/C][/ROW]
[ROW][C]54[/C][C]2454.62[/C][C]3067.91491523831[/C][C]-613.29491523831[/C][/ROW]
[ROW][C]55[/C][C]2448.05[/C][C]3035.69871936551[/C][C]-587.648719365509[/C][/ROW]
[ROW][C]56[/C][C]2497.84[/C][C]3043.44983047662[/C][C]-545.60983047662[/C][/ROW]
[ROW][C]57[/C][C]2645.64[/C][C]3017.83427492106[/C][C]-372.194274921065[/C][/ROW]
[ROW][C]58[/C][C]2756.76[/C][C]2976.08205269884[/C][C]-219.322052698842[/C][/ROW]
[ROW][C]59[/C][C]2849.27[/C][C]2970.20205269884[/C][C]-120.932052698842[/C][/ROW]
[ROW][C]60[/C][C]2921.44[/C][C]3187.41135928808[/C][C]-265.971359288077[/C][/ROW]
[ROW][C]61[/C][C]2981.85[/C][C]3301.33935230604[/C][C]-319.489352306044[/C][/ROW]
[ROW][C]62[/C][C]3080.58[/C][C]3289.79935230604[/C][C]-209.219352306044[/C][/ROW]
[ROW][C]63[/C][C]3106.22[/C][C]3241.76046341716[/C][C]-135.540463417155[/C][/ROW]
[ROW][C]64[/C][C]3119.31[/C][C]3339.23157452827[/C][C]-219.921574528267[/C][/ROW]
[ROW][C]65[/C][C]3061.26[/C][C]3319.54157452827[/C][C]-258.281574528266[/C][/ROW]
[ROW][C]66[/C][C]3097.31[/C][C]3249.44157452827[/C][C]-152.131574528266[/C][/ROW]
[ROW][C]67[/C][C]3161.69[/C][C]3217.22537865547[/C][C]-55.5353786554654[/C][/ROW]
[ROW][C]68[/C][C]3257.16[/C][C]3224.97648976658[/C][C]32.1835102334236[/C][/ROW]
[ROW][C]69[/C][C]3277.01[/C][C]3199.36093421102[/C][C]77.6490657889794[/C][/ROW]
[ROW][C]70[/C][C]3295.32[/C][C]3157.6087119888[/C][C]137.711288011201[/C][/ROW]
[ROW][C]71[/C][C]3363.99[/C][C]3151.7287119888[/C][C]212.261288011201[/C][/ROW]
[ROW][C]72[/C][C]3494.17[/C][C]3368.93801857803[/C][C]125.231981421967[/C][/ROW]
[ROW][C]73[/C][C]3667.03[/C][C]3482.866011596[/C][C]184.163988404[/C][/ROW]
[ROW][C]74[/C][C]3813.06[/C][C]3471.326011596[/C][C]341.733988403999[/C][/ROW]
[ROW][C]75[/C][C]3917.96[/C][C]3423.28712270711[/C][C]494.672877292888[/C][/ROW]
[ROW][C]76[/C][C]3895.51[/C][C]3520.75823381822[/C][C]374.751766181777[/C][/ROW]
[ROW][C]77[/C][C]3801.06[/C][C]3501.06823381822[/C][C]299.991766181777[/C][/ROW]
[ROW][C]78[/C][C]3570.12[/C][C]3430.96823381822[/C][C]139.151766181777[/C][/ROW]
[ROW][C]79[/C][C]3701.61[/C][C]3398.75203794542[/C][C]302.857962054578[/C][/ROW]
[ROW][C]80[/C][C]3862.27[/C][C]3406.50314905653[/C][C]455.766850943467[/C][/ROW]
[ROW][C]81[/C][C]3970.1[/C][C]3380.88759350098[/C][C]589.212406499022[/C][/ROW]
[ROW][C]82[/C][C]4138.52[/C][C]3339.13537127876[/C][C]799.384628721245[/C][/ROW]
[ROW][C]83[/C][C]4199.75[/C][C]3333.25537127876[/C][C]866.494628721245[/C][/ROW]
[ROW][C]84[/C][C]4290.89[/C][C]3550.46467786799[/C][C]740.42532213201[/C][/ROW]
[ROW][C]85[/C][C]4443.91[/C][C]3664.39267088596[/C][C]779.517329114043[/C][/ROW]
[ROW][C]86[/C][C]4502.64[/C][C]3652.85267088596[/C][C]849.787329114044[/C][/ROW]
[ROW][C]87[/C][C]4356.98[/C][C]3604.81378199707[/C][C]752.166218002932[/C][/ROW]
[ROW][C]88[/C][C]4591.27[/C][C]3702.28489310818[/C][C]888.985106891821[/C][/ROW]
[ROW][C]89[/C][C]4696.96[/C][C]3682.59489310818[/C][C]1014.36510689182[/C][/ROW]
[ROW][C]90[/C][C]4621.4[/C][C]3612.49489310818[/C][C]1008.90510689182[/C][/ROW]
[ROW][C]91[/C][C]4562.84[/C][C]3474.13446009059[/C][C]1088.70553990941[/C][/ROW]
[ROW][C]92[/C][C]4202.52[/C][C]3481.8855712017[/C][C]720.634428798302[/C][/ROW]
[ROW][C]93[/C][C]4296.49[/C][C]3456.27001564614[/C][C]840.219984353856[/C][/ROW]
[ROW][C]94[/C][C]4435.23[/C][C]3414.51779342392[/C][C]1020.71220657608[/C][/ROW]
[ROW][C]95[/C][C]4105.18[/C][C]3408.63779342392[/C][C]696.542206576079[/C][/ROW]
[ROW][C]96[/C][C]4116.68[/C][C]3625.84710001316[/C][C]490.832899986845[/C][/ROW]
[ROW][C]97[/C][C]3844.49[/C][C]3739.77509303112[/C][C]104.714906968877[/C][/ROW]
[ROW][C]98[/C][C]3720.98[/C][C]3728.23509303112[/C][C]-7.25509303112316[/C][/ROW]
[ROW][C]99[/C][C]3674.4[/C][C]3680.19620414223[/C][C]-5.79620414223422[/C][/ROW]
[ROW][C]100[/C][C]3857.62[/C][C]3777.66731525335[/C][C]79.9526847466544[/C][/ROW]
[ROW][C]101[/C][C]3801.06[/C][C]3757.97731525335[/C][C]43.0826847466542[/C][/ROW]
[ROW][C]102[/C][C]3504.37[/C][C]3687.87731525335[/C][C]-183.507315253346[/C][/ROW]
[ROW][C]103[/C][C]3032.6[/C][C]3655.66111938054[/C][C]-623.061119380545[/C][/ROW]
[ROW][C]104[/C][C]3047.03[/C][C]3663.41223049166[/C][C]-616.382230491655[/C][/ROW]
[ROW][C]105[/C][C]2962.34[/C][C]3637.7966749361[/C][C]-675.4566749361[/C][/ROW]
[ROW][C]106[/C][C]2197.82[/C][C]3596.04445271388[/C][C]-1398.22445271388[/C][/ROW]
[ROW][C]107[/C][C]2014.45[/C][C]3590.16445271388[/C][C]-1575.71445271388[/C][/ROW]
[/TABLE]
Source: https://freestatistics.org/blog/index.php?pk=29927&T=4

Globally Unique Identifier (entire table): ba.freestatistics.org/blog/index.php?pk=29927&T=4

As an alternative you can also use a QR Code:  

The GUIDs for individual cells are displayed in the table below:

Multiple Linear Regression - Actuals, Interpolation, and Residuals
Time or IndexActualsInterpolationForecastResidualsPrediction Error
13030.292393.70605585627636.583944143732
22803.472382.16605585626421.303944143737
32767.632334.12716696737433.502833032627
42882.62431.59827807848451.001721921516
52863.362411.90827807848451.451721921516
62897.062341.80827807848555.251721921515
73012.612309.59208220568703.017917794317
83142.952317.34319331679825.606806683206
93032.932291.72763776124741.202362238762
103045.782249.97541553902795.804584460984
113110.522244.09541553902866.424584460984
123013.242461.30472212825551.935277871749
132987.12575.23271514622411.867284853782
142995.552563.69271514622431.857284853782
152833.182515.65382625733317.52617374267
162848.962613.12493736844235.835062631559
172794.832593.43493736844201.395062631559
182845.262523.33493736844321.925062631559
192915.022491.11874149564423.90125850436
202892.632498.86985260675393.760147393249
212604.422473.25429705120131.165702948805
222641.652431.50207482897210.147925171027
232659.812425.62207482897234.187925171027
242638.532642.83138141821-4.30138141820711
252720.252756.75937443617-36.5093744361744
262745.882745.219374436170.660625563825185
272735.72697.1804855472938.5195144527138
282811.72794.651596658417.0484033416026
292799.432774.961596658424.4684033416025
302555.282704.8615966584-149.581596658397
312304.982672.64540078560-367.665400785596
322214.952680.39651189671-465.446511896707
332065.812654.78095634115-588.970956341152
341940.492613.02873411893-672.53873411893
3520422607.14873411893-565.148734118929
361995.372824.35804070816-828.988040708164
371946.812938.28603372613-991.476033726131
381765.92926.74603372613-1160.84603372613
391635.252878.70714483724-1243.45714483724
401833.422976.17825594835-1142.75825594835
411910.432956.48825594835-1046.05825594835
421959.672886.38825594835-926.718255948354
431969.62854.17206007555-884.572060075553
442061.412861.92317118666-800.513171186664
452093.482836.30761563111-742.827615631108
462120.882794.55539340889-673.675393408886
472174.562788.67539340889-614.115393408886
482196.723005.88469999812-809.16469999812
492350.443119.81269301609-769.372693016087
502440.253108.27269301609-668.022693016088
512408.643060.2338041272-651.593804127199
522472.813157.70491523831-684.89491523831
532407.63138.01491523831-730.41491523831
542454.623067.91491523831-613.29491523831
552448.053035.69871936551-587.648719365509
562497.843043.44983047662-545.60983047662
572645.643017.83427492106-372.194274921065
582756.762976.08205269884-219.322052698842
592849.272970.20205269884-120.932052698842
602921.443187.41135928808-265.971359288077
612981.853301.33935230604-319.489352306044
623080.583289.79935230604-209.219352306044
633106.223241.76046341716-135.540463417155
643119.313339.23157452827-219.921574528267
653061.263319.54157452827-258.281574528266
663097.313249.44157452827-152.131574528266
673161.693217.22537865547-55.5353786554654
683257.163224.9764897665832.1835102334236
693277.013199.3609342110277.6490657889794
703295.323157.6087119888137.711288011201
713363.993151.7287119888212.261288011201
723494.173368.93801857803125.231981421967
733667.033482.866011596184.163988404
743813.063471.326011596341.733988403999
753917.963423.28712270711494.672877292888
763895.513520.75823381822374.751766181777
773801.063501.06823381822299.991766181777
783570.123430.96823381822139.151766181777
793701.613398.75203794542302.857962054578
803862.273406.50314905653455.766850943467
813970.13380.88759350098589.212406499022
824138.523339.13537127876799.384628721245
834199.753333.25537127876866.494628721245
844290.893550.46467786799740.42532213201
854443.913664.39267088596779.517329114043
864502.643652.85267088596849.787329114044
874356.983604.81378199707752.166218002932
884591.273702.28489310818888.985106891821
894696.963682.594893108181014.36510689182
904621.43612.494893108181008.90510689182
914562.843474.134460090591088.70553990941
924202.523481.8855712017720.634428798302
934296.493456.27001564614840.219984353856
944435.233414.517793423921020.71220657608
954105.183408.63779342392696.542206576079
964116.683625.84710001316490.832899986845
973844.493739.77509303112104.714906968877
983720.983728.23509303112-7.25509303112316
993674.43680.19620414223-5.79620414223422
1003857.623777.6673152533579.9526847466544
1013801.063757.9773152533543.0826847466542
1023504.373687.87731525335-183.507315253346
1033032.63655.66111938054-623.061119380545
1043047.033663.41223049166-616.382230491655
1052962.343637.7966749361-675.4566749361
1062197.823596.04445271388-1398.22445271388
1072014.453590.16445271388-1575.71445271388


Parameters (Session):
par1 = 1 ; par2 = Include Monthly Dummies ; par3 = Linear Trend ;
Parameters (R input):
par1 = 1 ; par2 = Include Monthly Dummies ; par3 = Linear Trend ;
R code (references can be found in the software module):
library(lattice)
par1 <- as.numeric(par1)
x <- t(y)
k <- length(x[1,])
n <- length(x[,1])
x1 <- cbind(x[,par1], x[,1:k!=par1])
mycolnames <- c(colnames(x)[par1], colnames(x)[1:k!=par1])
colnames(x1) <- mycolnames #colnames(x)[par1]
x <- x1
if (par3 == 'First Differences'){
x2 <- array(0, dim=c(n-1,k), dimnames=list(1:(n-1), paste('(1-B)',colnames(x),sep='')))
for (i in 1:n-1) {
for (j in 1:k) {
x2[i,j] <- x[i+1,j] - x[i,j]
}
}
x <- x2
}
if (par2 == 'Include Monthly Dummies'){
x2 <- array(0, dim=c(n,11), dimnames=list(1:n, paste('M', seq(1:11), sep ='')))
for (i in 1:11){
x2[seq(i,n,12),i] <- 1
}
x <- cbind(x, x2)
}
if (par2 == 'Include Quarterly Dummies'){
x2 <- array(0, dim=c(n,3), dimnames=list(1:n, paste('Q', seq(1:3), sep ='')))
for (i in 1:3){
x2[seq(i,n,4),i] <- 1
}
x <- cbind(x, x2)
}
k <- length(x[1,])
if (par3 == 'Linear Trend'){
x <- cbind(x, c(1:n))
colnames(x)[k+1] <- 't'
}
x
k <- length(x[1,])
df <- as.data.frame(x)
(mylm <- lm(df))
(mysum <- summary(mylm))
bitmap(file='test0.png')
plot(x[,1], type='l', main='Actuals and Interpolation', ylab='value of Actuals and Interpolation (dots)', xlab='time or index')
points(x[,1]-mysum$resid)
grid()
dev.off()
bitmap(file='test1.png')
plot(mysum$resid, type='b', pch=19, main='Residuals', ylab='value of Residuals', xlab='time or index')
grid()
dev.off()
bitmap(file='test2.png')
hist(mysum$resid, main='Residual Histogram', xlab='values of Residuals')
grid()
dev.off()
bitmap(file='test3.png')
densityplot(~mysum$resid,col='black',main='Residual Density Plot', xlab='values of Residuals')
dev.off()
bitmap(file='test4.png')
qqnorm(mysum$resid, main='Residual Normal Q-Q Plot')
grid()
dev.off()
(myerror <- as.ts(mysum$resid))
bitmap(file='test5.png')
dum <- cbind(lag(myerror,k=1),myerror)
dum
dum1 <- dum[2:length(myerror),]
dum1
z <- as.data.frame(dum1)
z
plot(z,main=paste('Residual Lag plot, lowess, and regression line'), ylab='values of Residuals', xlab='lagged values of Residuals')
lines(lowess(z))
abline(lm(z))
grid()
dev.off()
bitmap(file='test6.png')
acf(mysum$resid, lag.max=length(mysum$resid)/2, main='Residual Autocorrelation Function')
grid()
dev.off()
bitmap(file='test7.png')
pacf(mysum$resid, lag.max=length(mysum$resid)/2, main='Residual Partial Autocorrelation Function')
grid()
dev.off()
bitmap(file='test8.png')
opar <- par(mfrow = c(2,2), oma = c(0, 0, 1.1, 0))
plot(mylm, las = 1, sub='Residual Diagnostics')
par(opar)
dev.off()
load(file='createtable')
a<-table.start()
a<-table.row.start(a)
a<-table.element(a, 'Multiple Linear Regression - Estimated Regression Equation', 1, TRUE)
a<-table.row.end(a)
myeq <- colnames(x)[1]
myeq <- paste(myeq, '[t] = ', sep='')
for (i in 1:k){
if (mysum$coefficients[i,1] > 0) myeq <- paste(myeq, '+', '')
myeq <- paste(myeq, mysum$coefficients[i,1], sep=' ')
if (rownames(mysum$coefficients)[i] != '(Intercept)') {
myeq <- paste(myeq, rownames(mysum$coefficients)[i], sep='')
if (rownames(mysum$coefficients)[i] != 't') myeq <- paste(myeq, '[t]', sep='')
}
}
myeq <- paste(myeq, ' + e[t]')
a<-table.row.start(a)
a<-table.element(a, myeq)
a<-table.row.end(a)
a<-table.end(a)
table.save(a,file='mytable1.tab')
a<-table.start()
a<-table.row.start(a)
a<-table.element(a,hyperlink('ols1.htm','Multiple Linear Regression - Ordinary Least Squares',''), 6, TRUE)
a<-table.row.end(a)
a<-table.row.start(a)
a<-table.element(a,'Variable',header=TRUE)
a<-table.element(a,'Parameter',header=TRUE)
a<-table.element(a,'S.D.',header=TRUE)
a<-table.element(a,'T-STAT
H0: parameter = 0',header=TRUE)
a<-table.element(a,'2-tail p-value',header=TRUE)
a<-table.element(a,'1-tail p-value',header=TRUE)
a<-table.row.end(a)
for (i in 1:k){
a<-table.row.start(a)
a<-table.element(a,rownames(mysum$coefficients)[i],header=TRUE)
a<-table.element(a,mysum$coefficients[i,1])
a<-table.element(a, round(mysum$coefficients[i,2],6))
a<-table.element(a, round(mysum$coefficients[i,3],4))
a<-table.element(a, round(mysum$coefficients[i,4],6))
a<-table.element(a, round(mysum$coefficients[i,4]/2,6))
a<-table.row.end(a)
}
a<-table.end(a)
table.save(a,file='mytable2.tab')
a<-table.start()
a<-table.row.start(a)
a<-table.element(a, 'Multiple Linear Regression - Regression Statistics', 2, TRUE)
a<-table.row.end(a)
a<-table.row.start(a)
a<-table.element(a, 'Multiple R',1,TRUE)
a<-table.element(a, sqrt(mysum$r.squared))
a<-table.row.end(a)
a<-table.row.start(a)
a<-table.element(a, 'R-squared',1,TRUE)
a<-table.element(a, mysum$r.squared)
a<-table.row.end(a)
a<-table.row.start(a)
a<-table.element(a, 'Adjusted R-squared',1,TRUE)
a<-table.element(a, mysum$adj.r.squared)
a<-table.row.end(a)
a<-table.row.start(a)
a<-table.element(a, 'F-TEST (value)',1,TRUE)
a<-table.element(a, mysum$fstatistic[1])
a<-table.row.end(a)
a<-table.row.start(a)
a<-table.element(a, 'F-TEST (DF numerator)',1,TRUE)
a<-table.element(a, mysum$fstatistic[2])
a<-table.row.end(a)
a<-table.row.start(a)
a<-table.element(a, 'F-TEST (DF denominator)',1,TRUE)
a<-table.element(a, mysum$fstatistic[3])
a<-table.row.end(a)
a<-table.row.start(a)
a<-table.element(a, 'p-value',1,TRUE)
a<-table.element(a, 1-pf(mysum$fstatistic[1],mysum$fstatistic[2],mysum$fstatistic[3]))
a<-table.row.end(a)
a<-table.row.start(a)
a<-table.element(a, 'Multiple Linear Regression - Residual Statistics', 2, TRUE)
a<-table.row.end(a)
a<-table.row.start(a)
a<-table.element(a, 'Residual Standard Deviation',1,TRUE)
a<-table.element(a, mysum$sigma)
a<-table.row.end(a)
a<-table.row.start(a)
a<-table.element(a, 'Sum Squared Residuals',1,TRUE)
a<-table.element(a, sum(myerror*myerror))
a<-table.row.end(a)
a<-table.end(a)
table.save(a,file='mytable3.tab')
a<-table.start()
a<-table.row.start(a)
a<-table.element(a, 'Multiple Linear Regression - Actuals, Interpolation, and Residuals', 4, TRUE)
a<-table.row.end(a)
a<-table.row.start(a)
a<-table.element(a, 'Time or Index', 1, TRUE)
a<-table.element(a, 'Actuals', 1, TRUE)
a<-table.element(a, 'Interpolation
Forecast', 1, TRUE)
a<-table.element(a, 'Residuals
Prediction Error', 1, TRUE)
a<-table.row.end(a)
for (i in 1:n) {
a<-table.row.start(a)
a<-table.element(a,i, 1, TRUE)
a<-table.element(a,x[i])
a<-table.element(a,x[i]-mysum$resid[i])
a<-table.element(a,mysum$resid[i])
a<-table.row.end(a)
}
a<-table.end(a)
table.save(a,file='mytable4.tab')