Free Statistics
of Irreproducible Research!
Description of Statistical Computation | |||||||||||||||||||||||||||||||||||||||||||||||||||
|---|---|---|---|---|---|---|---|---|---|---|---|---|---|---|---|---|---|---|---|---|---|---|---|---|---|---|---|---|---|---|---|---|---|---|---|---|---|---|---|---|---|---|---|---|---|---|---|---|---|---|---|
| Author's title | |||||||||||||||||||||||||||||||||||||||||||||||||||
| Author | *The author of this computation has been verified* | ||||||||||||||||||||||||||||||||||||||||||||||||||
| R Software Module | rwasp_pairs.wasp | ||||||||||||||||||||||||||||||||||||||||||||||||||
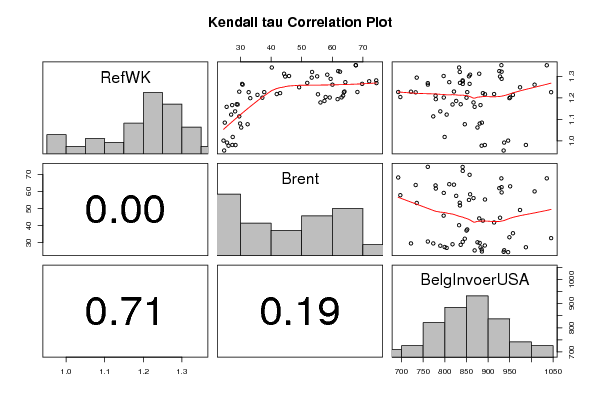
| Title produced by software | Kendall tau Correlation Matrix | ||||||||||||||||||||||||||||||||||||||||||||||||||
| Date of computation | Sat, 06 Dec 2008 11:21:09 -0700 | ||||||||||||||||||||||||||||||||||||||||||||||||||
| Cite this page as follows | Statistical Computations at FreeStatistics.org, Office for Research Development and Education, URL https://freestatistics.org/blog/index.php?v=date/2008/Dec/06/t1228587748bsbsasjsf0dxpbf.htm/, Retrieved Fri, 17 May 2024 04:09:19 +0000 | ||||||||||||||||||||||||||||||||||||||||||||||||||
| Statistical Computations at FreeStatistics.org, Office for Research Development and Education, URL https://freestatistics.org/blog/index.php?pk=29793, Retrieved Fri, 17 May 2024 04:09:19 +0000 | |||||||||||||||||||||||||||||||||||||||||||||||||||
| QR Codes: | |||||||||||||||||||||||||||||||||||||||||||||||||||
|
| |||||||||||||||||||||||||||||||||||||||||||||||||||
| Original text written by user: | |||||||||||||||||||||||||||||||||||||||||||||||||||
| IsPrivate? | No (this computation is public) | ||||||||||||||||||||||||||||||||||||||||||||||||||
| User-defined keywords | |||||||||||||||||||||||||||||||||||||||||||||||||||
| Estimated Impact | 160 | ||||||||||||||||||||||||||||||||||||||||||||||||||
Tree of Dependent Computations | |||||||||||||||||||||||||||||||||||||||||||||||||||
| Family? (F = Feedback message, R = changed R code, M = changed R Module, P = changed Parameters, D = changed Data) | |||||||||||||||||||||||||||||||||||||||||||||||||||
| - [Kendall tau Correlation Matrix] [Kendall tau Corre...] [2008-12-06 18:21:09] [382e90e66f02be5ed86892bdc1574692] [Current] | |||||||||||||||||||||||||||||||||||||||||||||||||||
| Feedback Forum | |||||||||||||||||||||||||||||||||||||||||||||||||||
Post a new message | |||||||||||||||||||||||||||||||||||||||||||||||||||
Dataset | |||||||||||||||||||||||||||||||||||||||||||||||||||
| Dataseries X: | |||||||||||||||||||||||||||||||||||||||||||||||||||
0,9554 24,67 935,9 0,9922 25,59 937,1 0,9778 26,09 885,1 0,9808 28,37 892,4 0,9811 27,34 987,3 1,0014 24,46 946,3 1,0183 27,46 799,6 1,0622 30,23 875,4 1,0773 32,33 846,2 1,0807 29,87 880,6 1,0848 24,87 885,7 1,1582 25,48 868,9 1,1663 27,28 882,5 1,1372 28,24 789,6 1,1139 29,58 773,3 1,1222 26,95 804,3 1,1692 29,08 817,8 1,1702 28,76 836,7 1,2286 29,59 721,8 1,2613 30,7 760,8 1,2646 30,52 841,4 1,2262 32,67 1045,6 1,1985 33,19 949,2 1,2007 37,13 850,1 1,2138 35,54 957,4 1,2266 37,75 851,8 1,2176 41,84 913,9 1,2218 42,94 888 1,249 49,14 973,8 1,2991 44,61 927,6 1,3408 40,22 833 1,3119 44,23 879,5 1,3014 45,85 797,3 1,3201 53,38 834,5 1,2938 53,26 735,1 1,2694 51,8 835 1,2165 55,3 892,8 1,2037 57,81 697,2 1,2292 63,96 821,1 1,2256 63,77 732,7 1,2015 59,15 797,6 1,1786 56,12 866,3 1,1856 57,42 826,3 1,2103 63,52 778,6 1,1938 61,71 779,2 1,202 63,01 951 1,2271 68,18 692,3 1,277 72,03 841,4 1,265 69,75 857,3 1,2684 74,41 760,7 1,2811 74,33 841,2 1,2727 64,24 810,3 1,2611 60,03 1007,4 1,2881 59,44 931,3 1,3213 62,5 931,2 1,2999 55,04 855,8 1,3074 58,34 858,4 1,3242 61,92 925,9 1,3516 67,65 930,7 1,3511 67,68 1035,6 | |||||||||||||||||||||||||||||||||||||||||||||||||||
Tables (Output of Computation) | |||||||||||||||||||||||||||||||||||||||||||||||||||
| |||||||||||||||||||||||||||||||||||||||||||||||||||
Figures (Output of Computation) | |||||||||||||||||||||||||||||||||||||||||||||||||||
Input Parameters & R Code | |||||||||||||||||||||||||||||||||||||||||||||||||||
| Parameters (Session): | |||||||||||||||||||||||||||||||||||||||||||||||||||
| Parameters (R input): | |||||||||||||||||||||||||||||||||||||||||||||||||||
| R code (references can be found in the software module): | |||||||||||||||||||||||||||||||||||||||||||||||||||
panel.tau <- function(x, y, digits=2, prefix='', cex.cor) | |||||||||||||||||||||||||||||||||||||||||||||||||||