Free Statistics
of Irreproducible Research!
Description of Statistical Computation | |||||||||||||||||||||||||||||||||||||||||
|---|---|---|---|---|---|---|---|---|---|---|---|---|---|---|---|---|---|---|---|---|---|---|---|---|---|---|---|---|---|---|---|---|---|---|---|---|---|---|---|---|---|
| Author's title | |||||||||||||||||||||||||||||||||||||||||
| Author | *The author of this computation has been verified* | ||||||||||||||||||||||||||||||||||||||||
| R Software Module | rwasp_univariatedataseries.wasp | ||||||||||||||||||||||||||||||||||||||||
| Title produced by software | Univariate Data Series | ||||||||||||||||||||||||||||||||||||||||
| Date of computation | Thu, 04 Dec 2008 05:54:11 -0700 | ||||||||||||||||||||||||||||||||||||||||
| Cite this page as follows | Statistical Computations at FreeStatistics.org, Office for Research Development and Education, URL https://freestatistics.org/blog/index.php?v=date/2008/Dec/04/t1228395286zp51ieb6ey48jgj.htm/, Retrieved Wed, 22 May 2024 14:09:42 +0000 | ||||||||||||||||||||||||||||||||||||||||
| Statistical Computations at FreeStatistics.org, Office for Research Development and Education, URL https://freestatistics.org/blog/index.php?pk=28922, Retrieved Wed, 22 May 2024 14:09:42 +0000 | |||||||||||||||||||||||||||||||||||||||||
| QR Codes: | |||||||||||||||||||||||||||||||||||||||||
|
| |||||||||||||||||||||||||||||||||||||||||
| Original text written by user: | |||||||||||||||||||||||||||||||||||||||||
| IsPrivate? | No (this computation is public) | ||||||||||||||||||||||||||||||||||||||||
| User-defined keywords | |||||||||||||||||||||||||||||||||||||||||
| Estimated Impact | 225 | ||||||||||||||||||||||||||||||||||||||||
Tree of Dependent Computations | |||||||||||||||||||||||||||||||||||||||||
| Family? (F = Feedback message, R = changed R code, M = changed R Module, P = changed Parameters, D = changed Data) | |||||||||||||||||||||||||||||||||||||||||
| F [Multiple Regression] [Seatbelt law & tu...] [2008-11-23 16:25:09] [3a9fc6d5b5e0e816787b7dbace57e7cd] - D [Multiple Regression] [] [2008-12-04 10:30:10] [3a9fc6d5b5e0e816787b7dbace57e7cd] - RM D [Univariate Data Series] [paper] [2008-12-04 12:54:11] [821c4b3d195be8e737cf8c9dc649d3cf] [Current] - PD [Univariate Data Series] [marlies.polfliet_...] [2008-12-07 15:08:42] [fdc296cbeb5d8064cb0dbd634c3fdc55] - RMPD [(Partial) Autocorrelation Function] [marlies.polfliet_...] [2008-12-07 15:13:54] [fdc296cbeb5d8064cb0dbd634c3fdc55] - RMPD [Variance Reduction Matrix] [marlies.polfliet_...] [2008-12-07 15:20:09] [fdc296cbeb5d8064cb0dbd634c3fdc55] - RMPD [Standard Deviation-Mean Plot] [marlies.polfliet_...] [2008-12-07 15:23:12] [fdc296cbeb5d8064cb0dbd634c3fdc55] - RMPD [Spectral Analysis] [marlies.polfliet_...] [2008-12-07 15:26:59] [fdc296cbeb5d8064cb0dbd634c3fdc55] - P [Spectral Analysis] [marlies.polfliet_...] [2008-12-07 15:29:59] [fdc296cbeb5d8064cb0dbd634c3fdc55] - P [Spectral Analysis] [marlies.polfliet_...] [2008-12-07 15:33:36] [fdc296cbeb5d8064cb0dbd634c3fdc55] | |||||||||||||||||||||||||||||||||||||||||
| Feedback Forum | |||||||||||||||||||||||||||||||||||||||||
Post a new message | |||||||||||||||||||||||||||||||||||||||||
Dataset | |||||||||||||||||||||||||||||||||||||||||
| Dataseries X: | |||||||||||||||||||||||||||||||||||||||||
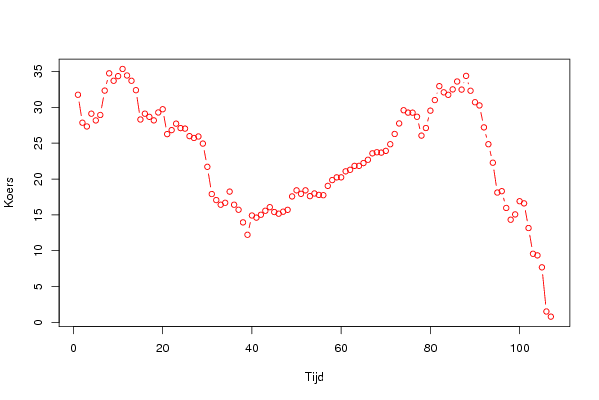
31.75 27.85 27.33 29.11 28.17 28.93 32.33 34.74 33.70 34.35 35.35 34.44 33.70 32.39 28.30 29.11 28.67 28.18 29.28 29.73 26.26 26.82 27.72 27.10 27.03 25.98 25.72 25.93 24.94 21.70 17.90 17.06 16.41 16.68 18.24 16.41 15.71 13.95 12.22 14.91 14.61 15.01 15.57 16.07 15.39 15.16 15.44 15.70 17.57 18.42 17.93 18.42 17.61 17.98 17.78 17.74 19.04 19.85 20.23 20.23 21.07 21.28 21.83 21.83 22.22 22.68 23.58 23.73 23.68 23.92 24.85 26.28 27.75 29.59 29.26 29.25 28.68 26.05 27.11 29.53 31.01 32.95 32.09 31.74 32.50 33.60 32.47 34.38 32.31 30.71 30.26 27.20 24.85 22.27 18.11 18.30 15.96 14.32 15.06 16.90 16.60 13.16 9.57 9.35 7.68 1.52 0.80 | |||||||||||||||||||||||||||||||||||||||||
Tables (Output of Computation) | |||||||||||||||||||||||||||||||||||||||||
| |||||||||||||||||||||||||||||||||||||||||
Figures (Output of Computation) | |||||||||||||||||||||||||||||||||||||||||
Input Parameters & R Code | |||||||||||||||||||||||||||||||||||||||||
| Parameters (Session): | |||||||||||||||||||||||||||||||||||||||||
| par1 = 1 ; par2 = Include Monthly Dummies ; par3 = Linear Trend ; | |||||||||||||||||||||||||||||||||||||||||
| Parameters (R input): | |||||||||||||||||||||||||||||||||||||||||
| par1 = ; par2 = ; par3 = ; | |||||||||||||||||||||||||||||||||||||||||
| R code (references can be found in the software module): | |||||||||||||||||||||||||||||||||||||||||
bitmap(file='test1.png') | |||||||||||||||||||||||||||||||||||||||||