Free Statistics

of Irreproducible Research!

Author's title

Author*Unverified author*
R Software Modulerwasp_autocorrelation.wasp
Title produced by software(Partial) Autocorrelation Function
Date of computationWed, 03 Dec 2008 11:17:13 -0700
Cite this page as followsStatistical Computations at FreeStatistics.org, Office for Research Development and Education, URL https://freestatistics.org/blog/index.php?v=date/2008/Dec/03/t1228328318wa0g03owl9r1qtc.htm/, Retrieved Fri, 17 May 2024 03:04:24 +0000
Statistical Computations at FreeStatistics.org, Office for Research Development and Education, URL https://freestatistics.org/blog/index.php?pk=28832, Retrieved Fri, 17 May 2024 03:04:24 +0000
QR Codes:

Original text written by user:
IsPrivate?No (this computation is public)
User-defined keywords
Estimated Impact189
Family? (F = Feedback message, R = changed R code, M = changed R Module, P = changed Parameters, D = changed Data)
-       [(Partial) Autocorrelation Function] [(P)ACF Producten ...] [2008-12-03 18:17:13] [d41d8cd98f00b204e9800998ecf8427e] [Current]
Feedback Forum

Post a new message
Dataseries X:
98.4
99.4
108.8
112.6
104.4
112.2
81.1
97.1
112.6
113.8
107.8
103.2
103.3
101.2
107.7
110.4
101.9
115.9
89.9
88.6
117.2
123.9
100
103.6
94.1
98.7
119.5
112.7
104.4
124.7
89.1
97
121.6
118.8
114
111.5
97.2
102.5
113.4
109.8
104.9
126.1
80
96.8
117.2
112.3
117.3
111.1
102.2
104.3
122.9
107.6
121.3
131.5
89
104.4
128.9
135.9
133.3
121.3
120.5
120.4
137.9
126.1
133.2
151.1
105
119
140.4
156.6
137.1
122.7
125.8


Summary of computational transaction
Raw Inputview raw input (R code)
Raw Outputview raw output of R engine
Computing time1 seconds
R Server'George Udny Yule' @ 72.249.76.132

\begin{tabular}{lllllllll}
\hline
Summary of computational transaction \tabularnewline
Raw Input & view raw input (R code)  \tabularnewline
Raw Output & view raw output of R engine  \tabularnewline
Computing time & 1 seconds \tabularnewline
R Server & 'George Udny Yule' @ 72.249.76.132 \tabularnewline
\hline
\end{tabular}
%Source: https://freestatistics.org/blog/index.php?pk=28832&T=0

[TABLE]
[ROW][C]Summary of computational transaction[/C][/ROW]
[ROW][C]Raw Input[/C][C]view raw input (R code) [/C][/ROW]
[ROW][C]Raw Output[/C][C]view raw output of R engine [/C][/ROW]
[ROW][C]Computing time[/C][C]1 seconds[/C][/ROW]
[ROW][C]R Server[/C][C]'George Udny Yule' @ 72.249.76.132[/C][/ROW]
[/TABLE]
Source: https://freestatistics.org/blog/index.php?pk=28832&T=0

Globally Unique Identifier (entire table): ba.freestatistics.org/blog/index.php?pk=28832&T=0

As an alternative you can also use a QR Code:  

The GUIDs for individual cells are displayed in the table below:

Summary of computational transaction
Raw Inputview raw input (R code)
Raw Outputview raw output of R engine
Computing time1 seconds
R Server'George Udny Yule' @ 72.249.76.132


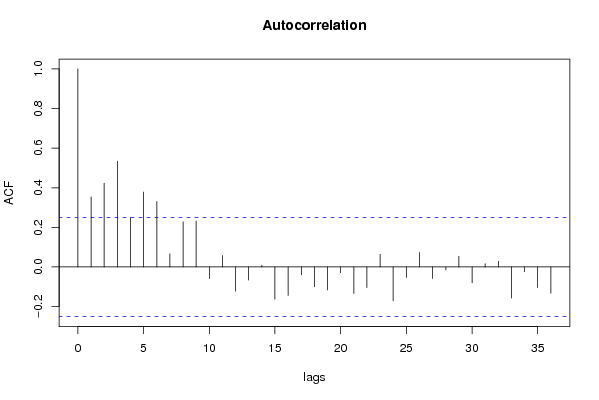
Autocorrelation Function
Time lag kACF(k)T-STATP-value
10.3539052.76410.003769
20.4228053.30220.000804
30.534154.17184.9e-05
40.2502391.95440.027619
50.3781582.95350.002229
60.330712.58290.006105
70.0665960.52010.302428
80.2279411.78030.040006
90.2316521.80930.03767
10-0.05887-0.45980.323651
110.0582450.45490.325395
12-0.122266-0.95490.171691
13-0.066084-0.51610.303814
140.0082790.06470.474326
15-0.163036-1.27340.103862
16-0.144066-1.12520.132458
17-0.039544-0.30880.379244
18-0.099552-0.77750.219927
19-0.116018-0.90610.184215
20-0.02868-0.2240.411752
21-0.133829-1.04520.150019
22-0.103983-0.81210.209936
230.0641840.50130.308984
24-0.170803-1.3340.093579
25-0.052773-0.41220.340831
260.0736490.57520.283631
27-0.058248-0.45490.325387
28-0.01446-0.11290.455227
290.0538130.42030.337874
30-0.079984-0.62470.26725
310.0163490.12770.449408
320.0285940.22330.412014
33-0.157257-1.22820.112042
34-0.02359-0.18420.427216
35-0.104268-0.81440.209303
36-0.132736-1.03670.151984

\begin{tabular}{lllllllll}
\hline
Autocorrelation Function \tabularnewline
Time lag k & ACF(k) & T-STAT & P-value \tabularnewline
1 & 0.353905 & 2.7641 & 0.003769 \tabularnewline
2 & 0.422805 & 3.3022 & 0.000804 \tabularnewline
3 & 0.53415 & 4.1718 & 4.9e-05 \tabularnewline
4 & 0.250239 & 1.9544 & 0.027619 \tabularnewline
5 & 0.378158 & 2.9535 & 0.002229 \tabularnewline
6 & 0.33071 & 2.5829 & 0.006105 \tabularnewline
7 & 0.066596 & 0.5201 & 0.302428 \tabularnewline
8 & 0.227941 & 1.7803 & 0.040006 \tabularnewline
9 & 0.231652 & 1.8093 & 0.03767 \tabularnewline
10 & -0.05887 & -0.4598 & 0.323651 \tabularnewline
11 & 0.058245 & 0.4549 & 0.325395 \tabularnewline
12 & -0.122266 & -0.9549 & 0.171691 \tabularnewline
13 & -0.066084 & -0.5161 & 0.303814 \tabularnewline
14 & 0.008279 & 0.0647 & 0.474326 \tabularnewline
15 & -0.163036 & -1.2734 & 0.103862 \tabularnewline
16 & -0.144066 & -1.1252 & 0.132458 \tabularnewline
17 & -0.039544 & -0.3088 & 0.379244 \tabularnewline
18 & -0.099552 & -0.7775 & 0.219927 \tabularnewline
19 & -0.116018 & -0.9061 & 0.184215 \tabularnewline
20 & -0.02868 & -0.224 & 0.411752 \tabularnewline
21 & -0.133829 & -1.0452 & 0.150019 \tabularnewline
22 & -0.103983 & -0.8121 & 0.209936 \tabularnewline
23 & 0.064184 & 0.5013 & 0.308984 \tabularnewline
24 & -0.170803 & -1.334 & 0.093579 \tabularnewline
25 & -0.052773 & -0.4122 & 0.340831 \tabularnewline
26 & 0.073649 & 0.5752 & 0.283631 \tabularnewline
27 & -0.058248 & -0.4549 & 0.325387 \tabularnewline
28 & -0.01446 & -0.1129 & 0.455227 \tabularnewline
29 & 0.053813 & 0.4203 & 0.337874 \tabularnewline
30 & -0.079984 & -0.6247 & 0.26725 \tabularnewline
31 & 0.016349 & 0.1277 & 0.449408 \tabularnewline
32 & 0.028594 & 0.2233 & 0.412014 \tabularnewline
33 & -0.157257 & -1.2282 & 0.112042 \tabularnewline
34 & -0.02359 & -0.1842 & 0.427216 \tabularnewline
35 & -0.104268 & -0.8144 & 0.209303 \tabularnewline
36 & -0.132736 & -1.0367 & 0.151984 \tabularnewline
\hline
\end{tabular}
%Source: https://freestatistics.org/blog/index.php?pk=28832&T=1

[TABLE]
[ROW][C]Autocorrelation Function[/C][/ROW]
[ROW][C]Time lag k[/C][C]ACF(k)[/C][C]T-STAT[/C][C]P-value[/C][/ROW]
[ROW][C]1[/C][C]0.353905[/C][C]2.7641[/C][C]0.003769[/C][/ROW]
[ROW][C]2[/C][C]0.422805[/C][C]3.3022[/C][C]0.000804[/C][/ROW]
[ROW][C]3[/C][C]0.53415[/C][C]4.1718[/C][C]4.9e-05[/C][/ROW]
[ROW][C]4[/C][C]0.250239[/C][C]1.9544[/C][C]0.027619[/C][/ROW]
[ROW][C]5[/C][C]0.378158[/C][C]2.9535[/C][C]0.002229[/C][/ROW]
[ROW][C]6[/C][C]0.33071[/C][C]2.5829[/C][C]0.006105[/C][/ROW]
[ROW][C]7[/C][C]0.066596[/C][C]0.5201[/C][C]0.302428[/C][/ROW]
[ROW][C]8[/C][C]0.227941[/C][C]1.7803[/C][C]0.040006[/C][/ROW]
[ROW][C]9[/C][C]0.231652[/C][C]1.8093[/C][C]0.03767[/C][/ROW]
[ROW][C]10[/C][C]-0.05887[/C][C]-0.4598[/C][C]0.323651[/C][/ROW]
[ROW][C]11[/C][C]0.058245[/C][C]0.4549[/C][C]0.325395[/C][/ROW]
[ROW][C]12[/C][C]-0.122266[/C][C]-0.9549[/C][C]0.171691[/C][/ROW]
[ROW][C]13[/C][C]-0.066084[/C][C]-0.5161[/C][C]0.303814[/C][/ROW]
[ROW][C]14[/C][C]0.008279[/C][C]0.0647[/C][C]0.474326[/C][/ROW]
[ROW][C]15[/C][C]-0.163036[/C][C]-1.2734[/C][C]0.103862[/C][/ROW]
[ROW][C]16[/C][C]-0.144066[/C][C]-1.1252[/C][C]0.132458[/C][/ROW]
[ROW][C]17[/C][C]-0.039544[/C][C]-0.3088[/C][C]0.379244[/C][/ROW]
[ROW][C]18[/C][C]-0.099552[/C][C]-0.7775[/C][C]0.219927[/C][/ROW]
[ROW][C]19[/C][C]-0.116018[/C][C]-0.9061[/C][C]0.184215[/C][/ROW]
[ROW][C]20[/C][C]-0.02868[/C][C]-0.224[/C][C]0.411752[/C][/ROW]
[ROW][C]21[/C][C]-0.133829[/C][C]-1.0452[/C][C]0.150019[/C][/ROW]
[ROW][C]22[/C][C]-0.103983[/C][C]-0.8121[/C][C]0.209936[/C][/ROW]
[ROW][C]23[/C][C]0.064184[/C][C]0.5013[/C][C]0.308984[/C][/ROW]
[ROW][C]24[/C][C]-0.170803[/C][C]-1.334[/C][C]0.093579[/C][/ROW]
[ROW][C]25[/C][C]-0.052773[/C][C]-0.4122[/C][C]0.340831[/C][/ROW]
[ROW][C]26[/C][C]0.073649[/C][C]0.5752[/C][C]0.283631[/C][/ROW]
[ROW][C]27[/C][C]-0.058248[/C][C]-0.4549[/C][C]0.325387[/C][/ROW]
[ROW][C]28[/C][C]-0.01446[/C][C]-0.1129[/C][C]0.455227[/C][/ROW]
[ROW][C]29[/C][C]0.053813[/C][C]0.4203[/C][C]0.337874[/C][/ROW]
[ROW][C]30[/C][C]-0.079984[/C][C]-0.6247[/C][C]0.26725[/C][/ROW]
[ROW][C]31[/C][C]0.016349[/C][C]0.1277[/C][C]0.449408[/C][/ROW]
[ROW][C]32[/C][C]0.028594[/C][C]0.2233[/C][C]0.412014[/C][/ROW]
[ROW][C]33[/C][C]-0.157257[/C][C]-1.2282[/C][C]0.112042[/C][/ROW]
[ROW][C]34[/C][C]-0.02359[/C][C]-0.1842[/C][C]0.427216[/C][/ROW]
[ROW][C]35[/C][C]-0.104268[/C][C]-0.8144[/C][C]0.209303[/C][/ROW]
[ROW][C]36[/C][C]-0.132736[/C][C]-1.0367[/C][C]0.151984[/C][/ROW]
[/TABLE]
Source: https://freestatistics.org/blog/index.php?pk=28832&T=1

Globally Unique Identifier (entire table): ba.freestatistics.org/blog/index.php?pk=28832&T=1

As an alternative you can also use a QR Code:  

The GUIDs for individual cells are displayed in the table below:

Autocorrelation Function
Time lag kACF(k)T-STATP-value
10.3539052.76410.003769
20.4228053.30220.000804
30.534154.17184.9e-05
40.2502391.95440.027619
50.3781582.95350.002229
60.330712.58290.006105
70.0665960.52010.302428
80.2279411.78030.040006
90.2316521.80930.03767
10-0.05887-0.45980.323651
110.0582450.45490.325395
12-0.122266-0.95490.171691
13-0.066084-0.51610.303814
140.0082790.06470.474326
15-0.163036-1.27340.103862
16-0.144066-1.12520.132458
17-0.039544-0.30880.379244
18-0.099552-0.77750.219927
19-0.116018-0.90610.184215
20-0.02868-0.2240.411752
21-0.133829-1.04520.150019
22-0.103983-0.81210.209936
230.0641840.50130.308984
24-0.170803-1.3340.093579
25-0.052773-0.41220.340831
260.0736490.57520.283631
27-0.058248-0.45490.325387
28-0.01446-0.11290.455227
290.0538130.42030.337874
30-0.079984-0.62470.26725
310.0163490.12770.449408
320.0285940.22330.412014
33-0.157257-1.22820.112042
34-0.02359-0.18420.427216
35-0.104268-0.81440.209303
36-0.132736-1.03670.151984


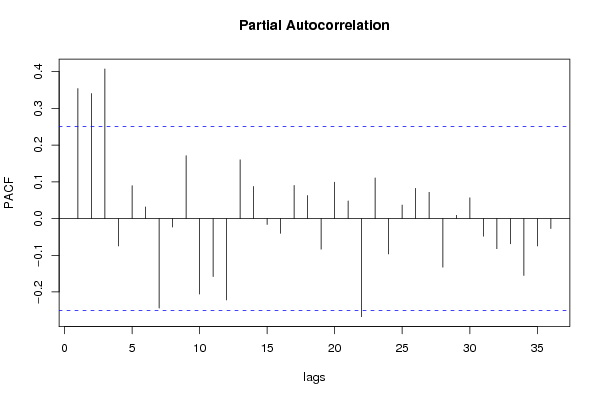
Partial Autocorrelation Function
Time lag kPACF(k)T-STATP-value
10.3539052.76410.003769
20.340162.65670.005028
30.4072633.18080.001155
4-0.074765-0.58390.28071
50.0893830.69810.243882
60.031530.24630.403155
7-0.243684-1.90320.030866
8-0.023201-0.18120.428405
90.1712021.33710.093073
10-0.205831-1.60760.056544
11-0.158019-1.23420.110937
12-0.221558-1.73040.044305
130.1599071.24890.108235
140.0874940.68340.248486
15-0.016172-0.12630.449953
16-0.040325-0.3150.376937
170.0899470.70250.242517
180.062670.48950.313133
19-0.083523-0.65230.258318
200.0988660.77220.221498
210.0480410.37520.354402
22-0.267171-2.08670.020552
230.1104350.86250.195888
24-0.096599-0.75450.226737
250.0367250.28680.387608
260.0821010.64120.261888
270.0714480.5580.289435
28-0.132573-1.03540.152278
290.0086390.06750.473213
300.0564050.44050.330552
31-0.048117-0.37580.354182
32-0.082241-0.64230.261534
33-0.069009-0.5390.295932
34-0.154858-1.20950.115572
35-0.0748-0.58420.280619
36-0.027465-0.21450.415432

\begin{tabular}{lllllllll}
\hline
Partial Autocorrelation Function \tabularnewline
Time lag k & PACF(k) & T-STAT & P-value \tabularnewline
1 & 0.353905 & 2.7641 & 0.003769 \tabularnewline
2 & 0.34016 & 2.6567 & 0.005028 \tabularnewline
3 & 0.407263 & 3.1808 & 0.001155 \tabularnewline
4 & -0.074765 & -0.5839 & 0.28071 \tabularnewline
5 & 0.089383 & 0.6981 & 0.243882 \tabularnewline
6 & 0.03153 & 0.2463 & 0.403155 \tabularnewline
7 & -0.243684 & -1.9032 & 0.030866 \tabularnewline
8 & -0.023201 & -0.1812 & 0.428405 \tabularnewline
9 & 0.171202 & 1.3371 & 0.093073 \tabularnewline
10 & -0.205831 & -1.6076 & 0.056544 \tabularnewline
11 & -0.158019 & -1.2342 & 0.110937 \tabularnewline
12 & -0.221558 & -1.7304 & 0.044305 \tabularnewline
13 & 0.159907 & 1.2489 & 0.108235 \tabularnewline
14 & 0.087494 & 0.6834 & 0.248486 \tabularnewline
15 & -0.016172 & -0.1263 & 0.449953 \tabularnewline
16 & -0.040325 & -0.315 & 0.376937 \tabularnewline
17 & 0.089947 & 0.7025 & 0.242517 \tabularnewline
18 & 0.06267 & 0.4895 & 0.313133 \tabularnewline
19 & -0.083523 & -0.6523 & 0.258318 \tabularnewline
20 & 0.098866 & 0.7722 & 0.221498 \tabularnewline
21 & 0.048041 & 0.3752 & 0.354402 \tabularnewline
22 & -0.267171 & -2.0867 & 0.020552 \tabularnewline
23 & 0.110435 & 0.8625 & 0.195888 \tabularnewline
24 & -0.096599 & -0.7545 & 0.226737 \tabularnewline
25 & 0.036725 & 0.2868 & 0.387608 \tabularnewline
26 & 0.082101 & 0.6412 & 0.261888 \tabularnewline
27 & 0.071448 & 0.558 & 0.289435 \tabularnewline
28 & -0.132573 & -1.0354 & 0.152278 \tabularnewline
29 & 0.008639 & 0.0675 & 0.473213 \tabularnewline
30 & 0.056405 & 0.4405 & 0.330552 \tabularnewline
31 & -0.048117 & -0.3758 & 0.354182 \tabularnewline
32 & -0.082241 & -0.6423 & 0.261534 \tabularnewline
33 & -0.069009 & -0.539 & 0.295932 \tabularnewline
34 & -0.154858 & -1.2095 & 0.115572 \tabularnewline
35 & -0.0748 & -0.5842 & 0.280619 \tabularnewline
36 & -0.027465 & -0.2145 & 0.415432 \tabularnewline
\hline
\end{tabular}
%Source: https://freestatistics.org/blog/index.php?pk=28832&T=2

[TABLE]
[ROW][C]Partial Autocorrelation Function[/C][/ROW]
[ROW][C]Time lag k[/C][C]PACF(k)[/C][C]T-STAT[/C][C]P-value[/C][/ROW]
[ROW][C]1[/C][C]0.353905[/C][C]2.7641[/C][C]0.003769[/C][/ROW]
[ROW][C]2[/C][C]0.34016[/C][C]2.6567[/C][C]0.005028[/C][/ROW]
[ROW][C]3[/C][C]0.407263[/C][C]3.1808[/C][C]0.001155[/C][/ROW]
[ROW][C]4[/C][C]-0.074765[/C][C]-0.5839[/C][C]0.28071[/C][/ROW]
[ROW][C]5[/C][C]0.089383[/C][C]0.6981[/C][C]0.243882[/C][/ROW]
[ROW][C]6[/C][C]0.03153[/C][C]0.2463[/C][C]0.403155[/C][/ROW]
[ROW][C]7[/C][C]-0.243684[/C][C]-1.9032[/C][C]0.030866[/C][/ROW]
[ROW][C]8[/C][C]-0.023201[/C][C]-0.1812[/C][C]0.428405[/C][/ROW]
[ROW][C]9[/C][C]0.171202[/C][C]1.3371[/C][C]0.093073[/C][/ROW]
[ROW][C]10[/C][C]-0.205831[/C][C]-1.6076[/C][C]0.056544[/C][/ROW]
[ROW][C]11[/C][C]-0.158019[/C][C]-1.2342[/C][C]0.110937[/C][/ROW]
[ROW][C]12[/C][C]-0.221558[/C][C]-1.7304[/C][C]0.044305[/C][/ROW]
[ROW][C]13[/C][C]0.159907[/C][C]1.2489[/C][C]0.108235[/C][/ROW]
[ROW][C]14[/C][C]0.087494[/C][C]0.6834[/C][C]0.248486[/C][/ROW]
[ROW][C]15[/C][C]-0.016172[/C][C]-0.1263[/C][C]0.449953[/C][/ROW]
[ROW][C]16[/C][C]-0.040325[/C][C]-0.315[/C][C]0.376937[/C][/ROW]
[ROW][C]17[/C][C]0.089947[/C][C]0.7025[/C][C]0.242517[/C][/ROW]
[ROW][C]18[/C][C]0.06267[/C][C]0.4895[/C][C]0.313133[/C][/ROW]
[ROW][C]19[/C][C]-0.083523[/C][C]-0.6523[/C][C]0.258318[/C][/ROW]
[ROW][C]20[/C][C]0.098866[/C][C]0.7722[/C][C]0.221498[/C][/ROW]
[ROW][C]21[/C][C]0.048041[/C][C]0.3752[/C][C]0.354402[/C][/ROW]
[ROW][C]22[/C][C]-0.267171[/C][C]-2.0867[/C][C]0.020552[/C][/ROW]
[ROW][C]23[/C][C]0.110435[/C][C]0.8625[/C][C]0.195888[/C][/ROW]
[ROW][C]24[/C][C]-0.096599[/C][C]-0.7545[/C][C]0.226737[/C][/ROW]
[ROW][C]25[/C][C]0.036725[/C][C]0.2868[/C][C]0.387608[/C][/ROW]
[ROW][C]26[/C][C]0.082101[/C][C]0.6412[/C][C]0.261888[/C][/ROW]
[ROW][C]27[/C][C]0.071448[/C][C]0.558[/C][C]0.289435[/C][/ROW]
[ROW][C]28[/C][C]-0.132573[/C][C]-1.0354[/C][C]0.152278[/C][/ROW]
[ROW][C]29[/C][C]0.008639[/C][C]0.0675[/C][C]0.473213[/C][/ROW]
[ROW][C]30[/C][C]0.056405[/C][C]0.4405[/C][C]0.330552[/C][/ROW]
[ROW][C]31[/C][C]-0.048117[/C][C]-0.3758[/C][C]0.354182[/C][/ROW]
[ROW][C]32[/C][C]-0.082241[/C][C]-0.6423[/C][C]0.261534[/C][/ROW]
[ROW][C]33[/C][C]-0.069009[/C][C]-0.539[/C][C]0.295932[/C][/ROW]
[ROW][C]34[/C][C]-0.154858[/C][C]-1.2095[/C][C]0.115572[/C][/ROW]
[ROW][C]35[/C][C]-0.0748[/C][C]-0.5842[/C][C]0.280619[/C][/ROW]
[ROW][C]36[/C][C]-0.027465[/C][C]-0.2145[/C][C]0.415432[/C][/ROW]
[/TABLE]
Source: https://freestatistics.org/blog/index.php?pk=28832&T=2

Globally Unique Identifier (entire table): ba.freestatistics.org/blog/index.php?pk=28832&T=2

As an alternative you can also use a QR Code:  

The GUIDs for individual cells are displayed in the table below:

Partial Autocorrelation Function
Time lag kPACF(k)T-STATP-value
10.3539052.76410.003769
20.340162.65670.005028
30.4072633.18080.001155
4-0.074765-0.58390.28071
50.0893830.69810.243882
60.031530.24630.403155
7-0.243684-1.90320.030866
8-0.023201-0.18120.428405
90.1712021.33710.093073
10-0.205831-1.60760.056544
11-0.158019-1.23420.110937
12-0.221558-1.73040.044305
130.1599071.24890.108235
140.0874940.68340.248486
15-0.016172-0.12630.449953
16-0.040325-0.3150.376937
170.0899470.70250.242517
180.062670.48950.313133
19-0.083523-0.65230.258318
200.0988660.77220.221498
210.0480410.37520.354402
22-0.267171-2.08670.020552
230.1104350.86250.195888
24-0.096599-0.75450.226737
250.0367250.28680.387608
260.0821010.64120.261888
270.0714480.5580.289435
28-0.132573-1.03540.152278
290.0086390.06750.473213
300.0564050.44050.330552
31-0.048117-0.37580.354182
32-0.082241-0.64230.261534
33-0.069009-0.5390.295932
34-0.154858-1.20950.115572
35-0.0748-0.58420.280619
36-0.027465-0.21450.415432


Parameters (Session):
par1 = -0.4 ; par2 = 0 ; par3 = 1 ; par4 = 12 ;
Parameters (R input):
par1 = 36 ; par2 = -0.8 ; par3 = 0 ; par4 = 1 ; par5 = 12 ;
R code (references can be found in the software module):
if (par1 == 'Default') {
par1 = 10*log10(length(x))
} else {
par1 <- as.numeric(par1)
}
par2 <- as.numeric(par2)
par3 <- as.numeric(par3)
par4 <- as.numeric(par4)
par5 <- as.numeric(par5)
if (par2 == 0) {
x <- log(x)
} else {
x <- (x ^ par2 - 1) / par2
}
if (par3 > 0) x <- diff(x,lag=1,difference=par3)
if (par4 > 0) x <- diff(x,lag=par5,difference=par4)
bitmap(file='pic1.png')
racf <- acf(x,par1,main='Autocorrelation',xlab='lags',ylab='ACF')
dev.off()
bitmap(file='pic2.png')
rpacf <- pacf(x,par1,main='Partial Autocorrelation',xlab='lags',ylab='PACF')
dev.off()
(myacf <- c(racf$acf))
(mypacf <- c(rpacf$acf))
lengthx <- length(x)
sqrtn <- sqrt(lengthx)
load(file='createtable')
a<-table.start()
a<-table.row.start(a)
a<-table.element(a,'Autocorrelation Function',4,TRUE)
a<-table.row.end(a)
a<-table.row.start(a)
a<-table.element(a,'Time lag k',header=TRUE)
a<-table.element(a,hyperlink('basics.htm','ACF(k)','click here for more information about the Autocorrelation Function'),header=TRUE)
a<-table.element(a,'T-STAT',header=TRUE)
a<-table.element(a,'P-value',header=TRUE)
a<-table.row.end(a)
for (i in 2:(par1+1)) {
a<-table.row.start(a)
a<-table.element(a,i-1,header=TRUE)
a<-table.element(a,round(myacf[i],6))
mytstat <- myacf[i]*sqrtn
a<-table.element(a,round(mytstat,4))
a<-table.element(a,round(1-pt(abs(mytstat),lengthx),6))
a<-table.row.end(a)
}
a<-table.end(a)
table.save(a,file='mytable.tab')
a<-table.start()
a<-table.row.start(a)
a<-table.element(a,'Partial Autocorrelation Function',4,TRUE)
a<-table.row.end(a)
a<-table.row.start(a)
a<-table.element(a,'Time lag k',header=TRUE)
a<-table.element(a,hyperlink('basics.htm','PACF(k)','click here for more information about the Partial Autocorrelation Function'),header=TRUE)
a<-table.element(a,'T-STAT',header=TRUE)
a<-table.element(a,'P-value',header=TRUE)
a<-table.row.end(a)
for (i in 1:par1) {
a<-table.row.start(a)
a<-table.element(a,i,header=TRUE)
a<-table.element(a,round(mypacf[i],6))
mytstat <- mypacf[i]*sqrtn
a<-table.element(a,round(mytstat,4))
a<-table.element(a,round(1-pt(abs(mytstat),lengthx),6))
a<-table.row.end(a)
}
a<-table.end(a)
table.save(a,file='mytable1.tab')