Free Statistics

of Irreproducible Research!

Author's title

Author*The author of this computation has been verified*
R Software Modulerwasp_autocorrelation.wasp
Title produced by software(Partial) Autocorrelation Function
Date of computationWed, 03 Dec 2008 09:39:57 -0700
Cite this page as followsStatistical Computations at FreeStatistics.org, Office for Research Development and Education, URL https://freestatistics.org/blog/index.php?v=date/2008/Dec/03/t1228322448x1lwzx4gzm7t9cy.htm/, Retrieved Fri, 17 May 2024 04:09:21 +0000
Statistical Computations at FreeStatistics.org, Office for Research Development and Education, URL https://freestatistics.org/blog/index.php?pk=28779, Retrieved Fri, 17 May 2024 04:09:21 +0000
QR Codes:

Original text written by user:
IsPrivate?No (this computation is public)
User-defined keywords
Estimated Impact201
Family? (F = Feedback message, R = changed R code, M = changed R Module, P = changed Parameters, D = changed Data)
-     [Univariate Data Series] [data set] [2008-12-01 19:54:57] [b98453cac15ba1066b407e146608df68]
- RMPD  [(Partial) Autocorrelation Function] [taak 8 werklozen ...] [2008-12-03 16:32:44] [e1a46c1dcfccb0cb690f79a1a409b517]
-   P     [(Partial) Autocorrelation Function] [taak 8 werklozen ...] [2008-12-03 16:37:45] [e1a46c1dcfccb0cb690f79a1a409b517]
-   P         [(Partial) Autocorrelation Function] [taak 8 werklozen ...] [2008-12-03 16:39:57] [bda7fba231d49184c6a1b627868bbb81] [Current]
Feedback Forum

Post a new message
Dataseries X:
189917
184128
175335
179566
181140
177876
175041
169292
166070
166972
206348
215706
202108
195411
193111
195198
198770
194163
190420
189733
186029
191531
232571
243477
227247
217859
208679
213188
216234
213587
209465
204045
200237
203666
241476
260307
243324
244460
233575
237217
235243
230354
227184
221678
217142
219452
256446
265845
248624
241114
229245
231805
219277
219313
212610
214771
211142
211457
240048
240636
230580


Summary of computational transaction
Raw Inputview raw input (R code)
Raw Outputview raw output of R engine
Computing time1 seconds
R Server'Gwilym Jenkins' @ 72.249.127.135

\begin{tabular}{lllllllll}
\hline
Summary of computational transaction \tabularnewline
Raw Input & view raw input (R code)  \tabularnewline
Raw Output & view raw output of R engine  \tabularnewline
Computing time & 1 seconds \tabularnewline
R Server & 'Gwilym Jenkins' @ 72.249.127.135 \tabularnewline
\hline
\end{tabular}
%Source: https://freestatistics.org/blog/index.php?pk=28779&T=0

[TABLE]
[ROW][C]Summary of computational transaction[/C][/ROW]
[ROW][C]Raw Input[/C][C]view raw input (R code) [/C][/ROW]
[ROW][C]Raw Output[/C][C]view raw output of R engine [/C][/ROW]
[ROW][C]Computing time[/C][C]1 seconds[/C][/ROW]
[ROW][C]R Server[/C][C]'Gwilym Jenkins' @ 72.249.127.135[/C][/ROW]
[/TABLE]
Source: https://freestatistics.org/blog/index.php?pk=28779&T=0

Globally Unique Identifier (entire table): ba.freestatistics.org/blog/index.php?pk=28779&T=0

As an alternative you can also use a QR Code:  

The GUIDs for individual cells are displayed in the table below:

Summary of computational transaction
Raw Inputview raw input (R code)
Raw Outputview raw output of R engine
Computing time1 seconds
R Server'Gwilym Jenkins' @ 72.249.127.135


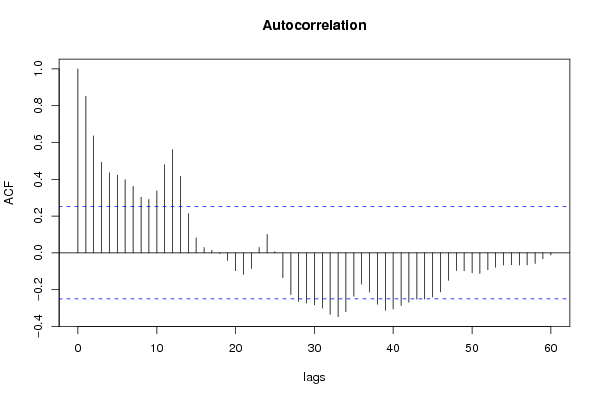
Autocorrelation Function
Time lag kACF(k)T-STATP-value
10.8509796.64640
20.6353874.96253e-06
30.4926183.84750.000144
40.4349713.39720.000602
50.4220613.29640.000818
60.3978623.10740.001432
70.362062.82780.003166
80.3022942.3610.010719
90.2902122.26660.013485
100.3367362.630.005397
110.4791773.74250.000203
120.5608634.38052.4e-05
130.415983.24890.000943
140.2128361.66230.050792
150.0807560.63070.265289
160.0284570.22230.412429
170.0133860.10450.458539
18-0.004298-0.03360.486665
19-0.041698-0.32570.372892
20-0.097112-0.75850.225546
21-0.116861-0.91270.182493
22-0.084649-0.66110.25551
230.0296170.23130.408922
240.099940.78060.219042
250.0064160.05010.4801
26-0.135997-1.06220.146173
27-0.226177-1.76650.041158
28-0.26377-2.06010.021831
29-0.272342-2.12710.018734
30-0.282602-2.20720.015536
31-0.300415-2.34630.011113
32-0.334528-2.61270.005647
33-0.34713-2.71120.004348
34-0.320392-2.50230.007517
35-0.23565-1.84050.035281
36-0.170162-1.3290.094398
37-0.213651-1.66870.050154
38-0.279457-2.18260.016461
39-0.312766-2.44280.008743
40-0.305995-2.38990.009979
41-0.285905-2.2330.014615
42-0.268142-2.09430.0202
43-0.251955-1.96780.026819
44-0.250669-1.95780.027417
45-0.239586-1.87120.033056
46-0.212781-1.66190.050835
47-0.149765-1.16970.123336
48-0.096462-0.75340.227057
49-0.096985-0.75750.225841
50-0.108473-0.84720.200097
51-0.111927-0.87420.192726
52-0.091396-0.71380.23903
53-0.078727-0.61490.27046
54-0.066705-0.5210.302133
55-0.064335-0.50250.308572
56-0.066746-0.52130.30202
57-0.065682-0.5130.304904
58-0.057741-0.4510.326805
59-0.031739-0.24790.402528
60-0.011236-0.08780.46518

\begin{tabular}{lllllllll}
\hline
Autocorrelation Function \tabularnewline
Time lag k & ACF(k) & T-STAT & P-value \tabularnewline
1 & 0.850979 & 6.6464 & 0 \tabularnewline
2 & 0.635387 & 4.9625 & 3e-06 \tabularnewline
3 & 0.492618 & 3.8475 & 0.000144 \tabularnewline
4 & 0.434971 & 3.3972 & 0.000602 \tabularnewline
5 & 0.422061 & 3.2964 & 0.000818 \tabularnewline
6 & 0.397862 & 3.1074 & 0.001432 \tabularnewline
7 & 0.36206 & 2.8278 & 0.003166 \tabularnewline
8 & 0.302294 & 2.361 & 0.010719 \tabularnewline
9 & 0.290212 & 2.2666 & 0.013485 \tabularnewline
10 & 0.336736 & 2.63 & 0.005397 \tabularnewline
11 & 0.479177 & 3.7425 & 0.000203 \tabularnewline
12 & 0.560863 & 4.3805 & 2.4e-05 \tabularnewline
13 & 0.41598 & 3.2489 & 0.000943 \tabularnewline
14 & 0.212836 & 1.6623 & 0.050792 \tabularnewline
15 & 0.080756 & 0.6307 & 0.265289 \tabularnewline
16 & 0.028457 & 0.2223 & 0.412429 \tabularnewline
17 & 0.013386 & 0.1045 & 0.458539 \tabularnewline
18 & -0.004298 & -0.0336 & 0.486665 \tabularnewline
19 & -0.041698 & -0.3257 & 0.372892 \tabularnewline
20 & -0.097112 & -0.7585 & 0.225546 \tabularnewline
21 & -0.116861 & -0.9127 & 0.182493 \tabularnewline
22 & -0.084649 & -0.6611 & 0.25551 \tabularnewline
23 & 0.029617 & 0.2313 & 0.408922 \tabularnewline
24 & 0.09994 & 0.7806 & 0.219042 \tabularnewline
25 & 0.006416 & 0.0501 & 0.4801 \tabularnewline
26 & -0.135997 & -1.0622 & 0.146173 \tabularnewline
27 & -0.226177 & -1.7665 & 0.041158 \tabularnewline
28 & -0.26377 & -2.0601 & 0.021831 \tabularnewline
29 & -0.272342 & -2.1271 & 0.018734 \tabularnewline
30 & -0.282602 & -2.2072 & 0.015536 \tabularnewline
31 & -0.300415 & -2.3463 & 0.011113 \tabularnewline
32 & -0.334528 & -2.6127 & 0.005647 \tabularnewline
33 & -0.34713 & -2.7112 & 0.004348 \tabularnewline
34 & -0.320392 & -2.5023 & 0.007517 \tabularnewline
35 & -0.23565 & -1.8405 & 0.035281 \tabularnewline
36 & -0.170162 & -1.329 & 0.094398 \tabularnewline
37 & -0.213651 & -1.6687 & 0.050154 \tabularnewline
38 & -0.279457 & -2.1826 & 0.016461 \tabularnewline
39 & -0.312766 & -2.4428 & 0.008743 \tabularnewline
40 & -0.305995 & -2.3899 & 0.009979 \tabularnewline
41 & -0.285905 & -2.233 & 0.014615 \tabularnewline
42 & -0.268142 & -2.0943 & 0.0202 \tabularnewline
43 & -0.251955 & -1.9678 & 0.026819 \tabularnewline
44 & -0.250669 & -1.9578 & 0.027417 \tabularnewline
45 & -0.239586 & -1.8712 & 0.033056 \tabularnewline
46 & -0.212781 & -1.6619 & 0.050835 \tabularnewline
47 & -0.149765 & -1.1697 & 0.123336 \tabularnewline
48 & -0.096462 & -0.7534 & 0.227057 \tabularnewline
49 & -0.096985 & -0.7575 & 0.225841 \tabularnewline
50 & -0.108473 & -0.8472 & 0.200097 \tabularnewline
51 & -0.111927 & -0.8742 & 0.192726 \tabularnewline
52 & -0.091396 & -0.7138 & 0.23903 \tabularnewline
53 & -0.078727 & -0.6149 & 0.27046 \tabularnewline
54 & -0.066705 & -0.521 & 0.302133 \tabularnewline
55 & -0.064335 & -0.5025 & 0.308572 \tabularnewline
56 & -0.066746 & -0.5213 & 0.30202 \tabularnewline
57 & -0.065682 & -0.513 & 0.304904 \tabularnewline
58 & -0.057741 & -0.451 & 0.326805 \tabularnewline
59 & -0.031739 & -0.2479 & 0.402528 \tabularnewline
60 & -0.011236 & -0.0878 & 0.46518 \tabularnewline
\hline
\end{tabular}
%Source: https://freestatistics.org/blog/index.php?pk=28779&T=1

[TABLE]
[ROW][C]Autocorrelation Function[/C][/ROW]
[ROW][C]Time lag k[/C][C]ACF(k)[/C][C]T-STAT[/C][C]P-value[/C][/ROW]
[ROW][C]1[/C][C]0.850979[/C][C]6.6464[/C][C]0[/C][/ROW]
[ROW][C]2[/C][C]0.635387[/C][C]4.9625[/C][C]3e-06[/C][/ROW]
[ROW][C]3[/C][C]0.492618[/C][C]3.8475[/C][C]0.000144[/C][/ROW]
[ROW][C]4[/C][C]0.434971[/C][C]3.3972[/C][C]0.000602[/C][/ROW]
[ROW][C]5[/C][C]0.422061[/C][C]3.2964[/C][C]0.000818[/C][/ROW]
[ROW][C]6[/C][C]0.397862[/C][C]3.1074[/C][C]0.001432[/C][/ROW]
[ROW][C]7[/C][C]0.36206[/C][C]2.8278[/C][C]0.003166[/C][/ROW]
[ROW][C]8[/C][C]0.302294[/C][C]2.361[/C][C]0.010719[/C][/ROW]
[ROW][C]9[/C][C]0.290212[/C][C]2.2666[/C][C]0.013485[/C][/ROW]
[ROW][C]10[/C][C]0.336736[/C][C]2.63[/C][C]0.005397[/C][/ROW]
[ROW][C]11[/C][C]0.479177[/C][C]3.7425[/C][C]0.000203[/C][/ROW]
[ROW][C]12[/C][C]0.560863[/C][C]4.3805[/C][C]2.4e-05[/C][/ROW]
[ROW][C]13[/C][C]0.41598[/C][C]3.2489[/C][C]0.000943[/C][/ROW]
[ROW][C]14[/C][C]0.212836[/C][C]1.6623[/C][C]0.050792[/C][/ROW]
[ROW][C]15[/C][C]0.080756[/C][C]0.6307[/C][C]0.265289[/C][/ROW]
[ROW][C]16[/C][C]0.028457[/C][C]0.2223[/C][C]0.412429[/C][/ROW]
[ROW][C]17[/C][C]0.013386[/C][C]0.1045[/C][C]0.458539[/C][/ROW]
[ROW][C]18[/C][C]-0.004298[/C][C]-0.0336[/C][C]0.486665[/C][/ROW]
[ROW][C]19[/C][C]-0.041698[/C][C]-0.3257[/C][C]0.372892[/C][/ROW]
[ROW][C]20[/C][C]-0.097112[/C][C]-0.7585[/C][C]0.225546[/C][/ROW]
[ROW][C]21[/C][C]-0.116861[/C][C]-0.9127[/C][C]0.182493[/C][/ROW]
[ROW][C]22[/C][C]-0.084649[/C][C]-0.6611[/C][C]0.25551[/C][/ROW]
[ROW][C]23[/C][C]0.029617[/C][C]0.2313[/C][C]0.408922[/C][/ROW]
[ROW][C]24[/C][C]0.09994[/C][C]0.7806[/C][C]0.219042[/C][/ROW]
[ROW][C]25[/C][C]0.006416[/C][C]0.0501[/C][C]0.4801[/C][/ROW]
[ROW][C]26[/C][C]-0.135997[/C][C]-1.0622[/C][C]0.146173[/C][/ROW]
[ROW][C]27[/C][C]-0.226177[/C][C]-1.7665[/C][C]0.041158[/C][/ROW]
[ROW][C]28[/C][C]-0.26377[/C][C]-2.0601[/C][C]0.021831[/C][/ROW]
[ROW][C]29[/C][C]-0.272342[/C][C]-2.1271[/C][C]0.018734[/C][/ROW]
[ROW][C]30[/C][C]-0.282602[/C][C]-2.2072[/C][C]0.015536[/C][/ROW]
[ROW][C]31[/C][C]-0.300415[/C][C]-2.3463[/C][C]0.011113[/C][/ROW]
[ROW][C]32[/C][C]-0.334528[/C][C]-2.6127[/C][C]0.005647[/C][/ROW]
[ROW][C]33[/C][C]-0.34713[/C][C]-2.7112[/C][C]0.004348[/C][/ROW]
[ROW][C]34[/C][C]-0.320392[/C][C]-2.5023[/C][C]0.007517[/C][/ROW]
[ROW][C]35[/C][C]-0.23565[/C][C]-1.8405[/C][C]0.035281[/C][/ROW]
[ROW][C]36[/C][C]-0.170162[/C][C]-1.329[/C][C]0.094398[/C][/ROW]
[ROW][C]37[/C][C]-0.213651[/C][C]-1.6687[/C][C]0.050154[/C][/ROW]
[ROW][C]38[/C][C]-0.279457[/C][C]-2.1826[/C][C]0.016461[/C][/ROW]
[ROW][C]39[/C][C]-0.312766[/C][C]-2.4428[/C][C]0.008743[/C][/ROW]
[ROW][C]40[/C][C]-0.305995[/C][C]-2.3899[/C][C]0.009979[/C][/ROW]
[ROW][C]41[/C][C]-0.285905[/C][C]-2.233[/C][C]0.014615[/C][/ROW]
[ROW][C]42[/C][C]-0.268142[/C][C]-2.0943[/C][C]0.0202[/C][/ROW]
[ROW][C]43[/C][C]-0.251955[/C][C]-1.9678[/C][C]0.026819[/C][/ROW]
[ROW][C]44[/C][C]-0.250669[/C][C]-1.9578[/C][C]0.027417[/C][/ROW]
[ROW][C]45[/C][C]-0.239586[/C][C]-1.8712[/C][C]0.033056[/C][/ROW]
[ROW][C]46[/C][C]-0.212781[/C][C]-1.6619[/C][C]0.050835[/C][/ROW]
[ROW][C]47[/C][C]-0.149765[/C][C]-1.1697[/C][C]0.123336[/C][/ROW]
[ROW][C]48[/C][C]-0.096462[/C][C]-0.7534[/C][C]0.227057[/C][/ROW]
[ROW][C]49[/C][C]-0.096985[/C][C]-0.7575[/C][C]0.225841[/C][/ROW]
[ROW][C]50[/C][C]-0.108473[/C][C]-0.8472[/C][C]0.200097[/C][/ROW]
[ROW][C]51[/C][C]-0.111927[/C][C]-0.8742[/C][C]0.192726[/C][/ROW]
[ROW][C]52[/C][C]-0.091396[/C][C]-0.7138[/C][C]0.23903[/C][/ROW]
[ROW][C]53[/C][C]-0.078727[/C][C]-0.6149[/C][C]0.27046[/C][/ROW]
[ROW][C]54[/C][C]-0.066705[/C][C]-0.521[/C][C]0.302133[/C][/ROW]
[ROW][C]55[/C][C]-0.064335[/C][C]-0.5025[/C][C]0.308572[/C][/ROW]
[ROW][C]56[/C][C]-0.066746[/C][C]-0.5213[/C][C]0.30202[/C][/ROW]
[ROW][C]57[/C][C]-0.065682[/C][C]-0.513[/C][C]0.304904[/C][/ROW]
[ROW][C]58[/C][C]-0.057741[/C][C]-0.451[/C][C]0.326805[/C][/ROW]
[ROW][C]59[/C][C]-0.031739[/C][C]-0.2479[/C][C]0.402528[/C][/ROW]
[ROW][C]60[/C][C]-0.011236[/C][C]-0.0878[/C][C]0.46518[/C][/ROW]
[/TABLE]
Source: https://freestatistics.org/blog/index.php?pk=28779&T=1

Globally Unique Identifier (entire table): ba.freestatistics.org/blog/index.php?pk=28779&T=1

As an alternative you can also use a QR Code:  

The GUIDs for individual cells are displayed in the table below:

Autocorrelation Function
Time lag kACF(k)T-STATP-value
10.8509796.64640
20.6353874.96253e-06
30.4926183.84750.000144
40.4349713.39720.000602
50.4220613.29640.000818
60.3978623.10740.001432
70.362062.82780.003166
80.3022942.3610.010719
90.2902122.26660.013485
100.3367362.630.005397
110.4791773.74250.000203
120.5608634.38052.4e-05
130.415983.24890.000943
140.2128361.66230.050792
150.0807560.63070.265289
160.0284570.22230.412429
170.0133860.10450.458539
18-0.004298-0.03360.486665
19-0.041698-0.32570.372892
20-0.097112-0.75850.225546
21-0.116861-0.91270.182493
22-0.084649-0.66110.25551
230.0296170.23130.408922
240.099940.78060.219042
250.0064160.05010.4801
26-0.135997-1.06220.146173
27-0.226177-1.76650.041158
28-0.26377-2.06010.021831
29-0.272342-2.12710.018734
30-0.282602-2.20720.015536
31-0.300415-2.34630.011113
32-0.334528-2.61270.005647
33-0.34713-2.71120.004348
34-0.320392-2.50230.007517
35-0.23565-1.84050.035281
36-0.170162-1.3290.094398
37-0.213651-1.66870.050154
38-0.279457-2.18260.016461
39-0.312766-2.44280.008743
40-0.305995-2.38990.009979
41-0.285905-2.2330.014615
42-0.268142-2.09430.0202
43-0.251955-1.96780.026819
44-0.250669-1.95780.027417
45-0.239586-1.87120.033056
46-0.212781-1.66190.050835
47-0.149765-1.16970.123336
48-0.096462-0.75340.227057
49-0.096985-0.75750.225841
50-0.108473-0.84720.200097
51-0.111927-0.87420.192726
52-0.091396-0.71380.23903
53-0.078727-0.61490.27046
54-0.066705-0.5210.302133
55-0.064335-0.50250.308572
56-0.066746-0.52130.30202
57-0.065682-0.5130.304904
58-0.057741-0.4510.326805
59-0.031739-0.24790.402528
60-0.011236-0.08780.46518


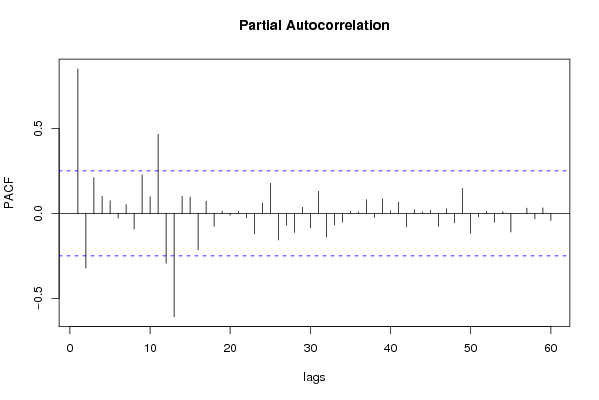
Partial Autocorrelation Function
Time lag kPACF(k)T-STATP-value
10.8509796.64640
2-0.321855-2.51380.0073
30.2094181.63560.053536
40.0998450.77980.219259
50.0740910.57870.282471
6-0.02757-0.21530.415116
70.0518360.40490.3435
8-0.092606-0.72330.236137
90.2275131.77690.040283
100.0974050.76080.224866
110.4660233.63980.000282
12-0.294016-2.29630.012553
13-0.608435-4.7526e-06
140.1000490.78140.218793
150.0958090.74830.22858
16-0.215232-1.6810.048937
170.0716970.560.288776
18-0.076209-0.59520.276953
190.0138210.10790.457198
20-0.010461-0.08170.467576
210.0124090.09690.461556
22-0.026213-0.20470.419233
23-0.12044-0.94070.175294
240.0607730.47470.318364
250.1769941.38240.08595
26-0.156588-1.2230.113018
27-0.07007-0.54730.293098
28-0.112623-0.87960.191261
290.0357990.27960.390365
30-0.085321-0.66640.25384
310.1299921.01530.156994
32-0.138914-1.0850.141105
33-0.067731-0.5290.299364
34-0.05129-0.40060.345062
350.0122460.09560.46206
360.0087990.06870.472717
370.0807090.63040.265408
38-0.024237-0.18930.425243
390.0859310.67110.252332
400.0166480.130.448489
410.0660320.51570.303955
42-0.079826-0.62350.267654
430.0220880.17250.431802
440.0084650.06610.473752
450.0184870.14440.442835
46-0.076286-0.59580.276752
470.0271220.21180.416474
48-0.054839-0.42830.33497
490.1466481.14540.128267
50-0.118888-0.92850.178392
51-0.020131-0.15720.437791
520.0115950.09060.46407
53-0.052064-0.40660.342851
540.0097660.07630.469724
55-0.109358-0.85410.198193
56-0.000588-0.00460.498174
570.031020.24230.40469
58-0.03227-0.2520.400931
590.0324650.25360.400346
60-0.041995-0.3280.372021

\begin{tabular}{lllllllll}
\hline
Partial Autocorrelation Function \tabularnewline
Time lag k & PACF(k) & T-STAT & P-value \tabularnewline
1 & 0.850979 & 6.6464 & 0 \tabularnewline
2 & -0.321855 & -2.5138 & 0.0073 \tabularnewline
3 & 0.209418 & 1.6356 & 0.053536 \tabularnewline
4 & 0.099845 & 0.7798 & 0.219259 \tabularnewline
5 & 0.074091 & 0.5787 & 0.282471 \tabularnewline
6 & -0.02757 & -0.2153 & 0.415116 \tabularnewline
7 & 0.051836 & 0.4049 & 0.3435 \tabularnewline
8 & -0.092606 & -0.7233 & 0.236137 \tabularnewline
9 & 0.227513 & 1.7769 & 0.040283 \tabularnewline
10 & 0.097405 & 0.7608 & 0.224866 \tabularnewline
11 & 0.466023 & 3.6398 & 0.000282 \tabularnewline
12 & -0.294016 & -2.2963 & 0.012553 \tabularnewline
13 & -0.608435 & -4.752 & 6e-06 \tabularnewline
14 & 0.100049 & 0.7814 & 0.218793 \tabularnewline
15 & 0.095809 & 0.7483 & 0.22858 \tabularnewline
16 & -0.215232 & -1.681 & 0.048937 \tabularnewline
17 & 0.071697 & 0.56 & 0.288776 \tabularnewline
18 & -0.076209 & -0.5952 & 0.276953 \tabularnewline
19 & 0.013821 & 0.1079 & 0.457198 \tabularnewline
20 & -0.010461 & -0.0817 & 0.467576 \tabularnewline
21 & 0.012409 & 0.0969 & 0.461556 \tabularnewline
22 & -0.026213 & -0.2047 & 0.419233 \tabularnewline
23 & -0.12044 & -0.9407 & 0.175294 \tabularnewline
24 & 0.060773 & 0.4747 & 0.318364 \tabularnewline
25 & 0.176994 & 1.3824 & 0.08595 \tabularnewline
26 & -0.156588 & -1.223 & 0.113018 \tabularnewline
27 & -0.07007 & -0.5473 & 0.293098 \tabularnewline
28 & -0.112623 & -0.8796 & 0.191261 \tabularnewline
29 & 0.035799 & 0.2796 & 0.390365 \tabularnewline
30 & -0.085321 & -0.6664 & 0.25384 \tabularnewline
31 & 0.129992 & 1.0153 & 0.156994 \tabularnewline
32 & -0.138914 & -1.085 & 0.141105 \tabularnewline
33 & -0.067731 & -0.529 & 0.299364 \tabularnewline
34 & -0.05129 & -0.4006 & 0.345062 \tabularnewline
35 & 0.012246 & 0.0956 & 0.46206 \tabularnewline
36 & 0.008799 & 0.0687 & 0.472717 \tabularnewline
37 & 0.080709 & 0.6304 & 0.265408 \tabularnewline
38 & -0.024237 & -0.1893 & 0.425243 \tabularnewline
39 & 0.085931 & 0.6711 & 0.252332 \tabularnewline
40 & 0.016648 & 0.13 & 0.448489 \tabularnewline
41 & 0.066032 & 0.5157 & 0.303955 \tabularnewline
42 & -0.079826 & -0.6235 & 0.267654 \tabularnewline
43 & 0.022088 & 0.1725 & 0.431802 \tabularnewline
44 & 0.008465 & 0.0661 & 0.473752 \tabularnewline
45 & 0.018487 & 0.1444 & 0.442835 \tabularnewline
46 & -0.076286 & -0.5958 & 0.276752 \tabularnewline
47 & 0.027122 & 0.2118 & 0.416474 \tabularnewline
48 & -0.054839 & -0.4283 & 0.33497 \tabularnewline
49 & 0.146648 & 1.1454 & 0.128267 \tabularnewline
50 & -0.118888 & -0.9285 & 0.178392 \tabularnewline
51 & -0.020131 & -0.1572 & 0.437791 \tabularnewline
52 & 0.011595 & 0.0906 & 0.46407 \tabularnewline
53 & -0.052064 & -0.4066 & 0.342851 \tabularnewline
54 & 0.009766 & 0.0763 & 0.469724 \tabularnewline
55 & -0.109358 & -0.8541 & 0.198193 \tabularnewline
56 & -0.000588 & -0.0046 & 0.498174 \tabularnewline
57 & 0.03102 & 0.2423 & 0.40469 \tabularnewline
58 & -0.03227 & -0.252 & 0.400931 \tabularnewline
59 & 0.032465 & 0.2536 & 0.400346 \tabularnewline
60 & -0.041995 & -0.328 & 0.372021 \tabularnewline
\hline
\end{tabular}
%Source: https://freestatistics.org/blog/index.php?pk=28779&T=2

[TABLE]
[ROW][C]Partial Autocorrelation Function[/C][/ROW]
[ROW][C]Time lag k[/C][C]PACF(k)[/C][C]T-STAT[/C][C]P-value[/C][/ROW]
[ROW][C]1[/C][C]0.850979[/C][C]6.6464[/C][C]0[/C][/ROW]
[ROW][C]2[/C][C]-0.321855[/C][C]-2.5138[/C][C]0.0073[/C][/ROW]
[ROW][C]3[/C][C]0.209418[/C][C]1.6356[/C][C]0.053536[/C][/ROW]
[ROW][C]4[/C][C]0.099845[/C][C]0.7798[/C][C]0.219259[/C][/ROW]
[ROW][C]5[/C][C]0.074091[/C][C]0.5787[/C][C]0.282471[/C][/ROW]
[ROW][C]6[/C][C]-0.02757[/C][C]-0.2153[/C][C]0.415116[/C][/ROW]
[ROW][C]7[/C][C]0.051836[/C][C]0.4049[/C][C]0.3435[/C][/ROW]
[ROW][C]8[/C][C]-0.092606[/C][C]-0.7233[/C][C]0.236137[/C][/ROW]
[ROW][C]9[/C][C]0.227513[/C][C]1.7769[/C][C]0.040283[/C][/ROW]
[ROW][C]10[/C][C]0.097405[/C][C]0.7608[/C][C]0.224866[/C][/ROW]
[ROW][C]11[/C][C]0.466023[/C][C]3.6398[/C][C]0.000282[/C][/ROW]
[ROW][C]12[/C][C]-0.294016[/C][C]-2.2963[/C][C]0.012553[/C][/ROW]
[ROW][C]13[/C][C]-0.608435[/C][C]-4.752[/C][C]6e-06[/C][/ROW]
[ROW][C]14[/C][C]0.100049[/C][C]0.7814[/C][C]0.218793[/C][/ROW]
[ROW][C]15[/C][C]0.095809[/C][C]0.7483[/C][C]0.22858[/C][/ROW]
[ROW][C]16[/C][C]-0.215232[/C][C]-1.681[/C][C]0.048937[/C][/ROW]
[ROW][C]17[/C][C]0.071697[/C][C]0.56[/C][C]0.288776[/C][/ROW]
[ROW][C]18[/C][C]-0.076209[/C][C]-0.5952[/C][C]0.276953[/C][/ROW]
[ROW][C]19[/C][C]0.013821[/C][C]0.1079[/C][C]0.457198[/C][/ROW]
[ROW][C]20[/C][C]-0.010461[/C][C]-0.0817[/C][C]0.467576[/C][/ROW]
[ROW][C]21[/C][C]0.012409[/C][C]0.0969[/C][C]0.461556[/C][/ROW]
[ROW][C]22[/C][C]-0.026213[/C][C]-0.2047[/C][C]0.419233[/C][/ROW]
[ROW][C]23[/C][C]-0.12044[/C][C]-0.9407[/C][C]0.175294[/C][/ROW]
[ROW][C]24[/C][C]0.060773[/C][C]0.4747[/C][C]0.318364[/C][/ROW]
[ROW][C]25[/C][C]0.176994[/C][C]1.3824[/C][C]0.08595[/C][/ROW]
[ROW][C]26[/C][C]-0.156588[/C][C]-1.223[/C][C]0.113018[/C][/ROW]
[ROW][C]27[/C][C]-0.07007[/C][C]-0.5473[/C][C]0.293098[/C][/ROW]
[ROW][C]28[/C][C]-0.112623[/C][C]-0.8796[/C][C]0.191261[/C][/ROW]
[ROW][C]29[/C][C]0.035799[/C][C]0.2796[/C][C]0.390365[/C][/ROW]
[ROW][C]30[/C][C]-0.085321[/C][C]-0.6664[/C][C]0.25384[/C][/ROW]
[ROW][C]31[/C][C]0.129992[/C][C]1.0153[/C][C]0.156994[/C][/ROW]
[ROW][C]32[/C][C]-0.138914[/C][C]-1.085[/C][C]0.141105[/C][/ROW]
[ROW][C]33[/C][C]-0.067731[/C][C]-0.529[/C][C]0.299364[/C][/ROW]
[ROW][C]34[/C][C]-0.05129[/C][C]-0.4006[/C][C]0.345062[/C][/ROW]
[ROW][C]35[/C][C]0.012246[/C][C]0.0956[/C][C]0.46206[/C][/ROW]
[ROW][C]36[/C][C]0.008799[/C][C]0.0687[/C][C]0.472717[/C][/ROW]
[ROW][C]37[/C][C]0.080709[/C][C]0.6304[/C][C]0.265408[/C][/ROW]
[ROW][C]38[/C][C]-0.024237[/C][C]-0.1893[/C][C]0.425243[/C][/ROW]
[ROW][C]39[/C][C]0.085931[/C][C]0.6711[/C][C]0.252332[/C][/ROW]
[ROW][C]40[/C][C]0.016648[/C][C]0.13[/C][C]0.448489[/C][/ROW]
[ROW][C]41[/C][C]0.066032[/C][C]0.5157[/C][C]0.303955[/C][/ROW]
[ROW][C]42[/C][C]-0.079826[/C][C]-0.6235[/C][C]0.267654[/C][/ROW]
[ROW][C]43[/C][C]0.022088[/C][C]0.1725[/C][C]0.431802[/C][/ROW]
[ROW][C]44[/C][C]0.008465[/C][C]0.0661[/C][C]0.473752[/C][/ROW]
[ROW][C]45[/C][C]0.018487[/C][C]0.1444[/C][C]0.442835[/C][/ROW]
[ROW][C]46[/C][C]-0.076286[/C][C]-0.5958[/C][C]0.276752[/C][/ROW]
[ROW][C]47[/C][C]0.027122[/C][C]0.2118[/C][C]0.416474[/C][/ROW]
[ROW][C]48[/C][C]-0.054839[/C][C]-0.4283[/C][C]0.33497[/C][/ROW]
[ROW][C]49[/C][C]0.146648[/C][C]1.1454[/C][C]0.128267[/C][/ROW]
[ROW][C]50[/C][C]-0.118888[/C][C]-0.9285[/C][C]0.178392[/C][/ROW]
[ROW][C]51[/C][C]-0.020131[/C][C]-0.1572[/C][C]0.437791[/C][/ROW]
[ROW][C]52[/C][C]0.011595[/C][C]0.0906[/C][C]0.46407[/C][/ROW]
[ROW][C]53[/C][C]-0.052064[/C][C]-0.4066[/C][C]0.342851[/C][/ROW]
[ROW][C]54[/C][C]0.009766[/C][C]0.0763[/C][C]0.469724[/C][/ROW]
[ROW][C]55[/C][C]-0.109358[/C][C]-0.8541[/C][C]0.198193[/C][/ROW]
[ROW][C]56[/C][C]-0.000588[/C][C]-0.0046[/C][C]0.498174[/C][/ROW]
[ROW][C]57[/C][C]0.03102[/C][C]0.2423[/C][C]0.40469[/C][/ROW]
[ROW][C]58[/C][C]-0.03227[/C][C]-0.252[/C][C]0.400931[/C][/ROW]
[ROW][C]59[/C][C]0.032465[/C][C]0.2536[/C][C]0.400346[/C][/ROW]
[ROW][C]60[/C][C]-0.041995[/C][C]-0.328[/C][C]0.372021[/C][/ROW]
[/TABLE]
Source: https://freestatistics.org/blog/index.php?pk=28779&T=2

Globally Unique Identifier (entire table): ba.freestatistics.org/blog/index.php?pk=28779&T=2

As an alternative you can also use a QR Code:  

The GUIDs for individual cells are displayed in the table below:

Partial Autocorrelation Function
Time lag kPACF(k)T-STATP-value
10.8509796.64640
2-0.321855-2.51380.0073
30.2094181.63560.053536
40.0998450.77980.219259
50.0740910.57870.282471
6-0.02757-0.21530.415116
70.0518360.40490.3435
8-0.092606-0.72330.236137
90.2275131.77690.040283
100.0974050.76080.224866
110.4660233.63980.000282
12-0.294016-2.29630.012553
13-0.608435-4.7526e-06
140.1000490.78140.218793
150.0958090.74830.22858
16-0.215232-1.6810.048937
170.0716970.560.288776
18-0.076209-0.59520.276953
190.0138210.10790.457198
20-0.010461-0.08170.467576
210.0124090.09690.461556
22-0.026213-0.20470.419233
23-0.12044-0.94070.175294
240.0607730.47470.318364
250.1769941.38240.08595
26-0.156588-1.2230.113018
27-0.07007-0.54730.293098
28-0.112623-0.87960.191261
290.0357990.27960.390365
30-0.085321-0.66640.25384
310.1299921.01530.156994
32-0.138914-1.0850.141105
33-0.067731-0.5290.299364
34-0.05129-0.40060.345062
350.0122460.09560.46206
360.0087990.06870.472717
370.0807090.63040.265408
38-0.024237-0.18930.425243
390.0859310.67110.252332
400.0166480.130.448489
410.0660320.51570.303955
42-0.079826-0.62350.267654
430.0220880.17250.431802
440.0084650.06610.473752
450.0184870.14440.442835
46-0.076286-0.59580.276752
470.0271220.21180.416474
48-0.054839-0.42830.33497
490.1466481.14540.128267
50-0.118888-0.92850.178392
51-0.020131-0.15720.437791
520.0115950.09060.46407
53-0.052064-0.40660.342851
540.0097660.07630.469724
55-0.109358-0.85410.198193
56-0.000588-0.00460.498174
570.031020.24230.40469
58-0.03227-0.2520.400931
590.0324650.25360.400346
60-0.041995-0.3280.372021


Parameters (Session):
par1 = 60 ; par2 = 1 ; par3 = 0 ; par4 = 0 ; par5 = 12 ;
Parameters (R input):
par1 = 60 ; par2 = 1 ; par3 = 0 ; par4 = 0 ; par5 = 12 ;
R code (references can be found in the software module):
if (par1 == 'Default') {
par1 = 10*log10(length(x))
} else {
par1 <- as.numeric(par1)
}
par2 <- as.numeric(par2)
par3 <- as.numeric(par3)
par4 <- as.numeric(par4)
par5 <- as.numeric(par5)
if (par2 == 0) {
x <- log(x)
} else {
x <- (x ^ par2 - 1) / par2
}
if (par3 > 0) x <- diff(x,lag=1,difference=par3)
if (par4 > 0) x <- diff(x,lag=par5,difference=par4)
bitmap(file='pic1.png')
racf <- acf(x,par1,main='Autocorrelation',xlab='lags',ylab='ACF')
dev.off()
bitmap(file='pic2.png')
rpacf <- pacf(x,par1,main='Partial Autocorrelation',xlab='lags',ylab='PACF')
dev.off()
(myacf <- c(racf$acf))
(mypacf <- c(rpacf$acf))
lengthx <- length(x)
sqrtn <- sqrt(lengthx)
load(file='createtable')
a<-table.start()
a<-table.row.start(a)
a<-table.element(a,'Autocorrelation Function',4,TRUE)
a<-table.row.end(a)
a<-table.row.start(a)
a<-table.element(a,'Time lag k',header=TRUE)
a<-table.element(a,hyperlink('basics.htm','ACF(k)','click here for more information about the Autocorrelation Function'),header=TRUE)
a<-table.element(a,'T-STAT',header=TRUE)
a<-table.element(a,'P-value',header=TRUE)
a<-table.row.end(a)
for (i in 2:(par1+1)) {
a<-table.row.start(a)
a<-table.element(a,i-1,header=TRUE)
a<-table.element(a,round(myacf[i],6))
mytstat <- myacf[i]*sqrtn
a<-table.element(a,round(mytstat,4))
a<-table.element(a,round(1-pt(abs(mytstat),lengthx),6))
a<-table.row.end(a)
}
a<-table.end(a)
table.save(a,file='mytable.tab')
a<-table.start()
a<-table.row.start(a)
a<-table.element(a,'Partial Autocorrelation Function',4,TRUE)
a<-table.row.end(a)
a<-table.row.start(a)
a<-table.element(a,'Time lag k',header=TRUE)
a<-table.element(a,hyperlink('basics.htm','PACF(k)','click here for more information about the Partial Autocorrelation Function'),header=TRUE)
a<-table.element(a,'T-STAT',header=TRUE)
a<-table.element(a,'P-value',header=TRUE)
a<-table.row.end(a)
for (i in 1:par1) {
a<-table.row.start(a)
a<-table.element(a,i,header=TRUE)
a<-table.element(a,round(mypacf[i],6))
mytstat <- mypacf[i]*sqrtn
a<-table.element(a,round(mytstat,4))
a<-table.element(a,round(1-pt(abs(mytstat),lengthx),6))
a<-table.row.end(a)
}
a<-table.end(a)
table.save(a,file='mytable1.tab')