Free Statistics

of Irreproducible Research!

Author's title

Author*The author of this computation has been verified*
R Software Modulerwasp_autocorrelation.wasp
Title produced by software(Partial) Autocorrelation Function
Date of computationWed, 03 Dec 2008 09:05:19 -0700
Cite this page as followsStatistical Computations at FreeStatistics.org, Office for Research Development and Education, URL https://freestatistics.org/blog/index.php?v=date/2008/Dec/03/t1228320471nhn0be5c1l0upg6.htm/, Retrieved Fri, 17 May 2024 03:20:29 +0000
Statistical Computations at FreeStatistics.org, Office for Research Development and Education, URL https://freestatistics.org/blog/index.php?pk=28762, Retrieved Fri, 17 May 2024 03:20:29 +0000
QR Codes:

Original text written by user:
IsPrivate?No (this computation is public)
User-defined keywords
Estimated Impact216
Family? (F = Feedback message, R = changed R code, M = changed R Module, P = changed Parameters, D = changed Data)
-     [Univariate Data Series] [Uitvoer.Nederland] [2008-12-03 15:11:10] [988ab43f527fc78aae41c84649095267]
-   P   [Univariate Data Series] [Export From Belgi...] [2008-12-03 15:52:29] [988ab43f527fc78aae41c84649095267]
- RMP       [(Partial) Autocorrelation Function] [Partial Autocorre...] [2008-12-03 16:05:19] [5d823194959040fa9b19b8c8302177e6] [Current]
Feedback Forum

Post a new message
Dataseries X:
2236
2084.9
2409.5
2199.3
2203.5
2254.1
1975.8
1742.2
2520.6
2438.1
2126.3
2267.5
2201.1
2128.5
2596
2458.2
2210.5
2621.2
2231.4
2103.6
2685.8
2539.3
2462.4
2693.3
2307.7
2385.9
2737.6
2653.9
2545.4
2848.8
2359.5
2488.3
2861.1
2717.9
2844
2749
2652.9
2660.2
3187.1
2774.1
3158.2
3244.6
2665.5
2820.8
2983.4
3077.4
3024.8
2731.8
3046.2
2834.8
3292.8
2946.1
3196.9
3284.2
3003
2979
3137.4
3630.2
3270.7
2942.3


Summary of computational transaction
Raw Inputview raw input (R code)
Raw Outputview raw output of R engine
Computing time2 seconds
R Server'Gwilym Jenkins' @ 72.249.127.135

\begin{tabular}{lllllllll}
\hline
Summary of computational transaction \tabularnewline
Raw Input & view raw input (R code)  \tabularnewline
Raw Output & view raw output of R engine  \tabularnewline
Computing time & 2 seconds \tabularnewline
R Server & 'Gwilym Jenkins' @ 72.249.127.135 \tabularnewline
\hline
\end{tabular}
%Source: https://freestatistics.org/blog/index.php?pk=28762&T=0

[TABLE]
[ROW][C]Summary of computational transaction[/C][/ROW]
[ROW][C]Raw Input[/C][C]view raw input (R code) [/C][/ROW]
[ROW][C]Raw Output[/C][C]view raw output of R engine [/C][/ROW]
[ROW][C]Computing time[/C][C]2 seconds[/C][/ROW]
[ROW][C]R Server[/C][C]'Gwilym Jenkins' @ 72.249.127.135[/C][/ROW]
[/TABLE]
Source: https://freestatistics.org/blog/index.php?pk=28762&T=0

Globally Unique Identifier (entire table): ba.freestatistics.org/blog/index.php?pk=28762&T=0

As an alternative you can also use a QR Code:  

The GUIDs for individual cells are displayed in the table below:

Summary of computational transaction
Raw Inputview raw input (R code)
Raw Outputview raw output of R engine
Computing time2 seconds
R Server'Gwilym Jenkins' @ 72.249.127.135


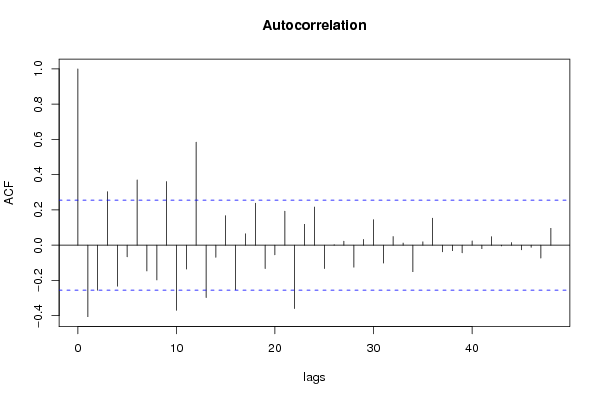
Autocorrelation Function
Time lag kACF(k)T-STATP-value
1-0.405251-3.11280.001428
2-0.25522-1.96040.027339
30.3034362.33070.011603
4-0.232515-1.7860.039621
5-0.06547-0.50290.308458
60.3703762.84490.003049
7-0.146117-1.12230.133132
8-0.197187-1.51460.067604
90.3610242.77310.003711
10-0.369326-2.83680.003117
11-0.135043-1.03730.151918
120.5843734.48871.7e-05
13-0.296954-2.28090.013089
14-0.068308-0.52470.300885
150.16761.28740.101499
16-0.2528-1.94180.028471
170.0645660.49590.31089
180.2385051.8320.036001
19-0.132537-1.0180.156408
20-0.054527-0.41880.338431
210.1932621.48450.071503
22-0.35922-2.75920.003852
230.1185850.91090.183035
240.2165031.6630.050809
25-0.132287-1.01610.156861
260.0028160.02160.491407
270.0231380.17770.429772
28-0.124593-0.9570.171232
290.0329860.25340.400432
300.144721.11160.135407
31-0.101324-0.77830.219755
320.0488840.37550.354322
330.012520.09620.461856
34-0.150366-1.1550.126377
350.0194440.14940.440892
360.1535451.17940.121487
37-0.037542-0.28840.38704
38-0.031342-0.24070.405295
39-0.043355-0.3330.370152
400.0245280.18840.425604
41-0.020035-0.15390.43911
420.0487340.37430.35475
43-0.004169-0.0320.487281
440.0150830.11590.45408
45-0.025815-0.19830.42175
46-0.011638-0.08940.464537
47-0.072751-0.55880.289202
480.095890.73650.232159

\begin{tabular}{lllllllll}
\hline
Autocorrelation Function \tabularnewline
Time lag k & ACF(k) & T-STAT & P-value \tabularnewline
1 & -0.405251 & -3.1128 & 0.001428 \tabularnewline
2 & -0.25522 & -1.9604 & 0.027339 \tabularnewline
3 & 0.303436 & 2.3307 & 0.011603 \tabularnewline
4 & -0.232515 & -1.786 & 0.039621 \tabularnewline
5 & -0.06547 & -0.5029 & 0.308458 \tabularnewline
6 & 0.370376 & 2.8449 & 0.003049 \tabularnewline
7 & -0.146117 & -1.1223 & 0.133132 \tabularnewline
8 & -0.197187 & -1.5146 & 0.067604 \tabularnewline
9 & 0.361024 & 2.7731 & 0.003711 \tabularnewline
10 & -0.369326 & -2.8368 & 0.003117 \tabularnewline
11 & -0.135043 & -1.0373 & 0.151918 \tabularnewline
12 & 0.584373 & 4.4887 & 1.7e-05 \tabularnewline
13 & -0.296954 & -2.2809 & 0.013089 \tabularnewline
14 & -0.068308 & -0.5247 & 0.300885 \tabularnewline
15 & 0.1676 & 1.2874 & 0.101499 \tabularnewline
16 & -0.2528 & -1.9418 & 0.028471 \tabularnewline
17 & 0.064566 & 0.4959 & 0.31089 \tabularnewline
18 & 0.238505 & 1.832 & 0.036001 \tabularnewline
19 & -0.132537 & -1.018 & 0.156408 \tabularnewline
20 & -0.054527 & -0.4188 & 0.338431 \tabularnewline
21 & 0.193262 & 1.4845 & 0.071503 \tabularnewline
22 & -0.35922 & -2.7592 & 0.003852 \tabularnewline
23 & 0.118585 & 0.9109 & 0.183035 \tabularnewline
24 & 0.216503 & 1.663 & 0.050809 \tabularnewline
25 & -0.132287 & -1.0161 & 0.156861 \tabularnewline
26 & 0.002816 & 0.0216 & 0.491407 \tabularnewline
27 & 0.023138 & 0.1777 & 0.429772 \tabularnewline
28 & -0.124593 & -0.957 & 0.171232 \tabularnewline
29 & 0.032986 & 0.2534 & 0.400432 \tabularnewline
30 & 0.14472 & 1.1116 & 0.135407 \tabularnewline
31 & -0.101324 & -0.7783 & 0.219755 \tabularnewline
32 & 0.048884 & 0.3755 & 0.354322 \tabularnewline
33 & 0.01252 & 0.0962 & 0.461856 \tabularnewline
34 & -0.150366 & -1.155 & 0.126377 \tabularnewline
35 & 0.019444 & 0.1494 & 0.440892 \tabularnewline
36 & 0.153545 & 1.1794 & 0.121487 \tabularnewline
37 & -0.037542 & -0.2884 & 0.38704 \tabularnewline
38 & -0.031342 & -0.2407 & 0.405295 \tabularnewline
39 & -0.043355 & -0.333 & 0.370152 \tabularnewline
40 & 0.024528 & 0.1884 & 0.425604 \tabularnewline
41 & -0.020035 & -0.1539 & 0.43911 \tabularnewline
42 & 0.048734 & 0.3743 & 0.35475 \tabularnewline
43 & -0.004169 & -0.032 & 0.487281 \tabularnewline
44 & 0.015083 & 0.1159 & 0.45408 \tabularnewline
45 & -0.025815 & -0.1983 & 0.42175 \tabularnewline
46 & -0.011638 & -0.0894 & 0.464537 \tabularnewline
47 & -0.072751 & -0.5588 & 0.289202 \tabularnewline
48 & 0.09589 & 0.7365 & 0.232159 \tabularnewline
\hline
\end{tabular}
%Source: https://freestatistics.org/blog/index.php?pk=28762&T=1

[TABLE]
[ROW][C]Autocorrelation Function[/C][/ROW]
[ROW][C]Time lag k[/C][C]ACF(k)[/C][C]T-STAT[/C][C]P-value[/C][/ROW]
[ROW][C]1[/C][C]-0.405251[/C][C]-3.1128[/C][C]0.001428[/C][/ROW]
[ROW][C]2[/C][C]-0.25522[/C][C]-1.9604[/C][C]0.027339[/C][/ROW]
[ROW][C]3[/C][C]0.303436[/C][C]2.3307[/C][C]0.011603[/C][/ROW]
[ROW][C]4[/C][C]-0.232515[/C][C]-1.786[/C][C]0.039621[/C][/ROW]
[ROW][C]5[/C][C]-0.06547[/C][C]-0.5029[/C][C]0.308458[/C][/ROW]
[ROW][C]6[/C][C]0.370376[/C][C]2.8449[/C][C]0.003049[/C][/ROW]
[ROW][C]7[/C][C]-0.146117[/C][C]-1.1223[/C][C]0.133132[/C][/ROW]
[ROW][C]8[/C][C]-0.197187[/C][C]-1.5146[/C][C]0.067604[/C][/ROW]
[ROW][C]9[/C][C]0.361024[/C][C]2.7731[/C][C]0.003711[/C][/ROW]
[ROW][C]10[/C][C]-0.369326[/C][C]-2.8368[/C][C]0.003117[/C][/ROW]
[ROW][C]11[/C][C]-0.135043[/C][C]-1.0373[/C][C]0.151918[/C][/ROW]
[ROW][C]12[/C][C]0.584373[/C][C]4.4887[/C][C]1.7e-05[/C][/ROW]
[ROW][C]13[/C][C]-0.296954[/C][C]-2.2809[/C][C]0.013089[/C][/ROW]
[ROW][C]14[/C][C]-0.068308[/C][C]-0.5247[/C][C]0.300885[/C][/ROW]
[ROW][C]15[/C][C]0.1676[/C][C]1.2874[/C][C]0.101499[/C][/ROW]
[ROW][C]16[/C][C]-0.2528[/C][C]-1.9418[/C][C]0.028471[/C][/ROW]
[ROW][C]17[/C][C]0.064566[/C][C]0.4959[/C][C]0.31089[/C][/ROW]
[ROW][C]18[/C][C]0.238505[/C][C]1.832[/C][C]0.036001[/C][/ROW]
[ROW][C]19[/C][C]-0.132537[/C][C]-1.018[/C][C]0.156408[/C][/ROW]
[ROW][C]20[/C][C]-0.054527[/C][C]-0.4188[/C][C]0.338431[/C][/ROW]
[ROW][C]21[/C][C]0.193262[/C][C]1.4845[/C][C]0.071503[/C][/ROW]
[ROW][C]22[/C][C]-0.35922[/C][C]-2.7592[/C][C]0.003852[/C][/ROW]
[ROW][C]23[/C][C]0.118585[/C][C]0.9109[/C][C]0.183035[/C][/ROW]
[ROW][C]24[/C][C]0.216503[/C][C]1.663[/C][C]0.050809[/C][/ROW]
[ROW][C]25[/C][C]-0.132287[/C][C]-1.0161[/C][C]0.156861[/C][/ROW]
[ROW][C]26[/C][C]0.002816[/C][C]0.0216[/C][C]0.491407[/C][/ROW]
[ROW][C]27[/C][C]0.023138[/C][C]0.1777[/C][C]0.429772[/C][/ROW]
[ROW][C]28[/C][C]-0.124593[/C][C]-0.957[/C][C]0.171232[/C][/ROW]
[ROW][C]29[/C][C]0.032986[/C][C]0.2534[/C][C]0.400432[/C][/ROW]
[ROW][C]30[/C][C]0.14472[/C][C]1.1116[/C][C]0.135407[/C][/ROW]
[ROW][C]31[/C][C]-0.101324[/C][C]-0.7783[/C][C]0.219755[/C][/ROW]
[ROW][C]32[/C][C]0.048884[/C][C]0.3755[/C][C]0.354322[/C][/ROW]
[ROW][C]33[/C][C]0.01252[/C][C]0.0962[/C][C]0.461856[/C][/ROW]
[ROW][C]34[/C][C]-0.150366[/C][C]-1.155[/C][C]0.126377[/C][/ROW]
[ROW][C]35[/C][C]0.019444[/C][C]0.1494[/C][C]0.440892[/C][/ROW]
[ROW][C]36[/C][C]0.153545[/C][C]1.1794[/C][C]0.121487[/C][/ROW]
[ROW][C]37[/C][C]-0.037542[/C][C]-0.2884[/C][C]0.38704[/C][/ROW]
[ROW][C]38[/C][C]-0.031342[/C][C]-0.2407[/C][C]0.405295[/C][/ROW]
[ROW][C]39[/C][C]-0.043355[/C][C]-0.333[/C][C]0.370152[/C][/ROW]
[ROW][C]40[/C][C]0.024528[/C][C]0.1884[/C][C]0.425604[/C][/ROW]
[ROW][C]41[/C][C]-0.020035[/C][C]-0.1539[/C][C]0.43911[/C][/ROW]
[ROW][C]42[/C][C]0.048734[/C][C]0.3743[/C][C]0.35475[/C][/ROW]
[ROW][C]43[/C][C]-0.004169[/C][C]-0.032[/C][C]0.487281[/C][/ROW]
[ROW][C]44[/C][C]0.015083[/C][C]0.1159[/C][C]0.45408[/C][/ROW]
[ROW][C]45[/C][C]-0.025815[/C][C]-0.1983[/C][C]0.42175[/C][/ROW]
[ROW][C]46[/C][C]-0.011638[/C][C]-0.0894[/C][C]0.464537[/C][/ROW]
[ROW][C]47[/C][C]-0.072751[/C][C]-0.5588[/C][C]0.289202[/C][/ROW]
[ROW][C]48[/C][C]0.09589[/C][C]0.7365[/C][C]0.232159[/C][/ROW]
[/TABLE]
Source: https://freestatistics.org/blog/index.php?pk=28762&T=1

Globally Unique Identifier (entire table): ba.freestatistics.org/blog/index.php?pk=28762&T=1

As an alternative you can also use a QR Code:  

The GUIDs for individual cells are displayed in the table below:

Autocorrelation Function
Time lag kACF(k)T-STATP-value
1-0.405251-3.11280.001428
2-0.25522-1.96040.027339
30.3034362.33070.011603
4-0.232515-1.7860.039621
5-0.06547-0.50290.308458
60.3703762.84490.003049
7-0.146117-1.12230.133132
8-0.197187-1.51460.067604
90.3610242.77310.003711
10-0.369326-2.83680.003117
11-0.135043-1.03730.151918
120.5843734.48871.7e-05
13-0.296954-2.28090.013089
14-0.068308-0.52470.300885
150.16761.28740.101499
16-0.2528-1.94180.028471
170.0645660.49590.31089
180.2385051.8320.036001
19-0.132537-1.0180.156408
20-0.054527-0.41880.338431
210.1932621.48450.071503
22-0.35922-2.75920.003852
230.1185850.91090.183035
240.2165031.6630.050809
25-0.132287-1.01610.156861
260.0028160.02160.491407
270.0231380.17770.429772
28-0.124593-0.9570.171232
290.0329860.25340.400432
300.144721.11160.135407
31-0.101324-0.77830.219755
320.0488840.37550.354322
330.012520.09620.461856
34-0.150366-1.1550.126377
350.0194440.14940.440892
360.1535451.17940.121487
37-0.037542-0.28840.38704
38-0.031342-0.24070.405295
39-0.043355-0.3330.370152
400.0245280.18840.425604
41-0.020035-0.15390.43911
420.0487340.37430.35475
43-0.004169-0.0320.487281
440.0150830.11590.45408
45-0.025815-0.19830.42175
46-0.011638-0.08940.464537
47-0.072751-0.55880.289202
480.095890.73650.232159


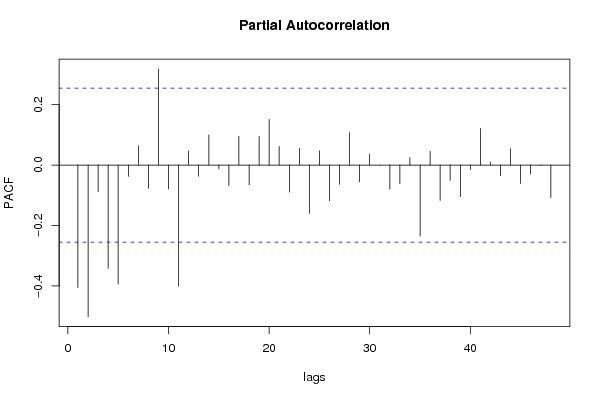
Partial Autocorrelation Function
Time lag kPACF(k)T-STATP-value
1-0.405251-3.11280.001428
2-0.501869-3.85490.000144
3-0.088413-0.67910.24986
4-0.341759-2.62510.005507
5-0.394423-3.02960.001815
6-0.037121-0.28510.38827
70.0642350.49340.311781
8-0.077066-0.5920.278072
90.318392.44560.008732
10-0.079234-0.60860.27256
11-0.401071-3.08070.001568
120.0470340.36130.359591
13-0.036606-0.28120.389779
140.0999840.7680.222778
15-0.012669-0.09730.461403
16-0.068729-0.52790.299768
170.0956840.7350.232637
18-0.065495-0.50310.308391
190.0949220.72910.234409
200.1512871.16210.124946
210.0614530.4720.319324
22-0.089482-0.68730.247287
230.0556040.42710.335429
24-0.15976-1.22710.112321
250.0471410.36210.359287
26-0.11797-0.90610.184273
27-0.063861-0.49050.31279
280.1078950.82880.205291
29-0.055559-0.42680.335556
300.036020.27670.391497
31-0.000248-0.00190.499244
32-0.079852-0.61340.270999
33-0.061588-0.47310.318957
340.0249740.19180.424267
35-0.235185-1.80650.037971
360.0460040.35340.362539
37-0.117153-0.89990.185924
38-0.051008-0.39180.34831
39-0.104455-0.80230.212789
40-0.014932-0.11470.454537
410.1214870.93320.177271
420.00980.07530.470124
43-0.034643-0.26610.395547
440.0540590.41520.339739
45-0.060827-0.46720.321032
46-0.02941-0.22590.41103
470.0008030.00620.497549
48-0.107603-0.82650.205922

\begin{tabular}{lllllllll}
\hline
Partial Autocorrelation Function \tabularnewline
Time lag k & PACF(k) & T-STAT & P-value \tabularnewline
1 & -0.405251 & -3.1128 & 0.001428 \tabularnewline
2 & -0.501869 & -3.8549 & 0.000144 \tabularnewline
3 & -0.088413 & -0.6791 & 0.24986 \tabularnewline
4 & -0.341759 & -2.6251 & 0.005507 \tabularnewline
5 & -0.394423 & -3.0296 & 0.001815 \tabularnewline
6 & -0.037121 & -0.2851 & 0.38827 \tabularnewline
7 & 0.064235 & 0.4934 & 0.311781 \tabularnewline
8 & -0.077066 & -0.592 & 0.278072 \tabularnewline
9 & 0.31839 & 2.4456 & 0.008732 \tabularnewline
10 & -0.079234 & -0.6086 & 0.27256 \tabularnewline
11 & -0.401071 & -3.0807 & 0.001568 \tabularnewline
12 & 0.047034 & 0.3613 & 0.359591 \tabularnewline
13 & -0.036606 & -0.2812 & 0.389779 \tabularnewline
14 & 0.099984 & 0.768 & 0.222778 \tabularnewline
15 & -0.012669 & -0.0973 & 0.461403 \tabularnewline
16 & -0.068729 & -0.5279 & 0.299768 \tabularnewline
17 & 0.095684 & 0.735 & 0.232637 \tabularnewline
18 & -0.065495 & -0.5031 & 0.308391 \tabularnewline
19 & 0.094922 & 0.7291 & 0.234409 \tabularnewline
20 & 0.151287 & 1.1621 & 0.124946 \tabularnewline
21 & 0.061453 & 0.472 & 0.319324 \tabularnewline
22 & -0.089482 & -0.6873 & 0.247287 \tabularnewline
23 & 0.055604 & 0.4271 & 0.335429 \tabularnewline
24 & -0.15976 & -1.2271 & 0.112321 \tabularnewline
25 & 0.047141 & 0.3621 & 0.359287 \tabularnewline
26 & -0.11797 & -0.9061 & 0.184273 \tabularnewline
27 & -0.063861 & -0.4905 & 0.31279 \tabularnewline
28 & 0.107895 & 0.8288 & 0.205291 \tabularnewline
29 & -0.055559 & -0.4268 & 0.335556 \tabularnewline
30 & 0.03602 & 0.2767 & 0.391497 \tabularnewline
31 & -0.000248 & -0.0019 & 0.499244 \tabularnewline
32 & -0.079852 & -0.6134 & 0.270999 \tabularnewline
33 & -0.061588 & -0.4731 & 0.318957 \tabularnewline
34 & 0.024974 & 0.1918 & 0.424267 \tabularnewline
35 & -0.235185 & -1.8065 & 0.037971 \tabularnewline
36 & 0.046004 & 0.3534 & 0.362539 \tabularnewline
37 & -0.117153 & -0.8999 & 0.185924 \tabularnewline
38 & -0.051008 & -0.3918 & 0.34831 \tabularnewline
39 & -0.104455 & -0.8023 & 0.212789 \tabularnewline
40 & -0.014932 & -0.1147 & 0.454537 \tabularnewline
41 & 0.121487 & 0.9332 & 0.177271 \tabularnewline
42 & 0.0098 & 0.0753 & 0.470124 \tabularnewline
43 & -0.034643 & -0.2661 & 0.395547 \tabularnewline
44 & 0.054059 & 0.4152 & 0.339739 \tabularnewline
45 & -0.060827 & -0.4672 & 0.321032 \tabularnewline
46 & -0.02941 & -0.2259 & 0.41103 \tabularnewline
47 & 0.000803 & 0.0062 & 0.497549 \tabularnewline
48 & -0.107603 & -0.8265 & 0.205922 \tabularnewline
\hline
\end{tabular}
%Source: https://freestatistics.org/blog/index.php?pk=28762&T=2

[TABLE]
[ROW][C]Partial Autocorrelation Function[/C][/ROW]
[ROW][C]Time lag k[/C][C]PACF(k)[/C][C]T-STAT[/C][C]P-value[/C][/ROW]
[ROW][C]1[/C][C]-0.405251[/C][C]-3.1128[/C][C]0.001428[/C][/ROW]
[ROW][C]2[/C][C]-0.501869[/C][C]-3.8549[/C][C]0.000144[/C][/ROW]
[ROW][C]3[/C][C]-0.088413[/C][C]-0.6791[/C][C]0.24986[/C][/ROW]
[ROW][C]4[/C][C]-0.341759[/C][C]-2.6251[/C][C]0.005507[/C][/ROW]
[ROW][C]5[/C][C]-0.394423[/C][C]-3.0296[/C][C]0.001815[/C][/ROW]
[ROW][C]6[/C][C]-0.037121[/C][C]-0.2851[/C][C]0.38827[/C][/ROW]
[ROW][C]7[/C][C]0.064235[/C][C]0.4934[/C][C]0.311781[/C][/ROW]
[ROW][C]8[/C][C]-0.077066[/C][C]-0.592[/C][C]0.278072[/C][/ROW]
[ROW][C]9[/C][C]0.31839[/C][C]2.4456[/C][C]0.008732[/C][/ROW]
[ROW][C]10[/C][C]-0.079234[/C][C]-0.6086[/C][C]0.27256[/C][/ROW]
[ROW][C]11[/C][C]-0.401071[/C][C]-3.0807[/C][C]0.001568[/C][/ROW]
[ROW][C]12[/C][C]0.047034[/C][C]0.3613[/C][C]0.359591[/C][/ROW]
[ROW][C]13[/C][C]-0.036606[/C][C]-0.2812[/C][C]0.389779[/C][/ROW]
[ROW][C]14[/C][C]0.099984[/C][C]0.768[/C][C]0.222778[/C][/ROW]
[ROW][C]15[/C][C]-0.012669[/C][C]-0.0973[/C][C]0.461403[/C][/ROW]
[ROW][C]16[/C][C]-0.068729[/C][C]-0.5279[/C][C]0.299768[/C][/ROW]
[ROW][C]17[/C][C]0.095684[/C][C]0.735[/C][C]0.232637[/C][/ROW]
[ROW][C]18[/C][C]-0.065495[/C][C]-0.5031[/C][C]0.308391[/C][/ROW]
[ROW][C]19[/C][C]0.094922[/C][C]0.7291[/C][C]0.234409[/C][/ROW]
[ROW][C]20[/C][C]0.151287[/C][C]1.1621[/C][C]0.124946[/C][/ROW]
[ROW][C]21[/C][C]0.061453[/C][C]0.472[/C][C]0.319324[/C][/ROW]
[ROW][C]22[/C][C]-0.089482[/C][C]-0.6873[/C][C]0.247287[/C][/ROW]
[ROW][C]23[/C][C]0.055604[/C][C]0.4271[/C][C]0.335429[/C][/ROW]
[ROW][C]24[/C][C]-0.15976[/C][C]-1.2271[/C][C]0.112321[/C][/ROW]
[ROW][C]25[/C][C]0.047141[/C][C]0.3621[/C][C]0.359287[/C][/ROW]
[ROW][C]26[/C][C]-0.11797[/C][C]-0.9061[/C][C]0.184273[/C][/ROW]
[ROW][C]27[/C][C]-0.063861[/C][C]-0.4905[/C][C]0.31279[/C][/ROW]
[ROW][C]28[/C][C]0.107895[/C][C]0.8288[/C][C]0.205291[/C][/ROW]
[ROW][C]29[/C][C]-0.055559[/C][C]-0.4268[/C][C]0.335556[/C][/ROW]
[ROW][C]30[/C][C]0.03602[/C][C]0.2767[/C][C]0.391497[/C][/ROW]
[ROW][C]31[/C][C]-0.000248[/C][C]-0.0019[/C][C]0.499244[/C][/ROW]
[ROW][C]32[/C][C]-0.079852[/C][C]-0.6134[/C][C]0.270999[/C][/ROW]
[ROW][C]33[/C][C]-0.061588[/C][C]-0.4731[/C][C]0.318957[/C][/ROW]
[ROW][C]34[/C][C]0.024974[/C][C]0.1918[/C][C]0.424267[/C][/ROW]
[ROW][C]35[/C][C]-0.235185[/C][C]-1.8065[/C][C]0.037971[/C][/ROW]
[ROW][C]36[/C][C]0.046004[/C][C]0.3534[/C][C]0.362539[/C][/ROW]
[ROW][C]37[/C][C]-0.117153[/C][C]-0.8999[/C][C]0.185924[/C][/ROW]
[ROW][C]38[/C][C]-0.051008[/C][C]-0.3918[/C][C]0.34831[/C][/ROW]
[ROW][C]39[/C][C]-0.104455[/C][C]-0.8023[/C][C]0.212789[/C][/ROW]
[ROW][C]40[/C][C]-0.014932[/C][C]-0.1147[/C][C]0.454537[/C][/ROW]
[ROW][C]41[/C][C]0.121487[/C][C]0.9332[/C][C]0.177271[/C][/ROW]
[ROW][C]42[/C][C]0.0098[/C][C]0.0753[/C][C]0.470124[/C][/ROW]
[ROW][C]43[/C][C]-0.034643[/C][C]-0.2661[/C][C]0.395547[/C][/ROW]
[ROW][C]44[/C][C]0.054059[/C][C]0.4152[/C][C]0.339739[/C][/ROW]
[ROW][C]45[/C][C]-0.060827[/C][C]-0.4672[/C][C]0.321032[/C][/ROW]
[ROW][C]46[/C][C]-0.02941[/C][C]-0.2259[/C][C]0.41103[/C][/ROW]
[ROW][C]47[/C][C]0.000803[/C][C]0.0062[/C][C]0.497549[/C][/ROW]
[ROW][C]48[/C][C]-0.107603[/C][C]-0.8265[/C][C]0.205922[/C][/ROW]
[/TABLE]
Source: https://freestatistics.org/blog/index.php?pk=28762&T=2

Globally Unique Identifier (entire table): ba.freestatistics.org/blog/index.php?pk=28762&T=2

As an alternative you can also use a QR Code:  

The GUIDs for individual cells are displayed in the table below:

Partial Autocorrelation Function
Time lag kPACF(k)T-STATP-value
1-0.405251-3.11280.001428
2-0.501869-3.85490.000144
3-0.088413-0.67910.24986
4-0.341759-2.62510.005507
5-0.394423-3.02960.001815
6-0.037121-0.28510.38827
70.0642350.49340.311781
8-0.077066-0.5920.278072
90.318392.44560.008732
10-0.079234-0.60860.27256
11-0.401071-3.08070.001568
120.0470340.36130.359591
13-0.036606-0.28120.389779
140.0999840.7680.222778
15-0.012669-0.09730.461403
16-0.068729-0.52790.299768
170.0956840.7350.232637
18-0.065495-0.50310.308391
190.0949220.72910.234409
200.1512871.16210.124946
210.0614530.4720.319324
22-0.089482-0.68730.247287
230.0556040.42710.335429
24-0.15976-1.22710.112321
250.0471410.36210.359287
26-0.11797-0.90610.184273
27-0.063861-0.49050.31279
280.1078950.82880.205291
29-0.055559-0.42680.335556
300.036020.27670.391497
31-0.000248-0.00190.499244
32-0.079852-0.61340.270999
33-0.061588-0.47310.318957
340.0249740.19180.424267
35-0.235185-1.80650.037971
360.0460040.35340.362539
37-0.117153-0.89990.185924
38-0.051008-0.39180.34831
39-0.104455-0.80230.212789
40-0.014932-0.11470.454537
410.1214870.93320.177271
420.00980.07530.470124
43-0.034643-0.26610.395547
440.0540590.41520.339739
45-0.060827-0.46720.321032
46-0.02941-0.22590.41103
470.0008030.00620.497549
48-0.107603-0.82650.205922


Parameters (Session):
par1 = 48 ; par2 = 1 ; par3 = 1 ; par4 = 0 ; par5 = 12 ;
Parameters (R input):
par1 = 48 ; par2 = 1 ; par3 = 1 ; par4 = 0 ; par5 = 12 ;
R code (references can be found in the software module):
if (par1 == 'Default') {
par1 = 10*log10(length(x))
} else {
par1 <- as.numeric(par1)
}
par2 <- as.numeric(par2)
par3 <- as.numeric(par3)
par4 <- as.numeric(par4)
par5 <- as.numeric(par5)
if (par2 == 0) {
x <- log(x)
} else {
x <- (x ^ par2 - 1) / par2
}
if (par3 > 0) x <- diff(x,lag=1,difference=par3)
if (par4 > 0) x <- diff(x,lag=par5,difference=par4)
bitmap(file='pic1.png')
racf <- acf(x,par1,main='Autocorrelation',xlab='lags',ylab='ACF')
dev.off()
bitmap(file='pic2.png')
rpacf <- pacf(x,par1,main='Partial Autocorrelation',xlab='lags',ylab='PACF')
dev.off()
(myacf <- c(racf$acf))
(mypacf <- c(rpacf$acf))
lengthx <- length(x)
sqrtn <- sqrt(lengthx)
load(file='createtable')
a<-table.start()
a<-table.row.start(a)
a<-table.element(a,'Autocorrelation Function',4,TRUE)
a<-table.row.end(a)
a<-table.row.start(a)
a<-table.element(a,'Time lag k',header=TRUE)
a<-table.element(a,hyperlink('basics.htm','ACF(k)','click here for more information about the Autocorrelation Function'),header=TRUE)
a<-table.element(a,'T-STAT',header=TRUE)
a<-table.element(a,'P-value',header=TRUE)
a<-table.row.end(a)
for (i in 2:(par1+1)) {
a<-table.row.start(a)
a<-table.element(a,i-1,header=TRUE)
a<-table.element(a,round(myacf[i],6))
mytstat <- myacf[i]*sqrtn
a<-table.element(a,round(mytstat,4))
a<-table.element(a,round(1-pt(abs(mytstat),lengthx),6))
a<-table.row.end(a)
}
a<-table.end(a)
table.save(a,file='mytable.tab')
a<-table.start()
a<-table.row.start(a)
a<-table.element(a,'Partial Autocorrelation Function',4,TRUE)
a<-table.row.end(a)
a<-table.row.start(a)
a<-table.element(a,'Time lag k',header=TRUE)
a<-table.element(a,hyperlink('basics.htm','PACF(k)','click here for more information about the Partial Autocorrelation Function'),header=TRUE)
a<-table.element(a,'T-STAT',header=TRUE)
a<-table.element(a,'P-value',header=TRUE)
a<-table.row.end(a)
for (i in 1:par1) {
a<-table.row.start(a)
a<-table.element(a,i,header=TRUE)
a<-table.element(a,round(mypacf[i],6))
mytstat <- mypacf[i]*sqrtn
a<-table.element(a,round(mytstat,4))
a<-table.element(a,round(1-pt(abs(mytstat),lengthx),6))
a<-table.row.end(a)
}
a<-table.end(a)
table.save(a,file='mytable1.tab')