Free Statistics

of Irreproducible Research!

Author's title

Author*Unverified author*
R Software Modulerwasp_autocorrelation.wasp
Title produced by software(Partial) Autocorrelation Function
Date of computationTue, 02 Dec 2008 13:20:25 -0700
Cite this page as followsStatistical Computations at FreeStatistics.org, Office for Research Development and Education, URL https://freestatistics.org/blog/index.php?v=date/2008/Dec/02/t1228249319o8vy1tenci7acng.htm/, Retrieved Fri, 17 May 2024 06:38:47 +0000
Statistical Computations at FreeStatistics.org, Office for Research Development and Education, URL https://freestatistics.org/blog/index.php?pk=28366, Retrieved Fri, 17 May 2024 06:38:47 +0000
QR Codes:

Original text written by user:
IsPrivate?No (this computation is public)
User-defined keywords
Estimated Impact141
Family? (F = Feedback message, R = changed R code, M = changed R Module, P = changed Parameters, D = changed Data)
F       [(Partial) Autocorrelation Function] [law of averages q...] [2008-12-02 20:20:25] [d41d8cd98f00b204e9800998ecf8427e] [Current]
Feedback Forum
2008-12-09 23:10:31 [Peter Van Doninck] [reply
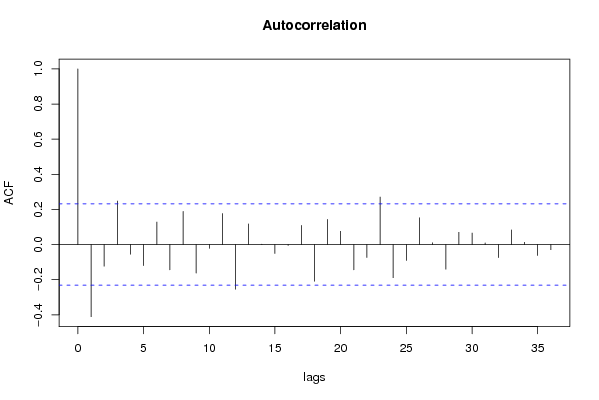
Deze grafiek is spectaculair verbeterd. Seizoenaliteit is volledig gezuiverd, en ook de lange termijntrend is verdwenen.

Post a new message
Dataseries X:
200.7
146.5
143.6
141.5
137.5
138.7
135.5
136.4
112.1
109
123.8
151.2
139.2
115.7
147.6
126.1
122.8
137.3
142
137.4
89.4
108
117.7
127.3
121
104.1
119.5
116.7
96.1
125
118.8
114.9
79.3
90.5
87.8
109.4
88.9
97.4
112
86.8
82.9
105.2
89.1
85.5
87.1
85.2
88.2
104
96.4
82.3
114.1
88.9
93.6
101.8
96.6
93.7
68.4
68.7
81.2
85.1
75.4
71.6
83
72.3
90.2
89
84.9
90.9
46.6
55.4
88.7
76
76.9
72.1
90
92.3
78
93.9
84.5
80.4
60.5
75.3
91.5
105.2
92.7


Summary of computational transaction
Raw Inputview raw input (R code)
Raw Outputview raw output of R engine
Computing time1 seconds
R Server'Gwilym Jenkins' @ 72.249.127.135

\begin{tabular}{lllllllll}
\hline
Summary of computational transaction \tabularnewline
Raw Input & view raw input (R code)  \tabularnewline
Raw Output & view raw output of R engine  \tabularnewline
Computing time & 1 seconds \tabularnewline
R Server & 'Gwilym Jenkins' @ 72.249.127.135 \tabularnewline
\hline
\end{tabular}
%Source: https://freestatistics.org/blog/index.php?pk=28366&T=0

[TABLE]
[ROW][C]Summary of computational transaction[/C][/ROW]
[ROW][C]Raw Input[/C][C]view raw input (R code) [/C][/ROW]
[ROW][C]Raw Output[/C][C]view raw output of R engine [/C][/ROW]
[ROW][C]Computing time[/C][C]1 seconds[/C][/ROW]
[ROW][C]R Server[/C][C]'Gwilym Jenkins' @ 72.249.127.135[/C][/ROW]
[/TABLE]
Source: https://freestatistics.org/blog/index.php?pk=28366&T=0

Globally Unique Identifier (entire table): ba.freestatistics.org/blog/index.php?pk=28366&T=0

As an alternative you can also use a QR Code:  

The GUIDs for individual cells are displayed in the table below:

Summary of computational transaction
Raw Inputview raw input (R code)
Raw Outputview raw output of R engine
Computing time1 seconds
R Server'Gwilym Jenkins' @ 72.249.127.135


Autocorrelation Function
Time lag kACF(k)T-STATP-value
1-0.410829-3.4860.00042
2-0.123113-1.04460.14984
30.2474312.09950.019638
4-0.05497-0.46640.321156
5-0.119545-1.01440.1569
60.1282841.08850.139996
7-0.144326-1.22460.11235
80.1881341.59640.057393
9-0.162664-1.38030.08589
10-0.021761-0.18460.427012
110.1763881.49670.069421
12-0.25441-2.15870.017102
130.1169120.9920.162252
140.0016270.01380.494512
15-0.051045-0.43310.333108
16-0.004929-0.04180.483376
170.1084080.91990.180355
18-0.208845-1.77210.040304
190.1430131.21350.114452
200.0753220.63910.262383
21-0.14417-1.22330.112599
22-0.073875-0.62690.266369
230.2705822.2960.012296
24-0.188607-1.60040.056947
25-0.090983-0.7720.221315
260.1521041.29060.100478
270.0096940.08230.467335
28-0.140572-1.19280.118433
290.0697380.59180.277936
300.0650750.55220.291267
310.0088060.07470.470321
32-0.074459-0.63180.264757
330.0829410.70380.241921
340.0123540.10480.458402
35-0.062301-0.52860.29934
36-0.029611-0.25130.401167

\begin{tabular}{lllllllll}
\hline
Autocorrelation Function \tabularnewline
Time lag k & ACF(k) & T-STAT & P-value \tabularnewline
1 & -0.410829 & -3.486 & 0.00042 \tabularnewline
2 & -0.123113 & -1.0446 & 0.14984 \tabularnewline
3 & 0.247431 & 2.0995 & 0.019638 \tabularnewline
4 & -0.05497 & -0.4664 & 0.321156 \tabularnewline
5 & -0.119545 & -1.0144 & 0.1569 \tabularnewline
6 & 0.128284 & 1.0885 & 0.139996 \tabularnewline
7 & -0.144326 & -1.2246 & 0.11235 \tabularnewline
8 & 0.188134 & 1.5964 & 0.057393 \tabularnewline
9 & -0.162664 & -1.3803 & 0.08589 \tabularnewline
10 & -0.021761 & -0.1846 & 0.427012 \tabularnewline
11 & 0.176388 & 1.4967 & 0.069421 \tabularnewline
12 & -0.25441 & -2.1587 & 0.017102 \tabularnewline
13 & 0.116912 & 0.992 & 0.162252 \tabularnewline
14 & 0.001627 & 0.0138 & 0.494512 \tabularnewline
15 & -0.051045 & -0.4331 & 0.333108 \tabularnewline
16 & -0.004929 & -0.0418 & 0.483376 \tabularnewline
17 & 0.108408 & 0.9199 & 0.180355 \tabularnewline
18 & -0.208845 & -1.7721 & 0.040304 \tabularnewline
19 & 0.143013 & 1.2135 & 0.114452 \tabularnewline
20 & 0.075322 & 0.6391 & 0.262383 \tabularnewline
21 & -0.14417 & -1.2233 & 0.112599 \tabularnewline
22 & -0.073875 & -0.6269 & 0.266369 \tabularnewline
23 & 0.270582 & 2.296 & 0.012296 \tabularnewline
24 & -0.188607 & -1.6004 & 0.056947 \tabularnewline
25 & -0.090983 & -0.772 & 0.221315 \tabularnewline
26 & 0.152104 & 1.2906 & 0.100478 \tabularnewline
27 & 0.009694 & 0.0823 & 0.467335 \tabularnewline
28 & -0.140572 & -1.1928 & 0.118433 \tabularnewline
29 & 0.069738 & 0.5918 & 0.277936 \tabularnewline
30 & 0.065075 & 0.5522 & 0.291267 \tabularnewline
31 & 0.008806 & 0.0747 & 0.470321 \tabularnewline
32 & -0.074459 & -0.6318 & 0.264757 \tabularnewline
33 & 0.082941 & 0.7038 & 0.241921 \tabularnewline
34 & 0.012354 & 0.1048 & 0.458402 \tabularnewline
35 & -0.062301 & -0.5286 & 0.29934 \tabularnewline
36 & -0.029611 & -0.2513 & 0.401167 \tabularnewline
\hline
\end{tabular}
%Source: https://freestatistics.org/blog/index.php?pk=28366&T=1

[TABLE]
[ROW][C]Autocorrelation Function[/C][/ROW]
[ROW][C]Time lag k[/C][C]ACF(k)[/C][C]T-STAT[/C][C]P-value[/C][/ROW]
[ROW][C]1[/C][C]-0.410829[/C][C]-3.486[/C][C]0.00042[/C][/ROW]
[ROW][C]2[/C][C]-0.123113[/C][C]-1.0446[/C][C]0.14984[/C][/ROW]
[ROW][C]3[/C][C]0.247431[/C][C]2.0995[/C][C]0.019638[/C][/ROW]
[ROW][C]4[/C][C]-0.05497[/C][C]-0.4664[/C][C]0.321156[/C][/ROW]
[ROW][C]5[/C][C]-0.119545[/C][C]-1.0144[/C][C]0.1569[/C][/ROW]
[ROW][C]6[/C][C]0.128284[/C][C]1.0885[/C][C]0.139996[/C][/ROW]
[ROW][C]7[/C][C]-0.144326[/C][C]-1.2246[/C][C]0.11235[/C][/ROW]
[ROW][C]8[/C][C]0.188134[/C][C]1.5964[/C][C]0.057393[/C][/ROW]
[ROW][C]9[/C][C]-0.162664[/C][C]-1.3803[/C][C]0.08589[/C][/ROW]
[ROW][C]10[/C][C]-0.021761[/C][C]-0.1846[/C][C]0.427012[/C][/ROW]
[ROW][C]11[/C][C]0.176388[/C][C]1.4967[/C][C]0.069421[/C][/ROW]
[ROW][C]12[/C][C]-0.25441[/C][C]-2.1587[/C][C]0.017102[/C][/ROW]
[ROW][C]13[/C][C]0.116912[/C][C]0.992[/C][C]0.162252[/C][/ROW]
[ROW][C]14[/C][C]0.001627[/C][C]0.0138[/C][C]0.494512[/C][/ROW]
[ROW][C]15[/C][C]-0.051045[/C][C]-0.4331[/C][C]0.333108[/C][/ROW]
[ROW][C]16[/C][C]-0.004929[/C][C]-0.0418[/C][C]0.483376[/C][/ROW]
[ROW][C]17[/C][C]0.108408[/C][C]0.9199[/C][C]0.180355[/C][/ROW]
[ROW][C]18[/C][C]-0.208845[/C][C]-1.7721[/C][C]0.040304[/C][/ROW]
[ROW][C]19[/C][C]0.143013[/C][C]1.2135[/C][C]0.114452[/C][/ROW]
[ROW][C]20[/C][C]0.075322[/C][C]0.6391[/C][C]0.262383[/C][/ROW]
[ROW][C]21[/C][C]-0.14417[/C][C]-1.2233[/C][C]0.112599[/C][/ROW]
[ROW][C]22[/C][C]-0.073875[/C][C]-0.6269[/C][C]0.266369[/C][/ROW]
[ROW][C]23[/C][C]0.270582[/C][C]2.296[/C][C]0.012296[/C][/ROW]
[ROW][C]24[/C][C]-0.188607[/C][C]-1.6004[/C][C]0.056947[/C][/ROW]
[ROW][C]25[/C][C]-0.090983[/C][C]-0.772[/C][C]0.221315[/C][/ROW]
[ROW][C]26[/C][C]0.152104[/C][C]1.2906[/C][C]0.100478[/C][/ROW]
[ROW][C]27[/C][C]0.009694[/C][C]0.0823[/C][C]0.467335[/C][/ROW]
[ROW][C]28[/C][C]-0.140572[/C][C]-1.1928[/C][C]0.118433[/C][/ROW]
[ROW][C]29[/C][C]0.069738[/C][C]0.5918[/C][C]0.277936[/C][/ROW]
[ROW][C]30[/C][C]0.065075[/C][C]0.5522[/C][C]0.291267[/C][/ROW]
[ROW][C]31[/C][C]0.008806[/C][C]0.0747[/C][C]0.470321[/C][/ROW]
[ROW][C]32[/C][C]-0.074459[/C][C]-0.6318[/C][C]0.264757[/C][/ROW]
[ROW][C]33[/C][C]0.082941[/C][C]0.7038[/C][C]0.241921[/C][/ROW]
[ROW][C]34[/C][C]0.012354[/C][C]0.1048[/C][C]0.458402[/C][/ROW]
[ROW][C]35[/C][C]-0.062301[/C][C]-0.5286[/C][C]0.29934[/C][/ROW]
[ROW][C]36[/C][C]-0.029611[/C][C]-0.2513[/C][C]0.401167[/C][/ROW]
[/TABLE]
Source: https://freestatistics.org/blog/index.php?pk=28366&T=1

Globally Unique Identifier (entire table): ba.freestatistics.org/blog/index.php?pk=28366&T=1

As an alternative you can also use a QR Code:  

The GUIDs for individual cells are displayed in the table below:

Autocorrelation Function
Time lag kACF(k)T-STATP-value
1-0.410829-3.4860.00042
2-0.123113-1.04460.14984
30.2474312.09950.019638
4-0.05497-0.46640.321156
5-0.119545-1.01440.1569
60.1282841.08850.139996
7-0.144326-1.22460.11235
80.1881341.59640.057393
9-0.162664-1.38030.08589
10-0.021761-0.18460.427012
110.1763881.49670.069421
12-0.25441-2.15870.017102
130.1169120.9920.162252
140.0016270.01380.494512
15-0.051045-0.43310.333108
16-0.004929-0.04180.483376
170.1084080.91990.180355
18-0.208845-1.77210.040304
190.1430131.21350.114452
200.0753220.63910.262383
21-0.14417-1.22330.112599
22-0.073875-0.62690.266369
230.2705822.2960.012296
24-0.188607-1.60040.056947
25-0.090983-0.7720.221315
260.1521041.29060.100478
270.0096940.08230.467335
28-0.140572-1.19280.118433
290.0697380.59180.277936
300.0650750.55220.291267
310.0088060.07470.470321
32-0.074459-0.63180.264757
330.0829410.70380.241921
340.0123540.10480.458402
35-0.062301-0.52860.29934
36-0.029611-0.25130.401167


Partial Autocorrelation Function
Time lag kPACF(k)T-STATP-value
1-0.410829-3.4860.00042
2-0.351163-2.97970.001966
30.0477880.40550.343159
40.0796260.67560.250715
5-0.043663-0.37050.356053
60.0241780.20520.419014
7-0.161042-1.36650.08802
80.1562531.32590.09454
9-0.088567-0.75150.227395
10-0.069201-0.58720.279458
110.0731980.62110.268245
12-0.210038-1.78220.039463
130.0572230.48560.314378
14-0.140221-1.18980.119014
150.0513960.43610.33203
16-0.085744-0.72760.23462
170.0863410.73260.233083
18-0.135178-1.1470.127585
19-0.072051-0.61140.271439
200.2233031.89480.031068
21-0.134577-1.14190.128635
22-0.120555-1.02290.154879
230.1045290.8870.189028
24-0.060967-0.51730.303258
25-0.112643-0.95580.171184
26-0.055498-0.47090.319561
270.0978720.83050.204509
28-0.180537-1.53190.064963
290.0720510.61140.271439
300.0172070.1460.442161
310.0326970.27740.391119
320.1014410.86080.196114
330.0361510.30670.37996
34-0.0619-0.52520.300516
350.0338960.28760.387232
36-0.085742-0.72750.234626

\begin{tabular}{lllllllll}
\hline
Partial Autocorrelation Function \tabularnewline
Time lag k & PACF(k) & T-STAT & P-value \tabularnewline
1 & -0.410829 & -3.486 & 0.00042 \tabularnewline
2 & -0.351163 & -2.9797 & 0.001966 \tabularnewline
3 & 0.047788 & 0.4055 & 0.343159 \tabularnewline
4 & 0.079626 & 0.6756 & 0.250715 \tabularnewline
5 & -0.043663 & -0.3705 & 0.356053 \tabularnewline
6 & 0.024178 & 0.2052 & 0.419014 \tabularnewline
7 & -0.161042 & -1.3665 & 0.08802 \tabularnewline
8 & 0.156253 & 1.3259 & 0.09454 \tabularnewline
9 & -0.088567 & -0.7515 & 0.227395 \tabularnewline
10 & -0.069201 & -0.5872 & 0.279458 \tabularnewline
11 & 0.073198 & 0.6211 & 0.268245 \tabularnewline
12 & -0.210038 & -1.7822 & 0.039463 \tabularnewline
13 & 0.057223 & 0.4856 & 0.314378 \tabularnewline
14 & -0.140221 & -1.1898 & 0.119014 \tabularnewline
15 & 0.051396 & 0.4361 & 0.33203 \tabularnewline
16 & -0.085744 & -0.7276 & 0.23462 \tabularnewline
17 & 0.086341 & 0.7326 & 0.233083 \tabularnewline
18 & -0.135178 & -1.147 & 0.127585 \tabularnewline
19 & -0.072051 & -0.6114 & 0.271439 \tabularnewline
20 & 0.223303 & 1.8948 & 0.031068 \tabularnewline
21 & -0.134577 & -1.1419 & 0.128635 \tabularnewline
22 & -0.120555 & -1.0229 & 0.154879 \tabularnewline
23 & 0.104529 & 0.887 & 0.189028 \tabularnewline
24 & -0.060967 & -0.5173 & 0.303258 \tabularnewline
25 & -0.112643 & -0.9558 & 0.171184 \tabularnewline
26 & -0.055498 & -0.4709 & 0.319561 \tabularnewline
27 & 0.097872 & 0.8305 & 0.204509 \tabularnewline
28 & -0.180537 & -1.5319 & 0.064963 \tabularnewline
29 & 0.072051 & 0.6114 & 0.271439 \tabularnewline
30 & 0.017207 & 0.146 & 0.442161 \tabularnewline
31 & 0.032697 & 0.2774 & 0.391119 \tabularnewline
32 & 0.101441 & 0.8608 & 0.196114 \tabularnewline
33 & 0.036151 & 0.3067 & 0.37996 \tabularnewline
34 & -0.0619 & -0.5252 & 0.300516 \tabularnewline
35 & 0.033896 & 0.2876 & 0.387232 \tabularnewline
36 & -0.085742 & -0.7275 & 0.234626 \tabularnewline
\hline
\end{tabular}
%Source: https://freestatistics.org/blog/index.php?pk=28366&T=2

[TABLE]
[ROW][C]Partial Autocorrelation Function[/C][/ROW]
[ROW][C]Time lag k[/C][C]PACF(k)[/C][C]T-STAT[/C][C]P-value[/C][/ROW]
[ROW][C]1[/C][C]-0.410829[/C][C]-3.486[/C][C]0.00042[/C][/ROW]
[ROW][C]2[/C][C]-0.351163[/C][C]-2.9797[/C][C]0.001966[/C][/ROW]
[ROW][C]3[/C][C]0.047788[/C][C]0.4055[/C][C]0.343159[/C][/ROW]
[ROW][C]4[/C][C]0.079626[/C][C]0.6756[/C][C]0.250715[/C][/ROW]
[ROW][C]5[/C][C]-0.043663[/C][C]-0.3705[/C][C]0.356053[/C][/ROW]
[ROW][C]6[/C][C]0.024178[/C][C]0.2052[/C][C]0.419014[/C][/ROW]
[ROW][C]7[/C][C]-0.161042[/C][C]-1.3665[/C][C]0.08802[/C][/ROW]
[ROW][C]8[/C][C]0.156253[/C][C]1.3259[/C][C]0.09454[/C][/ROW]
[ROW][C]9[/C][C]-0.088567[/C][C]-0.7515[/C][C]0.227395[/C][/ROW]
[ROW][C]10[/C][C]-0.069201[/C][C]-0.5872[/C][C]0.279458[/C][/ROW]
[ROW][C]11[/C][C]0.073198[/C][C]0.6211[/C][C]0.268245[/C][/ROW]
[ROW][C]12[/C][C]-0.210038[/C][C]-1.7822[/C][C]0.039463[/C][/ROW]
[ROW][C]13[/C][C]0.057223[/C][C]0.4856[/C][C]0.314378[/C][/ROW]
[ROW][C]14[/C][C]-0.140221[/C][C]-1.1898[/C][C]0.119014[/C][/ROW]
[ROW][C]15[/C][C]0.051396[/C][C]0.4361[/C][C]0.33203[/C][/ROW]
[ROW][C]16[/C][C]-0.085744[/C][C]-0.7276[/C][C]0.23462[/C][/ROW]
[ROW][C]17[/C][C]0.086341[/C][C]0.7326[/C][C]0.233083[/C][/ROW]
[ROW][C]18[/C][C]-0.135178[/C][C]-1.147[/C][C]0.127585[/C][/ROW]
[ROW][C]19[/C][C]-0.072051[/C][C]-0.6114[/C][C]0.271439[/C][/ROW]
[ROW][C]20[/C][C]0.223303[/C][C]1.8948[/C][C]0.031068[/C][/ROW]
[ROW][C]21[/C][C]-0.134577[/C][C]-1.1419[/C][C]0.128635[/C][/ROW]
[ROW][C]22[/C][C]-0.120555[/C][C]-1.0229[/C][C]0.154879[/C][/ROW]
[ROW][C]23[/C][C]0.104529[/C][C]0.887[/C][C]0.189028[/C][/ROW]
[ROW][C]24[/C][C]-0.060967[/C][C]-0.5173[/C][C]0.303258[/C][/ROW]
[ROW][C]25[/C][C]-0.112643[/C][C]-0.9558[/C][C]0.171184[/C][/ROW]
[ROW][C]26[/C][C]-0.055498[/C][C]-0.4709[/C][C]0.319561[/C][/ROW]
[ROW][C]27[/C][C]0.097872[/C][C]0.8305[/C][C]0.204509[/C][/ROW]
[ROW][C]28[/C][C]-0.180537[/C][C]-1.5319[/C][C]0.064963[/C][/ROW]
[ROW][C]29[/C][C]0.072051[/C][C]0.6114[/C][C]0.271439[/C][/ROW]
[ROW][C]30[/C][C]0.017207[/C][C]0.146[/C][C]0.442161[/C][/ROW]
[ROW][C]31[/C][C]0.032697[/C][C]0.2774[/C][C]0.391119[/C][/ROW]
[ROW][C]32[/C][C]0.101441[/C][C]0.8608[/C][C]0.196114[/C][/ROW]
[ROW][C]33[/C][C]0.036151[/C][C]0.3067[/C][C]0.37996[/C][/ROW]
[ROW][C]34[/C][C]-0.0619[/C][C]-0.5252[/C][C]0.300516[/C][/ROW]
[ROW][C]35[/C][C]0.033896[/C][C]0.2876[/C][C]0.387232[/C][/ROW]
[ROW][C]36[/C][C]-0.085742[/C][C]-0.7275[/C][C]0.234626[/C][/ROW]
[/TABLE]
Source: https://freestatistics.org/blog/index.php?pk=28366&T=2

Globally Unique Identifier (entire table): ba.freestatistics.org/blog/index.php?pk=28366&T=2

As an alternative you can also use a QR Code:  

The GUIDs for individual cells are displayed in the table below:

Partial Autocorrelation Function
Time lag kPACF(k)T-STATP-value
1-0.410829-3.4860.00042
2-0.351163-2.97970.001966
30.0477880.40550.343159
40.0796260.67560.250715
5-0.043663-0.37050.356053
60.0241780.20520.419014
7-0.161042-1.36650.08802
80.1562531.32590.09454
9-0.088567-0.75150.227395
10-0.069201-0.58720.279458
110.0731980.62110.268245
12-0.210038-1.78220.039463
130.0572230.48560.314378
14-0.140221-1.18980.119014
150.0513960.43610.33203
16-0.085744-0.72760.23462
170.0863410.73260.233083
18-0.135178-1.1470.127585
19-0.072051-0.61140.271439
200.2233031.89480.031068
21-0.134577-1.14190.128635
22-0.120555-1.02290.154879
230.1045290.8870.189028
24-0.060967-0.51730.303258
25-0.112643-0.95580.171184
26-0.055498-0.47090.319561
270.0978720.83050.204509
28-0.180537-1.53190.064963
290.0720510.61140.271439
300.0172070.1460.442161
310.0326970.27740.391119
320.1014410.86080.196114
330.0361510.30670.37996
34-0.0619-0.52520.300516
350.0338960.28760.387232
36-0.085742-0.72750.234626


Parameters (Session):
par1 = 36 ; par2 = 1 ; par3 = 1 ; par4 = 1 ; par5 = 12 ;
Parameters (R input):
par1 = 36 ; par2 = 1 ; par3 = 1 ; par4 = 1 ; par5 = 12 ;
R code (references can be found in the software module):
if (par1 == 'Default') {
par1 = 10*log10(length(x))
} else {
par1 <- as.numeric(par1)
}
par2 <- as.numeric(par2)
par3 <- as.numeric(par3)
par4 <- as.numeric(par4)
par5 <- as.numeric(par5)
if (par2 == 0) {
x <- log(x)
} else {
x <- (x ^ par2 - 1) / par2
}
if (par3 > 0) x <- diff(x,lag=1,difference=par3)
if (par4 > 0) x <- diff(x,lag=par5,difference=par4)
bitmap(file='pic1.png')
racf <- acf(x,par1,main='Autocorrelation',xlab='lags',ylab='ACF')
dev.off()
bitmap(file='pic2.png')
rpacf <- pacf(x,par1,main='Partial Autocorrelation',xlab='lags',ylab='PACF')
dev.off()
(myacf <- c(racf$acf))
(mypacf <- c(rpacf$acf))
lengthx <- length(x)
sqrtn <- sqrt(lengthx)
load(file='createtable')
a<-table.start()
a<-table.row.start(a)
a<-table.element(a,'Autocorrelation Function',4,TRUE)
a<-table.row.end(a)
a<-table.row.start(a)
a<-table.element(a,'Time lag k',header=TRUE)
a<-table.element(a,hyperlink('basics.htm','ACF(k)','click here for more information about the Autocorrelation Function'),header=TRUE)
a<-table.element(a,'T-STAT',header=TRUE)
a<-table.element(a,'P-value',header=TRUE)
a<-table.row.end(a)
for (i in 2:(par1+1)) {
a<-table.row.start(a)
a<-table.element(a,i-1,header=TRUE)
a<-table.element(a,round(myacf[i],6))
mytstat <- myacf[i]*sqrtn
a<-table.element(a,round(mytstat,4))
a<-table.element(a,round(1-pt(abs(mytstat),lengthx),6))
a<-table.row.end(a)
}
a<-table.end(a)
table.save(a,file='mytable.tab')
a<-table.start()
a<-table.row.start(a)
a<-table.element(a,'Partial Autocorrelation Function',4,TRUE)
a<-table.row.end(a)
a<-table.row.start(a)
a<-table.element(a,'Time lag k',header=TRUE)
a<-table.element(a,hyperlink('basics.htm','PACF(k)','click here for more information about the Partial Autocorrelation Function'),header=TRUE)
a<-table.element(a,'T-STAT',header=TRUE)
a<-table.element(a,'P-value',header=TRUE)
a<-table.row.end(a)
for (i in 1:par1) {
a<-table.row.start(a)
a<-table.element(a,i,header=TRUE)
a<-table.element(a,round(mypacf[i],6))
mytstat <- mypacf[i]*sqrtn
a<-table.element(a,round(mytstat,4))
a<-table.element(a,round(1-pt(abs(mytstat),lengthx),6))
a<-table.row.end(a)
}
a<-table.end(a)
table.save(a,file='mytable1.tab')