Free Statistics

of Irreproducible Research!

Author's title

Author*The author of this computation has been verified*
R Software Modulerwasp_cross.wasp
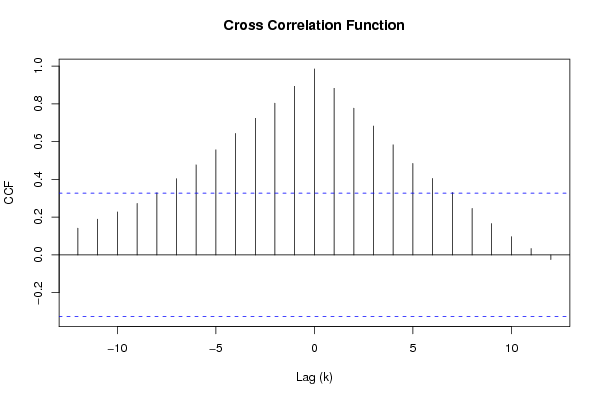
Title produced by softwareCross Correlation Function
Date of computationTue, 02 Dec 2008 08:40:53 -0700
Cite this page as followsStatistical Computations at FreeStatistics.org, Office for Research Development and Education, URL https://freestatistics.org/blog/index.php?v=date/2008/Dec/02/t1228232551ptmmodsp58leo8o.htm/, Retrieved Fri, 17 May 2024 01:41:18 +0000
Statistical Computations at FreeStatistics.org, Office for Research Development and Education, URL https://freestatistics.org/blog/index.php?pk=27967, Retrieved Fri, 17 May 2024 01:41:18 +0000
QR Codes:

Original text written by user:
IsPrivate?No (this computation is public)
User-defined keywords
Estimated Impact195
Family? (F = Feedback message, R = changed R code, M = changed R Module, P = changed Parameters, D = changed Data)
F     [Univariate Data Series] [Airline data] [2007-10-18 09:58:47] [42daae401fd3def69a25014f2252b4c2]
F RMPD  [Spectral Analysis] [question 6] [2008-12-01 14:22:49] [379d6c32f73e3218fd773d79e4063d07]
F RMPD      [Cross Correlation Function] [Q7] [2008-12-02 15:40:53] [f4914427e726625a358be9269a8b7d03] [Current]
F   P         [Cross Correlation Function] [Q7] [2008-12-02 15:51:26] [d811f621c525a990f9b60f1ae1e2e8fd]
Feedback Forum
2008-12-06 13:36:14 [Bert Moons] [reply
Uit deze grafiek kan men afleiden dat er kruiscorrelatie aanwezig is (onderlinge invloed van de 2 variabelen). De X variable voorspeld EN loopt achter op de Y variabele.
2008-12-08 15:24:30 [Alexander Hendrickx] [reply
In deze grafiek is er kruiscorrelatie aanwezig de x loopt achter op de y en voorspelt deze

Post a new message
Dataseries X:
168.8
169.8
171.2
171.3
171.5
172.4
172.8
172.8
173.7
174
174.1
174
175.1
175.8
176.2
176.9
177.7
178
177.5
177.5
178.3
177.7
177.4
176.7
177.1
177.8
178.8
179.8
179.8
179.9
180.1
180.7
181
181.3
181.3
180.9
Dataseries Y:
179.3
180.5
181.5
181.4
181.4
182
182.8
183.1
184.4
184.6
184.6
184.2
184.9
185.3
186.4
186.6
187.3
188.3
187.8
188.1
188
187.8
187.8
187.3
188.5
189.9
191.1
191.8
191.4
191.5
192
193.1
193.3
193.7
193.4
193.1


Summary of computational transaction
Raw Inputview raw input (R code)
Raw Outputview raw output of R engine
Computing time1 seconds
R Server'Gwilym Jenkins' @ 72.249.127.135

\begin{tabular}{lllllllll}
\hline
Summary of computational transaction \tabularnewline
Raw Input & view raw input (R code)  \tabularnewline
Raw Output & view raw output of R engine  \tabularnewline
Computing time & 1 seconds \tabularnewline
R Server & 'Gwilym Jenkins' @ 72.249.127.135 \tabularnewline
\hline
\end{tabular}
%Source: https://freestatistics.org/blog/index.php?pk=27967&T=0

[TABLE]
[ROW][C]Summary of computational transaction[/C][/ROW]
[ROW][C]Raw Input[/C][C]view raw input (R code) [/C][/ROW]
[ROW][C]Raw Output[/C][C]view raw output of R engine [/C][/ROW]
[ROW][C]Computing time[/C][C]1 seconds[/C][/ROW]
[ROW][C]R Server[/C][C]'Gwilym Jenkins' @ 72.249.127.135[/C][/ROW]
[/TABLE]
Source: https://freestatistics.org/blog/index.php?pk=27967&T=0

Globally Unique Identifier (entire table): ba.freestatistics.org/blog/index.php?pk=27967&T=0

As an alternative you can also use a QR Code:  

The GUIDs for individual cells are displayed in the table below:

Summary of computational transaction
Raw Inputview raw input (R code)
Raw Outputview raw output of R engine
Computing time1 seconds
R Server'Gwilym Jenkins' @ 72.249.127.135


Cross Correlation Function
ParameterValue
Box-Cox transformation parameter (lambda) of X series1
Degree of non-seasonal differencing (d) of X series0
Degree of seasonal differencing (D) of X series0
Seasonal Period (s)12
Box-Cox transformation parameter (lambda) of Y series1
Degree of non-seasonal differencing (d) of Y series0
Degree of seasonal differencing (D) of Y series0
krho(Y[t],X[t+k])
-120.141794352202445
-110.188940053753569
-100.227510719674346
-90.272834157750738
-80.328960936823576
-70.403339353635980
-60.476726743675789
-50.55663488193329
-40.642994817898627
-30.723106524328079
-20.8030020763814
-10.892453293538558
00.984437073867206
10.881889637647797
20.776577067092705
30.681972072937039
40.583220198117253
50.484189237900435
60.404910409851927
70.329962877720088
80.24625261134774
90.166378401118898
100.0966798633563182
110.0340547723428045
12-0.0247090901188434

\begin{tabular}{lllllllll}
\hline
Cross Correlation Function \tabularnewline
Parameter & Value \tabularnewline
Box-Cox transformation parameter (lambda) of X series & 1 \tabularnewline
Degree of non-seasonal differencing (d) of X series & 0 \tabularnewline
Degree of seasonal differencing (D) of X series & 0 \tabularnewline
Seasonal Period (s) & 12 \tabularnewline
Box-Cox transformation parameter (lambda) of Y series & 1 \tabularnewline
Degree of non-seasonal differencing (d) of Y series & 0 \tabularnewline
Degree of seasonal differencing (D) of Y series & 0 \tabularnewline
k & rho(Y[t],X[t+k]) \tabularnewline
-12 & 0.141794352202445 \tabularnewline
-11 & 0.188940053753569 \tabularnewline
-10 & 0.227510719674346 \tabularnewline
-9 & 0.272834157750738 \tabularnewline
-8 & 0.328960936823576 \tabularnewline
-7 & 0.403339353635980 \tabularnewline
-6 & 0.476726743675789 \tabularnewline
-5 & 0.55663488193329 \tabularnewline
-4 & 0.642994817898627 \tabularnewline
-3 & 0.723106524328079 \tabularnewline
-2 & 0.8030020763814 \tabularnewline
-1 & 0.892453293538558 \tabularnewline
0 & 0.984437073867206 \tabularnewline
1 & 0.881889637647797 \tabularnewline
2 & 0.776577067092705 \tabularnewline
3 & 0.681972072937039 \tabularnewline
4 & 0.583220198117253 \tabularnewline
5 & 0.484189237900435 \tabularnewline
6 & 0.404910409851927 \tabularnewline
7 & 0.329962877720088 \tabularnewline
8 & 0.24625261134774 \tabularnewline
9 & 0.166378401118898 \tabularnewline
10 & 0.0966798633563182 \tabularnewline
11 & 0.0340547723428045 \tabularnewline
12 & -0.0247090901188434 \tabularnewline
\hline
\end{tabular}
%Source: https://freestatistics.org/blog/index.php?pk=27967&T=1

[TABLE]
[ROW][C]Cross Correlation Function[/C][/ROW]
[ROW][C]Parameter[/C][C]Value[/C][/ROW]
[ROW][C]Box-Cox transformation parameter (lambda) of X series[/C][C]1[/C][/ROW]
[ROW][C]Degree of non-seasonal differencing (d) of X series[/C][C]0[/C][/ROW]
[ROW][C]Degree of seasonal differencing (D) of X series[/C][C]0[/C][/ROW]
[ROW][C]Seasonal Period (s)[/C][C]12[/C][/ROW]
[ROW][C]Box-Cox transformation parameter (lambda) of Y series[/C][C]1[/C][/ROW]
[ROW][C]Degree of non-seasonal differencing (d) of Y series[/C][C]0[/C][/ROW]
[ROW][C]Degree of seasonal differencing (D) of Y series[/C][C]0[/C][/ROW]
[ROW][C]k[/C][C]rho(Y[t],X[t+k])[/C][/ROW]
[ROW][C]-12[/C][C]0.141794352202445[/C][/ROW]
[ROW][C]-11[/C][C]0.188940053753569[/C][/ROW]
[ROW][C]-10[/C][C]0.227510719674346[/C][/ROW]
[ROW][C]-9[/C][C]0.272834157750738[/C][/ROW]
[ROW][C]-8[/C][C]0.328960936823576[/C][/ROW]
[ROW][C]-7[/C][C]0.403339353635980[/C][/ROW]
[ROW][C]-6[/C][C]0.476726743675789[/C][/ROW]
[ROW][C]-5[/C][C]0.55663488193329[/C][/ROW]
[ROW][C]-4[/C][C]0.642994817898627[/C][/ROW]
[ROW][C]-3[/C][C]0.723106524328079[/C][/ROW]
[ROW][C]-2[/C][C]0.8030020763814[/C][/ROW]
[ROW][C]-1[/C][C]0.892453293538558[/C][/ROW]
[ROW][C]0[/C][C]0.984437073867206[/C][/ROW]
[ROW][C]1[/C][C]0.881889637647797[/C][/ROW]
[ROW][C]2[/C][C]0.776577067092705[/C][/ROW]
[ROW][C]3[/C][C]0.681972072937039[/C][/ROW]
[ROW][C]4[/C][C]0.583220198117253[/C][/ROW]
[ROW][C]5[/C][C]0.484189237900435[/C][/ROW]
[ROW][C]6[/C][C]0.404910409851927[/C][/ROW]
[ROW][C]7[/C][C]0.329962877720088[/C][/ROW]
[ROW][C]8[/C][C]0.24625261134774[/C][/ROW]
[ROW][C]9[/C][C]0.166378401118898[/C][/ROW]
[ROW][C]10[/C][C]0.0966798633563182[/C][/ROW]
[ROW][C]11[/C][C]0.0340547723428045[/C][/ROW]
[ROW][C]12[/C][C]-0.0247090901188434[/C][/ROW]
[/TABLE]
Source: https://freestatistics.org/blog/index.php?pk=27967&T=1

Globally Unique Identifier (entire table): ba.freestatistics.org/blog/index.php?pk=27967&T=1

As an alternative you can also use a QR Code:  

The GUIDs for individual cells are displayed in the table below:

Cross Correlation Function
ParameterValue
Box-Cox transformation parameter (lambda) of X series1
Degree of non-seasonal differencing (d) of X series0
Degree of seasonal differencing (D) of X series0
Seasonal Period (s)12
Box-Cox transformation parameter (lambda) of Y series1
Degree of non-seasonal differencing (d) of Y series0
Degree of seasonal differencing (D) of Y series0
krho(Y[t],X[t+k])
-120.141794352202445
-110.188940053753569
-100.227510719674346
-90.272834157750738
-80.328960936823576
-70.403339353635980
-60.476726743675789
-50.55663488193329
-40.642994817898627
-30.723106524328079
-20.8030020763814
-10.892453293538558
00.984437073867206
10.881889637647797
20.776577067092705
30.681972072937039
40.583220198117253
50.484189237900435
60.404910409851927
70.329962877720088
80.24625261134774
90.166378401118898
100.0966798633563182
110.0340547723428045
12-0.0247090901188434


Parameters (Session):
par1 = 1 ; par2 = 0 ; par3 = 0 ; par4 = 12 ; par5 = 1 ; par6 = 0 ; par7 = 0 ;
Parameters (R input):
par1 = 1 ; par2 = 0 ; par3 = 0 ; par4 = 12 ; par5 = 1 ; par6 = 0 ; par7 = 0 ;
R code (references can be found in the software module):
par1 <- as.numeric(par1)
par2 <- as.numeric(par2)
par3 <- as.numeric(par3)
par4 <- as.numeric(par4)
par5 <- as.numeric(par5)
par6 <- as.numeric(par6)
par7 <- as.numeric(par7)
if (par1 == 0) {
x <- log(x)
} else {
x <- (x ^ par1 - 1) / par1
}
if (par5 == 0) {
y <- log(y)
} else {
y <- (y ^ par5 - 1) / par5
}
if (par2 > 0) x <- diff(x,lag=1,difference=par2)
if (par6 > 0) y <- diff(y,lag=1,difference=par6)
if (par3 > 0) x <- diff(x,lag=par4,difference=par3)
if (par7 > 0) y <- diff(y,lag=par4,difference=par7)
x
y
bitmap(file='test1.png')
(r <- ccf(x,y,main='Cross Correlation Function',ylab='CCF',xlab='Lag (k)'))
dev.off()
load(file='createtable')
a<-table.start()
a<-table.row.start(a)
a<-table.element(a,'Cross Correlation Function',2,TRUE)
a<-table.row.end(a)
a<-table.row.start(a)
a<-table.element(a,'Parameter',header=TRUE)
a<-table.element(a,'Value',header=TRUE)
a<-table.row.end(a)
a<-table.row.start(a)
a<-table.element(a,'Box-Cox transformation parameter (lambda) of X series',header=TRUE)
a<-table.element(a,par1)
a<-table.row.end(a)
a<-table.row.start(a)
a<-table.element(a,'Degree of non-seasonal differencing (d) of X series',header=TRUE)
a<-table.element(a,par2)
a<-table.row.end(a)
a<-table.row.start(a)
a<-table.element(a,'Degree of seasonal differencing (D) of X series',header=TRUE)
a<-table.element(a,par3)
a<-table.row.end(a)
a<-table.row.start(a)
a<-table.element(a,'Seasonal Period (s)',header=TRUE)
a<-table.element(a,par4)
a<-table.row.end(a)
a<-table.row.start(a)
a<-table.element(a,'Box-Cox transformation parameter (lambda) of Y series',header=TRUE)
a<-table.element(a,par5)
a<-table.row.end(a)
a<-table.row.start(a)
a<-table.element(a,'Degree of non-seasonal differencing (d) of Y series',header=TRUE)
a<-table.element(a,par6)
a<-table.row.end(a)
a<-table.row.start(a)
a<-table.element(a,'Degree of seasonal differencing (D) of Y series',header=TRUE)
a<-table.element(a,par7)
a<-table.row.end(a)
a<-table.row.start(a)
a<-table.element(a,'k',header=TRUE)
a<-table.element(a,'rho(Y[t],X[t+k])',header=TRUE)
a<-table.row.end(a)
mylength <- length(r$acf)
myhalf <- floor((mylength-1)/2)
for (i in 1:mylength) {
a<-table.row.start(a)
a<-table.element(a,i-myhalf-1,header=TRUE)
a<-table.element(a,r$acf[i])
a<-table.row.end(a)
}
a<-table.end(a)
table.save(a,file='mytable.tab')