Free Statistics

of Irreproducible Research!

Author's title

Author*Unverified author*
R Software Modulerwasp_cross.wasp
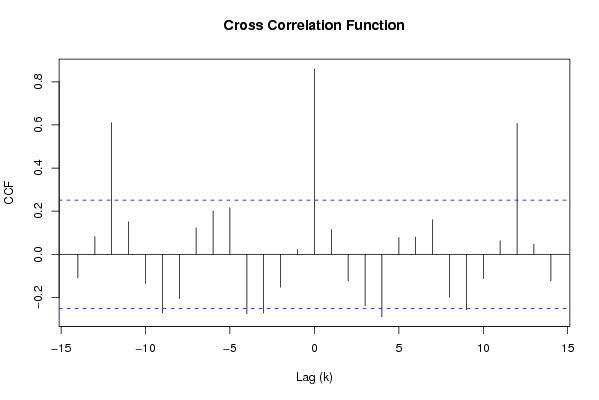
Title produced by softwareCross Correlation Function
Date of computationTue, 02 Dec 2008 07:39:19 -0700
Cite this page as followsStatistical Computations at FreeStatistics.org, Office for Research Development and Education, URL https://freestatistics.org/blog/index.php?v=date/2008/Dec/02/t1228228799oefff8mte21zbka.htm/, Retrieved Fri, 17 May 2024 07:01:26 +0000
Statistical Computations at FreeStatistics.org, Office for Research Development and Education, URL https://freestatistics.org/blog/index.php?pk=27871, Retrieved Fri, 17 May 2024 07:01:26 +0000
QR Codes:

Original text written by user:
IsPrivate?No (this computation is public)
User-defined keywords
Estimated Impact181
Family? (F = Feedback message, R = changed R code, M = changed R Module, P = changed Parameters, D = changed Data)
F     [Univariate Data Series] [Airline data] [2007-10-18 09:58:47] [42daae401fd3def69a25014f2252b4c2]
F RMPD    [Cross Correlation Function] [] [2008-12-02 14:39:19] [86e877ba38171644c8ca01af8044e645] [Current]
Feedback Forum
2008-12-07 13:26:29 [Käthe Vanderheggen] [reply
Nogal een korte analyse, ik begrijp niet goed waarover het juist gaat want de student vermeldt niet wat er juist onderzocht werd. De autocorrelatie is bijna nooit significant verschillend van nul, er is een licht patroon zichtbaar.
2008-12-08 18:56:32 [Erik Geysen] [reply
Een verband tussen woogebouwen en niet-woongebouwen?

Post a new message
Dataseries X:
75
38
20
6
11
38
54
44
37
39
4
49
45
29
20
9
16
3
56
53
35
49
11
54
47
31
21
14
9
16
61
57
40
42
7
43
56
29
34
14
25
39
53
39
32
40
1
47
39
39
20
7
43
43
21
39
35
38
12
37
34
Dataseries Y:
45
24
18
20
22
39
55
35
38
47
1
57
50
33
19
2
7
15
56
53
24
48
2
49
46
32
37
10
8
16
55
46
46
45
6
45
52
44
35
15
44
51
58
23
44
43
6
51
53
47
19
18
38
43
23
43
18
43
6
31
49


Summary of computational transaction
Raw Inputview raw input (R code)
Raw Outputview raw output of R engine
Computing time1 seconds
R Server'George Udny Yule' @ 72.249.76.132

\begin{tabular}{lllllllll}
\hline
Summary of computational transaction \tabularnewline
Raw Input & view raw input (R code)  \tabularnewline
Raw Output & view raw output of R engine  \tabularnewline
Computing time & 1 seconds \tabularnewline
R Server & 'George Udny Yule' @ 72.249.76.132 \tabularnewline
\hline
\end{tabular}
%Source: https://freestatistics.org/blog/index.php?pk=27871&T=0

[TABLE]
[ROW][C]Summary of computational transaction[/C][/ROW]
[ROW][C]Raw Input[/C][C]view raw input (R code) [/C][/ROW]
[ROW][C]Raw Output[/C][C]view raw output of R engine [/C][/ROW]
[ROW][C]Computing time[/C][C]1 seconds[/C][/ROW]
[ROW][C]R Server[/C][C]'George Udny Yule' @ 72.249.76.132[/C][/ROW]
[/TABLE]
Source: https://freestatistics.org/blog/index.php?pk=27871&T=0

Globally Unique Identifier (entire table): ba.freestatistics.org/blog/index.php?pk=27871&T=0

As an alternative you can also use a QR Code:  

The GUIDs for individual cells are displayed in the table below:

Summary of computational transaction
Raw Inputview raw input (R code)
Raw Outputview raw output of R engine
Computing time1 seconds
R Server'George Udny Yule' @ 72.249.76.132


Cross Correlation Function
ParameterValue
Box-Cox transformation parameter (lambda) of X series1
Degree of non-seasonal differencing (d) of X series0
Degree of seasonal differencing (D) of X series0
Seasonal Period (s)12
Box-Cox transformation parameter (lambda) of Y series1
Degree of non-seasonal differencing (d) of Y series0
Degree of seasonal differencing (D) of Y series0
krho(Y[t],X[t+k])
-14-0.1101470567848
-130.0823947051342875
-120.610448875484662
-110.150656453213468
-10-0.136015279927592
-9-0.271991312972264
-8-0.205453445596562
-70.122705209485413
-60.200772265910407
-50.216227116698099
-4-0.276494939142024
-3-0.272526862957318
-2-0.152967167525787
-10.021099804125545
00.859554203064146
10.113816841207779
2-0.123554162827272
3-0.238264473231121
4-0.289472817168489
50.0782632908395984
60.0805461614971838
70.159974312183098
8-0.199189303148754
9-0.25741582413493
10-0.112987063213047
110.0624711640832454
120.605978392843982
130.047207680478614
14-0.123052358980918

\begin{tabular}{lllllllll}
\hline
Cross Correlation Function \tabularnewline
Parameter & Value \tabularnewline
Box-Cox transformation parameter (lambda) of X series & 1 \tabularnewline
Degree of non-seasonal differencing (d) of X series & 0 \tabularnewline
Degree of seasonal differencing (D) of X series & 0 \tabularnewline
Seasonal Period (s) & 12 \tabularnewline
Box-Cox transformation parameter (lambda) of Y series & 1 \tabularnewline
Degree of non-seasonal differencing (d) of Y series & 0 \tabularnewline
Degree of seasonal differencing (D) of Y series & 0 \tabularnewline
k & rho(Y[t],X[t+k]) \tabularnewline
-14 & -0.1101470567848 \tabularnewline
-13 & 0.0823947051342875 \tabularnewline
-12 & 0.610448875484662 \tabularnewline
-11 & 0.150656453213468 \tabularnewline
-10 & -0.136015279927592 \tabularnewline
-9 & -0.271991312972264 \tabularnewline
-8 & -0.205453445596562 \tabularnewline
-7 & 0.122705209485413 \tabularnewline
-6 & 0.200772265910407 \tabularnewline
-5 & 0.216227116698099 \tabularnewline
-4 & -0.276494939142024 \tabularnewline
-3 & -0.272526862957318 \tabularnewline
-2 & -0.152967167525787 \tabularnewline
-1 & 0.021099804125545 \tabularnewline
0 & 0.859554203064146 \tabularnewline
1 & 0.113816841207779 \tabularnewline
2 & -0.123554162827272 \tabularnewline
3 & -0.238264473231121 \tabularnewline
4 & -0.289472817168489 \tabularnewline
5 & 0.0782632908395984 \tabularnewline
6 & 0.0805461614971838 \tabularnewline
7 & 0.159974312183098 \tabularnewline
8 & -0.199189303148754 \tabularnewline
9 & -0.25741582413493 \tabularnewline
10 & -0.112987063213047 \tabularnewline
11 & 0.0624711640832454 \tabularnewline
12 & 0.605978392843982 \tabularnewline
13 & 0.047207680478614 \tabularnewline
14 & -0.123052358980918 \tabularnewline
\hline
\end{tabular}
%Source: https://freestatistics.org/blog/index.php?pk=27871&T=1

[TABLE]
[ROW][C]Cross Correlation Function[/C][/ROW]
[ROW][C]Parameter[/C][C]Value[/C][/ROW]
[ROW][C]Box-Cox transformation parameter (lambda) of X series[/C][C]1[/C][/ROW]
[ROW][C]Degree of non-seasonal differencing (d) of X series[/C][C]0[/C][/ROW]
[ROW][C]Degree of seasonal differencing (D) of X series[/C][C]0[/C][/ROW]
[ROW][C]Seasonal Period (s)[/C][C]12[/C][/ROW]
[ROW][C]Box-Cox transformation parameter (lambda) of Y series[/C][C]1[/C][/ROW]
[ROW][C]Degree of non-seasonal differencing (d) of Y series[/C][C]0[/C][/ROW]
[ROW][C]Degree of seasonal differencing (D) of Y series[/C][C]0[/C][/ROW]
[ROW][C]k[/C][C]rho(Y[t],X[t+k])[/C][/ROW]
[ROW][C]-14[/C][C]-0.1101470567848[/C][/ROW]
[ROW][C]-13[/C][C]0.0823947051342875[/C][/ROW]
[ROW][C]-12[/C][C]0.610448875484662[/C][/ROW]
[ROW][C]-11[/C][C]0.150656453213468[/C][/ROW]
[ROW][C]-10[/C][C]-0.136015279927592[/C][/ROW]
[ROW][C]-9[/C][C]-0.271991312972264[/C][/ROW]
[ROW][C]-8[/C][C]-0.205453445596562[/C][/ROW]
[ROW][C]-7[/C][C]0.122705209485413[/C][/ROW]
[ROW][C]-6[/C][C]0.200772265910407[/C][/ROW]
[ROW][C]-5[/C][C]0.216227116698099[/C][/ROW]
[ROW][C]-4[/C][C]-0.276494939142024[/C][/ROW]
[ROW][C]-3[/C][C]-0.272526862957318[/C][/ROW]
[ROW][C]-2[/C][C]-0.152967167525787[/C][/ROW]
[ROW][C]-1[/C][C]0.021099804125545[/C][/ROW]
[ROW][C]0[/C][C]0.859554203064146[/C][/ROW]
[ROW][C]1[/C][C]0.113816841207779[/C][/ROW]
[ROW][C]2[/C][C]-0.123554162827272[/C][/ROW]
[ROW][C]3[/C][C]-0.238264473231121[/C][/ROW]
[ROW][C]4[/C][C]-0.289472817168489[/C][/ROW]
[ROW][C]5[/C][C]0.0782632908395984[/C][/ROW]
[ROW][C]6[/C][C]0.0805461614971838[/C][/ROW]
[ROW][C]7[/C][C]0.159974312183098[/C][/ROW]
[ROW][C]8[/C][C]-0.199189303148754[/C][/ROW]
[ROW][C]9[/C][C]-0.25741582413493[/C][/ROW]
[ROW][C]10[/C][C]-0.112987063213047[/C][/ROW]
[ROW][C]11[/C][C]0.0624711640832454[/C][/ROW]
[ROW][C]12[/C][C]0.605978392843982[/C][/ROW]
[ROW][C]13[/C][C]0.047207680478614[/C][/ROW]
[ROW][C]14[/C][C]-0.123052358980918[/C][/ROW]
[/TABLE]
Source: https://freestatistics.org/blog/index.php?pk=27871&T=1

Globally Unique Identifier (entire table): ba.freestatistics.org/blog/index.php?pk=27871&T=1

As an alternative you can also use a QR Code:  

The GUIDs for individual cells are displayed in the table below:

Cross Correlation Function
ParameterValue
Box-Cox transformation parameter (lambda) of X series1
Degree of non-seasonal differencing (d) of X series0
Degree of seasonal differencing (D) of X series0
Seasonal Period (s)12
Box-Cox transformation parameter (lambda) of Y series1
Degree of non-seasonal differencing (d) of Y series0
Degree of seasonal differencing (D) of Y series0
krho(Y[t],X[t+k])
-14-0.1101470567848
-130.0823947051342875
-120.610448875484662
-110.150656453213468
-10-0.136015279927592
-9-0.271991312972264
-8-0.205453445596562
-70.122705209485413
-60.200772265910407
-50.216227116698099
-4-0.276494939142024
-3-0.272526862957318
-2-0.152967167525787
-10.021099804125545
00.859554203064146
10.113816841207779
2-0.123554162827272
3-0.238264473231121
4-0.289472817168489
50.0782632908395984
60.0805461614971838
70.159974312183098
8-0.199189303148754
9-0.25741582413493
10-0.112987063213047
110.0624711640832454
120.605978392843982
130.047207680478614
14-0.123052358980918


Parameters (Session):
par1 = 12 ;
Parameters (R input):
par1 = 1 ; par2 = 0 ; par3 = 0 ; par4 = 12 ; par5 = 1 ; par6 = 0 ; par7 = 0 ;
R code (references can be found in the software module):
par1 <- as.numeric(par1)
par2 <- as.numeric(par2)
par3 <- as.numeric(par3)
par4 <- as.numeric(par4)
par5 <- as.numeric(par5)
par6 <- as.numeric(par6)
par7 <- as.numeric(par7)
if (par1 == 0) {
x <- log(x)
} else {
x <- (x ^ par1 - 1) / par1
}
if (par5 == 0) {
y <- log(y)
} else {
y <- (y ^ par5 - 1) / par5
}
if (par2 > 0) x <- diff(x,lag=1,difference=par2)
if (par6 > 0) y <- diff(y,lag=1,difference=par6)
if (par3 > 0) x <- diff(x,lag=par4,difference=par3)
if (par7 > 0) y <- diff(y,lag=par4,difference=par7)
x
y
bitmap(file='test1.png')
(r <- ccf(x,y,main='Cross Correlation Function',ylab='CCF',xlab='Lag (k)'))
dev.off()
load(file='createtable')
a<-table.start()
a<-table.row.start(a)
a<-table.element(a,'Cross Correlation Function',2,TRUE)
a<-table.row.end(a)
a<-table.row.start(a)
a<-table.element(a,'Parameter',header=TRUE)
a<-table.element(a,'Value',header=TRUE)
a<-table.row.end(a)
a<-table.row.start(a)
a<-table.element(a,'Box-Cox transformation parameter (lambda) of X series',header=TRUE)
a<-table.element(a,par1)
a<-table.row.end(a)
a<-table.row.start(a)
a<-table.element(a,'Degree of non-seasonal differencing (d) of X series',header=TRUE)
a<-table.element(a,par2)
a<-table.row.end(a)
a<-table.row.start(a)
a<-table.element(a,'Degree of seasonal differencing (D) of X series',header=TRUE)
a<-table.element(a,par3)
a<-table.row.end(a)
a<-table.row.start(a)
a<-table.element(a,'Seasonal Period (s)',header=TRUE)
a<-table.element(a,par4)
a<-table.row.end(a)
a<-table.row.start(a)
a<-table.element(a,'Box-Cox transformation parameter (lambda) of Y series',header=TRUE)
a<-table.element(a,par5)
a<-table.row.end(a)
a<-table.row.start(a)
a<-table.element(a,'Degree of non-seasonal differencing (d) of Y series',header=TRUE)
a<-table.element(a,par6)
a<-table.row.end(a)
a<-table.row.start(a)
a<-table.element(a,'Degree of seasonal differencing (D) of Y series',header=TRUE)
a<-table.element(a,par7)
a<-table.row.end(a)
a<-table.row.start(a)
a<-table.element(a,'k',header=TRUE)
a<-table.element(a,'rho(Y[t],X[t+k])',header=TRUE)
a<-table.row.end(a)
mylength <- length(r$acf)
myhalf <- floor((mylength-1)/2)
for (i in 1:mylength) {
a<-table.row.start(a)
a<-table.element(a,i-myhalf-1,header=TRUE)
a<-table.element(a,r$acf[i])
a<-table.row.end(a)
}
a<-table.end(a)
table.save(a,file='mytable.tab')