Free Statistics

of Irreproducible Research!

Author's title

Author*Unverified author*
R Software Modulerwasp_cross.wasp
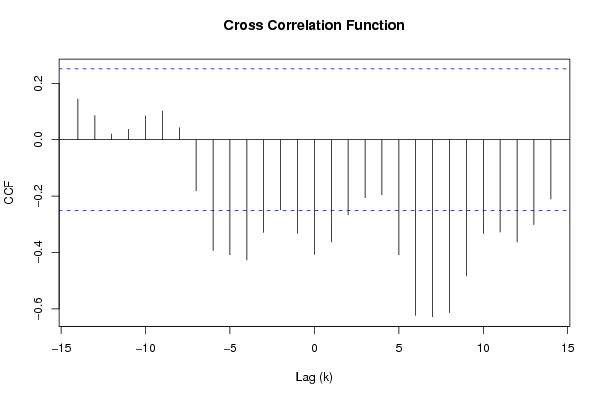
Title produced by softwareCross Correlation Function
Date of computationTue, 02 Dec 2008 07:36:58 -0700
Cite this page as followsStatistical Computations at FreeStatistics.org, Office for Research Development and Education, URL https://freestatistics.org/blog/index.php?v=date/2008/Dec/02/t1228228716voxtg603rpqki78.htm/, Retrieved Fri, 17 May 2024 07:01:14 +0000
Statistical Computations at FreeStatistics.org, Office for Research Development and Education, URL https://freestatistics.org/blog/index.php?pk=27869, Retrieved Fri, 17 May 2024 07:01:14 +0000
QR Codes:

Original text written by user:
IsPrivate?No (this computation is public)
User-defined keywordskleuter
Estimated Impact163
Family? (F = Feedback message, R = changed R code, M = changed R Module, P = changed Parameters, D = changed Data)
F     [Law of Averages] [Random Walk Simul...] [2008-11-25 17:50:19] [b98453cac15ba1066b407e146608df68]
F RMPD    [Cross Correlation Function] [] [2008-12-02 14:36:58] [c233791e22ae82ed03fa45b0d63a2757] [Current]
Feedback Forum
2008-12-03 19:55:22 [407693b66d7f2e0b350979005057872d] [reply
Dit antwoord is volledig juist omdat:
Dat de de periodes 6,7 en 8 een negatieve correlatie van -0.6 hebben en op de grafiek zie je dat op 6,7 en 8 de pieken het verst uit het betrouwbaarheidsinterval liggen. Er is sprake van seizonaliteit. Deze grafiek betekent dus dat je eventueel de werkloosheid kunt voorspellen door een half jaar teruggaan en naar de omzet van de restaurants te kijken. Dat was eerlijk gezegd niet het resultaat dat ik verwachte
2008-12-06 11:25:44 [Käthe Vanderheggen] [reply
Dit is correct. Aangezien de autocorrelatie niet aan beide kanten uit het betrouwbaarheidsinterval valt, kunnen we het niet omkeren. Het verleden van de werkloosheid kan ons niets zeggen over de omzet in restaurants. Het omgekeerde is waar, wat erop zou kunnen wijzen dat het hier om een nonsens correlatie gaat.
2008-12-06 11:34:27 [Käthe Vanderheggen] [reply
Ik wil hier nog even aan toevoegen dat er misschien een derde variabele aan het werk is die een invloed heeft op de omzet in restaurants , als de werkloosheid. Deze derde variabele zou bijvoorbeeld de economische situatie kunnen zijn die zwakker is.

Post a new message
Dataseries X:
569
580
578
565
547
555
562
561
555
544
537
543
594
611
613
611
594
595
591
589
584
573
567
569
621
629
628
612
595
597
593
590
580
574
573
573
620
626
620
588
566
557
561
549
532
526
511
499
555
565
542
527
510
514
517
508
493
490
469
478
528
Dataseries Y:
104.3
119.8
116.8
118.2
107.4
110.8
94.8
96.5
113.4
109.8
118.7
117.2
110.3
111.6
128.1
121.3
107.3
120.5
98.5
97.7
113.2
114.6
118.3
123.9
113.6
117.5
130.1
124.7
114.2
127.3
105.9
101.5
120.2
117.1
131.1
130
120.6
123.1
135.3
134.1
123.7
134.6
108.3
110.4
127.8
126.6
131.4
141.1
127
127.3
143.6
149.4
126.6
136.5
116
118
131.4
140.7
144.9
143.9
127.1


Summary of computational transaction
Raw Inputview raw input (R code)
Raw Outputview raw output of R engine
Computing time3 seconds
R Server'Herman Ole Andreas Wold' @ 193.190.124.10:1001

\begin{tabular}{lllllllll}
\hline
Summary of computational transaction \tabularnewline
Raw Input & view raw input (R code)  \tabularnewline
Raw Output & view raw output of R engine  \tabularnewline
Computing time & 3 seconds \tabularnewline
R Server & 'Herman Ole Andreas Wold' @ 193.190.124.10:1001 \tabularnewline
\hline
\end{tabular}
%Source: https://freestatistics.org/blog/index.php?pk=27869&T=0

[TABLE]
[ROW][C]Summary of computational transaction[/C][/ROW]
[ROW][C]Raw Input[/C][C]view raw input (R code) [/C][/ROW]
[ROW][C]Raw Output[/C][C]view raw output of R engine [/C][/ROW]
[ROW][C]Computing time[/C][C]3 seconds[/C][/ROW]
[ROW][C]R Server[/C][C]'Herman Ole Andreas Wold' @ 193.190.124.10:1001[/C][/ROW]
[/TABLE]
Source: https://freestatistics.org/blog/index.php?pk=27869&T=0

Globally Unique Identifier (entire table): ba.freestatistics.org/blog/index.php?pk=27869&T=0

As an alternative you can also use a QR Code:  

The GUIDs for individual cells are displayed in the table below:

Summary of computational transaction
Raw Inputview raw input (R code)
Raw Outputview raw output of R engine
Computing time3 seconds
R Server'Herman Ole Andreas Wold' @ 193.190.124.10:1001


Cross Correlation Function
ParameterValue
Box-Cox transformation parameter (lambda) of X series1
Degree of non-seasonal differencing (d) of X series0
Degree of seasonal differencing (D) of X series0
Seasonal Period (s)12
Box-Cox transformation parameter (lambda) of Y series1
Degree of non-seasonal differencing (d) of Y series0
Degree of seasonal differencing (D) of Y series0
krho(Y[t],X[t+k])
-140.144717259106924
-130.0855314920460262
-120.0201347190208564
-110.0371244320843316
-100.0841713558356077
-90.101722039558861
-80.0427411071160833
-7-0.181168060273884
-6-0.393067690925222
-5-0.407909321532600
-4-0.426653593549361
-3-0.328754811534062
-2-0.248609408444478
-1-0.331460148632858
0-0.406304072506322
1-0.362544833533228
2-0.266324054205769
3-0.205693110965938
4-0.194957250806377
5-0.40783279052164
6-0.622537041769829
7-0.627391445347691
8-0.612694568938613
9-0.483244750899008
10-0.332792204561792
11-0.327515739913067
12-0.362817161664462
13-0.300777409606047
14-0.210282151238751

\begin{tabular}{lllllllll}
\hline
Cross Correlation Function \tabularnewline
Parameter & Value \tabularnewline
Box-Cox transformation parameter (lambda) of X series & 1 \tabularnewline
Degree of non-seasonal differencing (d) of X series & 0 \tabularnewline
Degree of seasonal differencing (D) of X series & 0 \tabularnewline
Seasonal Period (s) & 12 \tabularnewline
Box-Cox transformation parameter (lambda) of Y series & 1 \tabularnewline
Degree of non-seasonal differencing (d) of Y series & 0 \tabularnewline
Degree of seasonal differencing (D) of Y series & 0 \tabularnewline
k & rho(Y[t],X[t+k]) \tabularnewline
-14 & 0.144717259106924 \tabularnewline
-13 & 0.0855314920460262 \tabularnewline
-12 & 0.0201347190208564 \tabularnewline
-11 & 0.0371244320843316 \tabularnewline
-10 & 0.0841713558356077 \tabularnewline
-9 & 0.101722039558861 \tabularnewline
-8 & 0.0427411071160833 \tabularnewline
-7 & -0.181168060273884 \tabularnewline
-6 & -0.393067690925222 \tabularnewline
-5 & -0.407909321532600 \tabularnewline
-4 & -0.426653593549361 \tabularnewline
-3 & -0.328754811534062 \tabularnewline
-2 & -0.248609408444478 \tabularnewline
-1 & -0.331460148632858 \tabularnewline
0 & -0.406304072506322 \tabularnewline
1 & -0.362544833533228 \tabularnewline
2 & -0.266324054205769 \tabularnewline
3 & -0.205693110965938 \tabularnewline
4 & -0.194957250806377 \tabularnewline
5 & -0.40783279052164 \tabularnewline
6 & -0.622537041769829 \tabularnewline
7 & -0.627391445347691 \tabularnewline
8 & -0.612694568938613 \tabularnewline
9 & -0.483244750899008 \tabularnewline
10 & -0.332792204561792 \tabularnewline
11 & -0.327515739913067 \tabularnewline
12 & -0.362817161664462 \tabularnewline
13 & -0.300777409606047 \tabularnewline
14 & -0.210282151238751 \tabularnewline
\hline
\end{tabular}
%Source: https://freestatistics.org/blog/index.php?pk=27869&T=1

[TABLE]
[ROW][C]Cross Correlation Function[/C][/ROW]
[ROW][C]Parameter[/C][C]Value[/C][/ROW]
[ROW][C]Box-Cox transformation parameter (lambda) of X series[/C][C]1[/C][/ROW]
[ROW][C]Degree of non-seasonal differencing (d) of X series[/C][C]0[/C][/ROW]
[ROW][C]Degree of seasonal differencing (D) of X series[/C][C]0[/C][/ROW]
[ROW][C]Seasonal Period (s)[/C][C]12[/C][/ROW]
[ROW][C]Box-Cox transformation parameter (lambda) of Y series[/C][C]1[/C][/ROW]
[ROW][C]Degree of non-seasonal differencing (d) of Y series[/C][C]0[/C][/ROW]
[ROW][C]Degree of seasonal differencing (D) of Y series[/C][C]0[/C][/ROW]
[ROW][C]k[/C][C]rho(Y[t],X[t+k])[/C][/ROW]
[ROW][C]-14[/C][C]0.144717259106924[/C][/ROW]
[ROW][C]-13[/C][C]0.0855314920460262[/C][/ROW]
[ROW][C]-12[/C][C]0.0201347190208564[/C][/ROW]
[ROW][C]-11[/C][C]0.0371244320843316[/C][/ROW]
[ROW][C]-10[/C][C]0.0841713558356077[/C][/ROW]
[ROW][C]-9[/C][C]0.101722039558861[/C][/ROW]
[ROW][C]-8[/C][C]0.0427411071160833[/C][/ROW]
[ROW][C]-7[/C][C]-0.181168060273884[/C][/ROW]
[ROW][C]-6[/C][C]-0.393067690925222[/C][/ROW]
[ROW][C]-5[/C][C]-0.407909321532600[/C][/ROW]
[ROW][C]-4[/C][C]-0.426653593549361[/C][/ROW]
[ROW][C]-3[/C][C]-0.328754811534062[/C][/ROW]
[ROW][C]-2[/C][C]-0.248609408444478[/C][/ROW]
[ROW][C]-1[/C][C]-0.331460148632858[/C][/ROW]
[ROW][C]0[/C][C]-0.406304072506322[/C][/ROW]
[ROW][C]1[/C][C]-0.362544833533228[/C][/ROW]
[ROW][C]2[/C][C]-0.266324054205769[/C][/ROW]
[ROW][C]3[/C][C]-0.205693110965938[/C][/ROW]
[ROW][C]4[/C][C]-0.194957250806377[/C][/ROW]
[ROW][C]5[/C][C]-0.40783279052164[/C][/ROW]
[ROW][C]6[/C][C]-0.622537041769829[/C][/ROW]
[ROW][C]7[/C][C]-0.627391445347691[/C][/ROW]
[ROW][C]8[/C][C]-0.612694568938613[/C][/ROW]
[ROW][C]9[/C][C]-0.483244750899008[/C][/ROW]
[ROW][C]10[/C][C]-0.332792204561792[/C][/ROW]
[ROW][C]11[/C][C]-0.327515739913067[/C][/ROW]
[ROW][C]12[/C][C]-0.362817161664462[/C][/ROW]
[ROW][C]13[/C][C]-0.300777409606047[/C][/ROW]
[ROW][C]14[/C][C]-0.210282151238751[/C][/ROW]
[/TABLE]
Source: https://freestatistics.org/blog/index.php?pk=27869&T=1

Globally Unique Identifier (entire table): ba.freestatistics.org/blog/index.php?pk=27869&T=1

As an alternative you can also use a QR Code:  

The GUIDs for individual cells are displayed in the table below:

Cross Correlation Function
ParameterValue
Box-Cox transformation parameter (lambda) of X series1
Degree of non-seasonal differencing (d) of X series0
Degree of seasonal differencing (D) of X series0
Seasonal Period (s)12
Box-Cox transformation parameter (lambda) of Y series1
Degree of non-seasonal differencing (d) of Y series0
Degree of seasonal differencing (D) of Y series0
krho(Y[t],X[t+k])
-140.144717259106924
-130.0855314920460262
-120.0201347190208564
-110.0371244320843316
-100.0841713558356077
-90.101722039558861
-80.0427411071160833
-7-0.181168060273884
-6-0.393067690925222
-5-0.407909321532600
-4-0.426653593549361
-3-0.328754811534062
-2-0.248609408444478
-1-0.331460148632858
0-0.406304072506322
1-0.362544833533228
2-0.266324054205769
3-0.205693110965938
4-0.194957250806377
5-0.40783279052164
6-0.622537041769829
7-0.627391445347691
8-0.612694568938613
9-0.483244750899008
10-0.332792204561792
11-0.327515739913067
12-0.362817161664462
13-0.300777409606047
14-0.210282151238751


Parameters (Session):
par1 = 1 ; par2 = 0 ; par3 = 0 ; par4 = 12 ; par5 = 1 ; par6 = 0 ; par7 = 0 ;
Parameters (R input):
par1 = 1 ; par2 = 0 ; par3 = 0 ; par4 = 12 ; par5 = 1 ; par6 = 0 ; par7 = 0 ;
R code (references can be found in the software module):
par1 <- as.numeric(par1)
par2 <- as.numeric(par2)
par3 <- as.numeric(par3)
par4 <- as.numeric(par4)
par5 <- as.numeric(par5)
par6 <- as.numeric(par6)
par7 <- as.numeric(par7)
if (par1 == 0) {
x <- log(x)
} else {
x <- (x ^ par1 - 1) / par1
}
if (par5 == 0) {
y <- log(y)
} else {
y <- (y ^ par5 - 1) / par5
}
if (par2 > 0) x <- diff(x,lag=1,difference=par2)
if (par6 > 0) y <- diff(y,lag=1,difference=par6)
if (par3 > 0) x <- diff(x,lag=par4,difference=par3)
if (par7 > 0) y <- diff(y,lag=par4,difference=par7)
x
y
bitmap(file='test1.png')
(r <- ccf(x,y,main='Cross Correlation Function',ylab='CCF',xlab='Lag (k)'))
dev.off()
load(file='createtable')
a<-table.start()
a<-table.row.start(a)
a<-table.element(a,'Cross Correlation Function',2,TRUE)
a<-table.row.end(a)
a<-table.row.start(a)
a<-table.element(a,'Parameter',header=TRUE)
a<-table.element(a,'Value',header=TRUE)
a<-table.row.end(a)
a<-table.row.start(a)
a<-table.element(a,'Box-Cox transformation parameter (lambda) of X series',header=TRUE)
a<-table.element(a,par1)
a<-table.row.end(a)
a<-table.row.start(a)
a<-table.element(a,'Degree of non-seasonal differencing (d) of X series',header=TRUE)
a<-table.element(a,par2)
a<-table.row.end(a)
a<-table.row.start(a)
a<-table.element(a,'Degree of seasonal differencing (D) of X series',header=TRUE)
a<-table.element(a,par3)
a<-table.row.end(a)
a<-table.row.start(a)
a<-table.element(a,'Seasonal Period (s)',header=TRUE)
a<-table.element(a,par4)
a<-table.row.end(a)
a<-table.row.start(a)
a<-table.element(a,'Box-Cox transformation parameter (lambda) of Y series',header=TRUE)
a<-table.element(a,par5)
a<-table.row.end(a)
a<-table.row.start(a)
a<-table.element(a,'Degree of non-seasonal differencing (d) of Y series',header=TRUE)
a<-table.element(a,par6)
a<-table.row.end(a)
a<-table.row.start(a)
a<-table.element(a,'Degree of seasonal differencing (D) of Y series',header=TRUE)
a<-table.element(a,par7)
a<-table.row.end(a)
a<-table.row.start(a)
a<-table.element(a,'k',header=TRUE)
a<-table.element(a,'rho(Y[t],X[t+k])',header=TRUE)
a<-table.row.end(a)
mylength <- length(r$acf)
myhalf <- floor((mylength-1)/2)
for (i in 1:mylength) {
a<-table.row.start(a)
a<-table.element(a,i-myhalf-1,header=TRUE)
a<-table.element(a,r$acf[i])
a<-table.row.end(a)
}
a<-table.end(a)
table.save(a,file='mytable.tab')