Free Statistics

of Irreproducible Research!

Author's title

Author*Unverified author*
R Software Modulerwasp_centraltendency.wasp
Title produced by softwareCentral Tendency
Date of computationMon, 21 Apr 2008 14:56:41 -0600
Cite this page as followsStatistical Computations at FreeStatistics.org, Office for Research Development and Education, URL https://freestatistics.org/blog/index.php?v=date/2008/Apr/21/t1208811625i0zt9tzh7anpkjo.htm/, Retrieved Thu, 16 May 2024 21:40:51 +0000
Statistical Computations at FreeStatistics.org, Office for Research Development and Education, URL https://freestatistics.org/blog/index.php?pk=10608, Retrieved Thu, 16 May 2024 21:40:51 +0000
QR Codes:

Original text written by user:
IsPrivate?No (this computation is public)
User-defined keywords
Estimated Impact187
Family? (F = Feedback message, R = changed R code, M = changed R Module, P = changed Parameters, D = changed Data)
-       [Central Tendency] [Aantal personenwa...] [2008-04-21 20:56:41] [235a0481b0541f964d64501abed039db] [Current]
Feedback Forum

Post a new message
Dataseries X:
36845
35338
35022
34777
26887
23970
22780
17351
21382
24561
17409
11514
31514
27071
29462
26105
22397
23843
21705
18089
20764
25316
17704
15548
28029
29383
36438
32034
22679
24319
18004
17537
20366
22782
19169
13807
29743
25591
29096
26482
22405
27044
17970
18730
19684
19785
18479
10698
31956
29506
34506
27165
26736
23691
18157
17328
18205
20995
17382
9367
31124
26551
30651
25859
25100
25778
20418
18688
20424
24776
19814
12738
42553


Summary of compuational transaction
Raw Inputview raw input (R code)
Raw Outputview raw output of R engine
Computing time7 seconds
R Server'Sir Ronald Aylmer Fisher' @ 193.190.124.24

\begin{tabular}{lllllllll}
\hline
Summary of compuational transaction \tabularnewline
Raw Input & view raw input (R code)  \tabularnewline
Raw Output & view raw output of R engine  \tabularnewline
Computing time & 7 seconds \tabularnewline
R Server & 'Sir Ronald Aylmer Fisher' @ 193.190.124.24 \tabularnewline
\hline
\end{tabular}
%Source: https://freestatistics.org/blog/index.php?pk=10608&T=0

[TABLE]
[ROW][C]Summary of compuational transaction[/C][/ROW]
[ROW][C]Raw Input[/C][C]view raw input (R code) [/C][/ROW]
[ROW][C]Raw Output[/C][C]view raw output of R engine [/C][/ROW]
[ROW][C]Computing time[/C][C]7 seconds[/C][/ROW]
[ROW][C]R Server[/C][C]'Sir Ronald Aylmer Fisher' @ 193.190.124.24[/C][/ROW]
[/TABLE]
Source: https://freestatistics.org/blog/index.php?pk=10608&T=0

Globally Unique Identifier (entire table): ba.freestatistics.org/blog/index.php?pk=10608&T=0

As an alternative you can also use a QR Code:  

The GUIDs for individual cells are displayed in the table below:

Summary of compuational transaction
Raw Inputview raw input (R code)
Raw Outputview raw output of R engine
Computing time7 seconds
R Server'Sir Ronald Aylmer Fisher' @ 193.190.124.24


Central Tendency - Ungrouped Data
MeasureValueS.E.Value/S.E.
Arithmetic Mean23795.5616438356777.99941259087330.5855779049913
Geometric Mean22842.6612192982
Harmonic Mean21825.7087573700
Quadratic Mean24694.3138421983
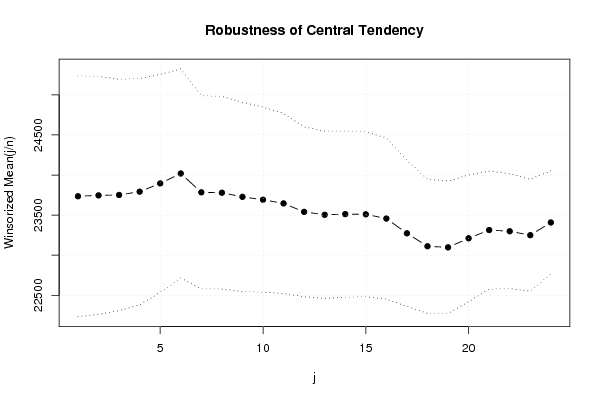
Winsorized Mean ( 1 / 24 )23735.6027397260750.81317376220431.6131942927836
Winsorized Mean ( 2 / 24 )23746.8082191781742.88501685759731.9656577805635
Winsorized Mean ( 3 / 24 )23751.9041095890721.38388196679732.9254710333025
Winsorized Mean ( 4 / 24 )23793.1643835616705.56606968889333.7220926653301
Winsorized Mean ( 5 / 24 )23895.6301369863679.93076481486235.1442108131301
Winsorized Mean ( 6 / 24 )24019.6575342466652.02471630836936.8385690503283
Winsorized Mean ( 7 / 24 )23784.8219178082602.53829189927539.4743740565194
Winsorized Mean ( 8 / 24 )23779.6712328767600.41393194260139.6054621116787
Winsorized Mean ( 9 / 24 )23728.5068493151589.76965330426540.2335161132365
Winsorized Mean ( 10 / 24 )23692.6164383562577.4938100935841.0266153926687
Winsorized Mean ( 11 / 24 )23646.5068493151561.23117580486842.1332738962751
Winsorized Mean ( 12 / 24 )23540.9726027397529.72665331718844.439849222848
Winsorized Mean ( 13 / 24 )23504.8219178082522.04012167522745.0249337970063
Winsorized Mean ( 14 / 24 )23512.6849315069518.3164123406145.3635740094133
Winsorized Mean ( 15 / 24 )23510.4246575342513.70724311399545.7661926567719
Winsorized Mean ( 16 / 24 )23458.0410958904502.28372540434946.7027695890528
Winsorized Mean ( 17 / 24 )23273.3698630137455.53849434221151.089798451874
Winsorized Mean ( 18 / 24 )23111.8630136986418.15432657723655.2711320791026
Winsorized Mean ( 19 / 24 )23098.3287671233413.26863725101455.8918018090341
Winsorized Mean ( 20 / 24 )23211.2054794521394.8917250205358.7786575630202
Winsorized Mean ( 21 / 24 )23314.1917808219368.11271242347563.3343837199553
Winsorized Mean ( 22 / 24 )23299.1232876712357.84951618642465.1087181449015
Winsorized Mean ( 23 / 24 )23249.9726027397348.88338186968266.6411007544759
Winsorized Mean ( 24 / 24 )23408.7671232877321.52964320789472.8043824816241
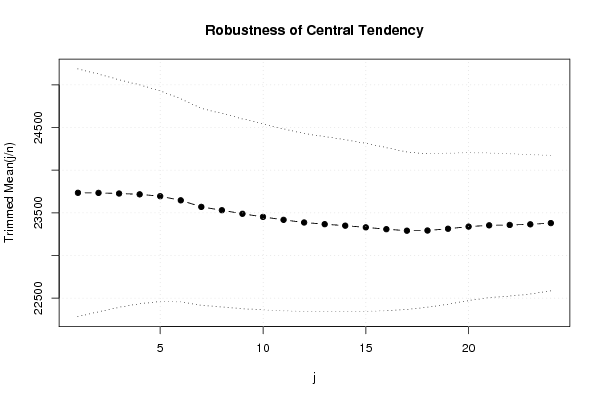
Trimmed Mean ( 1 / 24 )23734.5915492958726.2094031436632.6828480140191
Trimmed Mean ( 2 / 24 )23733.5217391304696.97364847630634.0522511733631
Trimmed Mean ( 3 / 24 )23726.2835820896667.20684000375235.5606120314296
Trimmed Mean ( 4 / 24 )23716.6923076923641.68857244108636.9598171547145
Trimmed Mean ( 5 / 24 )23694.5396825397616.98444746228538.4037876157131
Trimmed Mean ( 6 / 24 )23646.4098360656595.42149527594239.7137322445957
Trimmed Mean ( 7 / 24 )23569.4406779661577.02085573669440.8467743299756
Trimmed Mean ( 8 / 24 )23530.0350877193567.76369557510741.4433597482575
Trimmed Mean ( 9 / 24 )23488.6181818182556.58577860928842.2012546574725
Trimmed Mean ( 10 / 24 )23451.9056603774545.00955722179743.0302649735615
Trimmed Mean ( 11 / 24 )23417.4509803922533.10850406723443.9262379079190
Trimmed Mean ( 12 / 24 )23386.4285714286521.52111703190344.8427260328903
Trimmed Mean ( 13 / 24 )23366.4255319149513.43851432954445.5096859308015
Trimmed Mean ( 14 / 24 )23349.1555555556504.26519593750946.3033255986382
Trimmed Mean ( 15 / 24 )23329.3255813953492.70879595254247.349115284807
Trimmed Mean ( 16 / 24 )23307.8292682927478.18841564453848.7419362446844
Trimmed Mean ( 17 / 24 )23290.2564102564461.36524609860250.481167810544
Trimmed Mean ( 18 / 24 )23292.2162162162450.10123341646851.7488388987916
Trimmed Mean ( 19 / 24 )23313.1142857143443.09722129009852.6139934207601
Trimmed Mean ( 20 / 24 )23338.1212121212433.54985941811753.8303051082617
Trimmed Mean ( 21 / 24 )23353.0645161290424.22543696321755.0487134465582
Trimmed Mean ( 22 / 24 )23357.7241379310417.32515555557855.9700843023357
Trimmed Mean ( 23 / 24 )23364.9259259259408.6661749203257.1736232647136
Trimmed Mean ( 24 / 24 )23379.52396.80847235578758.9189032713934
Median23691
Midrange25960
Midmean - Weighted Average at Xnp23184.6388888889
Midmean - Weighted Average at X(n+1)p23292.2162162162
Midmean - Empirical Distribution Function23292.2162162162
Midmean - Empirical Distribution Function - Averaging23292.2162162162
Midmean - Empirical Distribution Function - Interpolation23292.2162162162
Midmean - Closest Observation23165.5526315789
Midmean - True Basic - Statistics Graphics Toolkit23292.2162162162
Midmean - MS Excel (old versions)23292.2162162162
Number of observations73

\begin{tabular}{lllllllll}
\hline
Central Tendency - Ungrouped Data \tabularnewline
Measure & Value & S.E. & Value/S.E. \tabularnewline
Arithmetic Mean & 23795.5616438356 & 777.999412590873 & 30.5855779049913 \tabularnewline
Geometric Mean & 22842.6612192982 &  &  \tabularnewline
Harmonic Mean & 21825.7087573700 &  &  \tabularnewline
Quadratic Mean & 24694.3138421983 &  &  \tabularnewline
Winsorized Mean ( 1 / 24 ) & 23735.6027397260 & 750.813173762204 & 31.6131942927836 \tabularnewline
Winsorized Mean ( 2 / 24 ) & 23746.8082191781 & 742.885016857597 & 31.9656577805635 \tabularnewline
Winsorized Mean ( 3 / 24 ) & 23751.9041095890 & 721.383881966797 & 32.9254710333025 \tabularnewline
Winsorized Mean ( 4 / 24 ) & 23793.1643835616 & 705.566069688893 & 33.7220926653301 \tabularnewline
Winsorized Mean ( 5 / 24 ) & 23895.6301369863 & 679.930764814862 & 35.1442108131301 \tabularnewline
Winsorized Mean ( 6 / 24 ) & 24019.6575342466 & 652.024716308369 & 36.8385690503283 \tabularnewline
Winsorized Mean ( 7 / 24 ) & 23784.8219178082 & 602.538291899275 & 39.4743740565194 \tabularnewline
Winsorized Mean ( 8 / 24 ) & 23779.6712328767 & 600.413931942601 & 39.6054621116787 \tabularnewline
Winsorized Mean ( 9 / 24 ) & 23728.5068493151 & 589.769653304265 & 40.2335161132365 \tabularnewline
Winsorized Mean ( 10 / 24 ) & 23692.6164383562 & 577.49381009358 & 41.0266153926687 \tabularnewline
Winsorized Mean ( 11 / 24 ) & 23646.5068493151 & 561.231175804868 & 42.1332738962751 \tabularnewline
Winsorized Mean ( 12 / 24 ) & 23540.9726027397 & 529.726653317188 & 44.439849222848 \tabularnewline
Winsorized Mean ( 13 / 24 ) & 23504.8219178082 & 522.040121675227 & 45.0249337970063 \tabularnewline
Winsorized Mean ( 14 / 24 ) & 23512.6849315069 & 518.31641234061 & 45.3635740094133 \tabularnewline
Winsorized Mean ( 15 / 24 ) & 23510.4246575342 & 513.707243113995 & 45.7661926567719 \tabularnewline
Winsorized Mean ( 16 / 24 ) & 23458.0410958904 & 502.283725404349 & 46.7027695890528 \tabularnewline
Winsorized Mean ( 17 / 24 ) & 23273.3698630137 & 455.538494342211 & 51.089798451874 \tabularnewline
Winsorized Mean ( 18 / 24 ) & 23111.8630136986 & 418.154326577236 & 55.2711320791026 \tabularnewline
Winsorized Mean ( 19 / 24 ) & 23098.3287671233 & 413.268637251014 & 55.8918018090341 \tabularnewline
Winsorized Mean ( 20 / 24 ) & 23211.2054794521 & 394.89172502053 & 58.7786575630202 \tabularnewline
Winsorized Mean ( 21 / 24 ) & 23314.1917808219 & 368.112712423475 & 63.3343837199553 \tabularnewline
Winsorized Mean ( 22 / 24 ) & 23299.1232876712 & 357.849516186424 & 65.1087181449015 \tabularnewline
Winsorized Mean ( 23 / 24 ) & 23249.9726027397 & 348.883381869682 & 66.6411007544759 \tabularnewline
Winsorized Mean ( 24 / 24 ) & 23408.7671232877 & 321.529643207894 & 72.8043824816241 \tabularnewline
Trimmed Mean ( 1 / 24 ) & 23734.5915492958 & 726.20940314366 & 32.6828480140191 \tabularnewline
Trimmed Mean ( 2 / 24 ) & 23733.5217391304 & 696.973648476306 & 34.0522511733631 \tabularnewline
Trimmed Mean ( 3 / 24 ) & 23726.2835820896 & 667.206840003752 & 35.5606120314296 \tabularnewline
Trimmed Mean ( 4 / 24 ) & 23716.6923076923 & 641.688572441086 & 36.9598171547145 \tabularnewline
Trimmed Mean ( 5 / 24 ) & 23694.5396825397 & 616.984447462285 & 38.4037876157131 \tabularnewline
Trimmed Mean ( 6 / 24 ) & 23646.4098360656 & 595.421495275942 & 39.7137322445957 \tabularnewline
Trimmed Mean ( 7 / 24 ) & 23569.4406779661 & 577.020855736694 & 40.8467743299756 \tabularnewline
Trimmed Mean ( 8 / 24 ) & 23530.0350877193 & 567.763695575107 & 41.4433597482575 \tabularnewline
Trimmed Mean ( 9 / 24 ) & 23488.6181818182 & 556.585778609288 & 42.2012546574725 \tabularnewline
Trimmed Mean ( 10 / 24 ) & 23451.9056603774 & 545.009557221797 & 43.0302649735615 \tabularnewline
Trimmed Mean ( 11 / 24 ) & 23417.4509803922 & 533.108504067234 & 43.9262379079190 \tabularnewline
Trimmed Mean ( 12 / 24 ) & 23386.4285714286 & 521.521117031903 & 44.8427260328903 \tabularnewline
Trimmed Mean ( 13 / 24 ) & 23366.4255319149 & 513.438514329544 & 45.5096859308015 \tabularnewline
Trimmed Mean ( 14 / 24 ) & 23349.1555555556 & 504.265195937509 & 46.3033255986382 \tabularnewline
Trimmed Mean ( 15 / 24 ) & 23329.3255813953 & 492.708795952542 & 47.349115284807 \tabularnewline
Trimmed Mean ( 16 / 24 ) & 23307.8292682927 & 478.188415644538 & 48.7419362446844 \tabularnewline
Trimmed Mean ( 17 / 24 ) & 23290.2564102564 & 461.365246098602 & 50.481167810544 \tabularnewline
Trimmed Mean ( 18 / 24 ) & 23292.2162162162 & 450.101233416468 & 51.7488388987916 \tabularnewline
Trimmed Mean ( 19 / 24 ) & 23313.1142857143 & 443.097221290098 & 52.6139934207601 \tabularnewline
Trimmed Mean ( 20 / 24 ) & 23338.1212121212 & 433.549859418117 & 53.8303051082617 \tabularnewline
Trimmed Mean ( 21 / 24 ) & 23353.0645161290 & 424.225436963217 & 55.0487134465582 \tabularnewline
Trimmed Mean ( 22 / 24 ) & 23357.7241379310 & 417.325155555578 & 55.9700843023357 \tabularnewline
Trimmed Mean ( 23 / 24 ) & 23364.9259259259 & 408.66617492032 & 57.1736232647136 \tabularnewline
Trimmed Mean ( 24 / 24 ) & 23379.52 & 396.808472355787 & 58.9189032713934 \tabularnewline
Median & 23691 &  &  \tabularnewline
Midrange & 25960 &  &  \tabularnewline
Midmean - Weighted Average at Xnp & 23184.6388888889 &  &  \tabularnewline
Midmean - Weighted Average at X(n+1)p & 23292.2162162162 &  &  \tabularnewline
Midmean - Empirical Distribution Function & 23292.2162162162 &  &  \tabularnewline
Midmean - Empirical Distribution Function - Averaging & 23292.2162162162 &  &  \tabularnewline
Midmean - Empirical Distribution Function - Interpolation & 23292.2162162162 &  &  \tabularnewline
Midmean - Closest Observation & 23165.5526315789 &  &  \tabularnewline
Midmean - True Basic - Statistics Graphics Toolkit & 23292.2162162162 &  &  \tabularnewline
Midmean - MS Excel (old versions) & 23292.2162162162 &  &  \tabularnewline
Number of observations & 73 &  &  \tabularnewline
\hline
\end{tabular}
%Source: https://freestatistics.org/blog/index.php?pk=10608&T=1

[TABLE]
[ROW][C]Central Tendency - Ungrouped Data[/C][/ROW]
[ROW][C]Measure[/C][C]Value[/C][C]S.E.[/C][C]Value/S.E.[/C][/ROW]
[ROW][C]Arithmetic Mean[/C][C]23795.5616438356[/C][C]777.999412590873[/C][C]30.5855779049913[/C][/ROW]
[ROW][C]Geometric Mean[/C][C]22842.6612192982[/C][C][/C][C][/C][/ROW]
[ROW][C]Harmonic Mean[/C][C]21825.7087573700[/C][C][/C][C][/C][/ROW]
[ROW][C]Quadratic Mean[/C][C]24694.3138421983[/C][C][/C][C][/C][/ROW]
[ROW][C]Winsorized Mean ( 1 / 24 )[/C][C]23735.6027397260[/C][C]750.813173762204[/C][C]31.6131942927836[/C][/ROW]
[ROW][C]Winsorized Mean ( 2 / 24 )[/C][C]23746.8082191781[/C][C]742.885016857597[/C][C]31.9656577805635[/C][/ROW]
[ROW][C]Winsorized Mean ( 3 / 24 )[/C][C]23751.9041095890[/C][C]721.383881966797[/C][C]32.9254710333025[/C][/ROW]
[ROW][C]Winsorized Mean ( 4 / 24 )[/C][C]23793.1643835616[/C][C]705.566069688893[/C][C]33.7220926653301[/C][/ROW]
[ROW][C]Winsorized Mean ( 5 / 24 )[/C][C]23895.6301369863[/C][C]679.930764814862[/C][C]35.1442108131301[/C][/ROW]
[ROW][C]Winsorized Mean ( 6 / 24 )[/C][C]24019.6575342466[/C][C]652.024716308369[/C][C]36.8385690503283[/C][/ROW]
[ROW][C]Winsorized Mean ( 7 / 24 )[/C][C]23784.8219178082[/C][C]602.538291899275[/C][C]39.4743740565194[/C][/ROW]
[ROW][C]Winsorized Mean ( 8 / 24 )[/C][C]23779.6712328767[/C][C]600.413931942601[/C][C]39.6054621116787[/C][/ROW]
[ROW][C]Winsorized Mean ( 9 / 24 )[/C][C]23728.5068493151[/C][C]589.769653304265[/C][C]40.2335161132365[/C][/ROW]
[ROW][C]Winsorized Mean ( 10 / 24 )[/C][C]23692.6164383562[/C][C]577.49381009358[/C][C]41.0266153926687[/C][/ROW]
[ROW][C]Winsorized Mean ( 11 / 24 )[/C][C]23646.5068493151[/C][C]561.231175804868[/C][C]42.1332738962751[/C][/ROW]
[ROW][C]Winsorized Mean ( 12 / 24 )[/C][C]23540.9726027397[/C][C]529.726653317188[/C][C]44.439849222848[/C][/ROW]
[ROW][C]Winsorized Mean ( 13 / 24 )[/C][C]23504.8219178082[/C][C]522.040121675227[/C][C]45.0249337970063[/C][/ROW]
[ROW][C]Winsorized Mean ( 14 / 24 )[/C][C]23512.6849315069[/C][C]518.31641234061[/C][C]45.3635740094133[/C][/ROW]
[ROW][C]Winsorized Mean ( 15 / 24 )[/C][C]23510.4246575342[/C][C]513.707243113995[/C][C]45.7661926567719[/C][/ROW]
[ROW][C]Winsorized Mean ( 16 / 24 )[/C][C]23458.0410958904[/C][C]502.283725404349[/C][C]46.7027695890528[/C][/ROW]
[ROW][C]Winsorized Mean ( 17 / 24 )[/C][C]23273.3698630137[/C][C]455.538494342211[/C][C]51.089798451874[/C][/ROW]
[ROW][C]Winsorized Mean ( 18 / 24 )[/C][C]23111.8630136986[/C][C]418.154326577236[/C][C]55.2711320791026[/C][/ROW]
[ROW][C]Winsorized Mean ( 19 / 24 )[/C][C]23098.3287671233[/C][C]413.268637251014[/C][C]55.8918018090341[/C][/ROW]
[ROW][C]Winsorized Mean ( 20 / 24 )[/C][C]23211.2054794521[/C][C]394.89172502053[/C][C]58.7786575630202[/C][/ROW]
[ROW][C]Winsorized Mean ( 21 / 24 )[/C][C]23314.1917808219[/C][C]368.112712423475[/C][C]63.3343837199553[/C][/ROW]
[ROW][C]Winsorized Mean ( 22 / 24 )[/C][C]23299.1232876712[/C][C]357.849516186424[/C][C]65.1087181449015[/C][/ROW]
[ROW][C]Winsorized Mean ( 23 / 24 )[/C][C]23249.9726027397[/C][C]348.883381869682[/C][C]66.6411007544759[/C][/ROW]
[ROW][C]Winsorized Mean ( 24 / 24 )[/C][C]23408.7671232877[/C][C]321.529643207894[/C][C]72.8043824816241[/C][/ROW]
[ROW][C]Trimmed Mean ( 1 / 24 )[/C][C]23734.5915492958[/C][C]726.20940314366[/C][C]32.6828480140191[/C][/ROW]
[ROW][C]Trimmed Mean ( 2 / 24 )[/C][C]23733.5217391304[/C][C]696.973648476306[/C][C]34.0522511733631[/C][/ROW]
[ROW][C]Trimmed Mean ( 3 / 24 )[/C][C]23726.2835820896[/C][C]667.206840003752[/C][C]35.5606120314296[/C][/ROW]
[ROW][C]Trimmed Mean ( 4 / 24 )[/C][C]23716.6923076923[/C][C]641.688572441086[/C][C]36.9598171547145[/C][/ROW]
[ROW][C]Trimmed Mean ( 5 / 24 )[/C][C]23694.5396825397[/C][C]616.984447462285[/C][C]38.4037876157131[/C][/ROW]
[ROW][C]Trimmed Mean ( 6 / 24 )[/C][C]23646.4098360656[/C][C]595.421495275942[/C][C]39.7137322445957[/C][/ROW]
[ROW][C]Trimmed Mean ( 7 / 24 )[/C][C]23569.4406779661[/C][C]577.020855736694[/C][C]40.8467743299756[/C][/ROW]
[ROW][C]Trimmed Mean ( 8 / 24 )[/C][C]23530.0350877193[/C][C]567.763695575107[/C][C]41.4433597482575[/C][/ROW]
[ROW][C]Trimmed Mean ( 9 / 24 )[/C][C]23488.6181818182[/C][C]556.585778609288[/C][C]42.2012546574725[/C][/ROW]
[ROW][C]Trimmed Mean ( 10 / 24 )[/C][C]23451.9056603774[/C][C]545.009557221797[/C][C]43.0302649735615[/C][/ROW]
[ROW][C]Trimmed Mean ( 11 / 24 )[/C][C]23417.4509803922[/C][C]533.108504067234[/C][C]43.9262379079190[/C][/ROW]
[ROW][C]Trimmed Mean ( 12 / 24 )[/C][C]23386.4285714286[/C][C]521.521117031903[/C][C]44.8427260328903[/C][/ROW]
[ROW][C]Trimmed Mean ( 13 / 24 )[/C][C]23366.4255319149[/C][C]513.438514329544[/C][C]45.5096859308015[/C][/ROW]
[ROW][C]Trimmed Mean ( 14 / 24 )[/C][C]23349.1555555556[/C][C]504.265195937509[/C][C]46.3033255986382[/C][/ROW]
[ROW][C]Trimmed Mean ( 15 / 24 )[/C][C]23329.3255813953[/C][C]492.708795952542[/C][C]47.349115284807[/C][/ROW]
[ROW][C]Trimmed Mean ( 16 / 24 )[/C][C]23307.8292682927[/C][C]478.188415644538[/C][C]48.7419362446844[/C][/ROW]
[ROW][C]Trimmed Mean ( 17 / 24 )[/C][C]23290.2564102564[/C][C]461.365246098602[/C][C]50.481167810544[/C][/ROW]
[ROW][C]Trimmed Mean ( 18 / 24 )[/C][C]23292.2162162162[/C][C]450.101233416468[/C][C]51.7488388987916[/C][/ROW]
[ROW][C]Trimmed Mean ( 19 / 24 )[/C][C]23313.1142857143[/C][C]443.097221290098[/C][C]52.6139934207601[/C][/ROW]
[ROW][C]Trimmed Mean ( 20 / 24 )[/C][C]23338.1212121212[/C][C]433.549859418117[/C][C]53.8303051082617[/C][/ROW]
[ROW][C]Trimmed Mean ( 21 / 24 )[/C][C]23353.0645161290[/C][C]424.225436963217[/C][C]55.0487134465582[/C][/ROW]
[ROW][C]Trimmed Mean ( 22 / 24 )[/C][C]23357.7241379310[/C][C]417.325155555578[/C][C]55.9700843023357[/C][/ROW]
[ROW][C]Trimmed Mean ( 23 / 24 )[/C][C]23364.9259259259[/C][C]408.66617492032[/C][C]57.1736232647136[/C][/ROW]
[ROW][C]Trimmed Mean ( 24 / 24 )[/C][C]23379.52[/C][C]396.808472355787[/C][C]58.9189032713934[/C][/ROW]
[ROW][C]Median[/C][C]23691[/C][C][/C][C][/C][/ROW]
[ROW][C]Midrange[/C][C]25960[/C][C][/C][C][/C][/ROW]
[ROW][C]Midmean - Weighted Average at Xnp[/C][C]23184.6388888889[/C][C][/C][C][/C][/ROW]
[ROW][C]Midmean - Weighted Average at X(n+1)p[/C][C]23292.2162162162[/C][C][/C][C][/C][/ROW]
[ROW][C]Midmean - Empirical Distribution Function[/C][C]23292.2162162162[/C][C][/C][C][/C][/ROW]
[ROW][C]Midmean - Empirical Distribution Function - Averaging[/C][C]23292.2162162162[/C][C][/C][C][/C][/ROW]
[ROW][C]Midmean - Empirical Distribution Function - Interpolation[/C][C]23292.2162162162[/C][C][/C][C][/C][/ROW]
[ROW][C]Midmean - Closest Observation[/C][C]23165.5526315789[/C][C][/C][C][/C][/ROW]
[ROW][C]Midmean - True Basic - Statistics Graphics Toolkit[/C][C]23292.2162162162[/C][C][/C][C][/C][/ROW]
[ROW][C]Midmean - MS Excel (old versions)[/C][C]23292.2162162162[/C][C][/C][C][/C][/ROW]
[ROW][C]Number of observations[/C][C]73[/C][C][/C][C][/C][/ROW]
[/TABLE]
Source: https://freestatistics.org/blog/index.php?pk=10608&T=1

Globally Unique Identifier (entire table): ba.freestatistics.org/blog/index.php?pk=10608&T=1

As an alternative you can also use a QR Code:  

The GUIDs for individual cells are displayed in the table below:

Central Tendency - Ungrouped Data
MeasureValueS.E.Value/S.E.
Arithmetic Mean23795.5616438356777.99941259087330.5855779049913
Geometric Mean22842.6612192982
Harmonic Mean21825.7087573700
Quadratic Mean24694.3138421983
Winsorized Mean ( 1 / 24 )23735.6027397260750.81317376220431.6131942927836
Winsorized Mean ( 2 / 24 )23746.8082191781742.88501685759731.9656577805635
Winsorized Mean ( 3 / 24 )23751.9041095890721.38388196679732.9254710333025
Winsorized Mean ( 4 / 24 )23793.1643835616705.56606968889333.7220926653301
Winsorized Mean ( 5 / 24 )23895.6301369863679.93076481486235.1442108131301
Winsorized Mean ( 6 / 24 )24019.6575342466652.02471630836936.8385690503283
Winsorized Mean ( 7 / 24 )23784.8219178082602.53829189927539.4743740565194
Winsorized Mean ( 8 / 24 )23779.6712328767600.41393194260139.6054621116787
Winsorized Mean ( 9 / 24 )23728.5068493151589.76965330426540.2335161132365
Winsorized Mean ( 10 / 24 )23692.6164383562577.4938100935841.0266153926687
Winsorized Mean ( 11 / 24 )23646.5068493151561.23117580486842.1332738962751
Winsorized Mean ( 12 / 24 )23540.9726027397529.72665331718844.439849222848
Winsorized Mean ( 13 / 24 )23504.8219178082522.04012167522745.0249337970063
Winsorized Mean ( 14 / 24 )23512.6849315069518.3164123406145.3635740094133
Winsorized Mean ( 15 / 24 )23510.4246575342513.70724311399545.7661926567719
Winsorized Mean ( 16 / 24 )23458.0410958904502.28372540434946.7027695890528
Winsorized Mean ( 17 / 24 )23273.3698630137455.53849434221151.089798451874
Winsorized Mean ( 18 / 24 )23111.8630136986418.15432657723655.2711320791026
Winsorized Mean ( 19 / 24 )23098.3287671233413.26863725101455.8918018090341
Winsorized Mean ( 20 / 24 )23211.2054794521394.8917250205358.7786575630202
Winsorized Mean ( 21 / 24 )23314.1917808219368.11271242347563.3343837199553
Winsorized Mean ( 22 / 24 )23299.1232876712357.84951618642465.1087181449015
Winsorized Mean ( 23 / 24 )23249.9726027397348.88338186968266.6411007544759
Winsorized Mean ( 24 / 24 )23408.7671232877321.52964320789472.8043824816241
Trimmed Mean ( 1 / 24 )23734.5915492958726.2094031436632.6828480140191
Trimmed Mean ( 2 / 24 )23733.5217391304696.97364847630634.0522511733631
Trimmed Mean ( 3 / 24 )23726.2835820896667.20684000375235.5606120314296
Trimmed Mean ( 4 / 24 )23716.6923076923641.68857244108636.9598171547145
Trimmed Mean ( 5 / 24 )23694.5396825397616.98444746228538.4037876157131
Trimmed Mean ( 6 / 24 )23646.4098360656595.42149527594239.7137322445957
Trimmed Mean ( 7 / 24 )23569.4406779661577.02085573669440.8467743299756
Trimmed Mean ( 8 / 24 )23530.0350877193567.76369557510741.4433597482575
Trimmed Mean ( 9 / 24 )23488.6181818182556.58577860928842.2012546574725
Trimmed Mean ( 10 / 24 )23451.9056603774545.00955722179743.0302649735615
Trimmed Mean ( 11 / 24 )23417.4509803922533.10850406723443.9262379079190
Trimmed Mean ( 12 / 24 )23386.4285714286521.52111703190344.8427260328903
Trimmed Mean ( 13 / 24 )23366.4255319149513.43851432954445.5096859308015
Trimmed Mean ( 14 / 24 )23349.1555555556504.26519593750946.3033255986382
Trimmed Mean ( 15 / 24 )23329.3255813953492.70879595254247.349115284807
Trimmed Mean ( 16 / 24 )23307.8292682927478.18841564453848.7419362446844
Trimmed Mean ( 17 / 24 )23290.2564102564461.36524609860250.481167810544
Trimmed Mean ( 18 / 24 )23292.2162162162450.10123341646851.7488388987916
Trimmed Mean ( 19 / 24 )23313.1142857143443.09722129009852.6139934207601
Trimmed Mean ( 20 / 24 )23338.1212121212433.54985941811753.8303051082617
Trimmed Mean ( 21 / 24 )23353.0645161290424.22543696321755.0487134465582
Trimmed Mean ( 22 / 24 )23357.7241379310417.32515555557855.9700843023357
Trimmed Mean ( 23 / 24 )23364.9259259259408.6661749203257.1736232647136
Trimmed Mean ( 24 / 24 )23379.52396.80847235578758.9189032713934
Median23691
Midrange25960
Midmean - Weighted Average at Xnp23184.6388888889
Midmean - Weighted Average at X(n+1)p23292.2162162162
Midmean - Empirical Distribution Function23292.2162162162
Midmean - Empirical Distribution Function - Averaging23292.2162162162
Midmean - Empirical Distribution Function - Interpolation23292.2162162162
Midmean - Closest Observation23165.5526315789
Midmean - True Basic - Statistics Graphics Toolkit23292.2162162162
Midmean - MS Excel (old versions)23292.2162162162
Number of observations73


Parameters (Session):
Parameters (R input):
R code (references can be found in the software module):
geomean <- function(x) {
return(exp(mean(log(x))))
}
harmean <- function(x) {
return(1/mean(1/x))
}
quamean <- function(x) {
return(sqrt(mean(x*x)))
}
winmean <- function(x) {
x <-sort(x[!is.na(x)])
n<-length(x)
denom <- 3
nodenom <- n/denom
if (nodenom>40) denom <- n/40
sqrtn = sqrt(n)
roundnodenom = floor(nodenom)
win <- array(NA,dim=c(roundnodenom,2))
for (j in 1:roundnodenom) {
win[j,1] <- (j*x[j+1]+sum(x[(j+1):(n-j)])+j*x[n-j])/n
win[j,2] <- sd(c(rep(x[j+1],j),x[(j+1):(n-j)],rep(x[n-j],j)))/sqrtn
}
return(win)
}
trimean <- function(x) {
x <-sort(x[!is.na(x)])
n<-length(x)
denom <- 3
nodenom <- n/denom
if (nodenom>40) denom <- n/40
sqrtn = sqrt(n)
roundnodenom = floor(nodenom)
tri <- array(NA,dim=c(roundnodenom,2))
for (j in 1:roundnodenom) {
tri[j,1] <- mean(x,trim=j/n)
tri[j,2] <- sd(x[(j+1):(n-j)]) / sqrt(n-j*2)
}
return(tri)
}
midrange <- function(x) {
return((max(x)+min(x))/2)
}
q1 <- function(data,n,p,i,f) {
np <- n*p;
i <<- floor(np)
f <<- np - i
qvalue <- (1-f)*data[i] + f*data[i+1]
}
q2 <- function(data,n,p,i,f) {
np <- (n+1)*p
i <<- floor(np)
f <<- np - i
qvalue <- (1-f)*data[i] + f*data[i+1]
}
q3 <- function(data,n,p,i,f) {
np <- n*p
i <<- floor(np)
f <<- np - i
if (f==0) {
qvalue <- data[i]
} else {
qvalue <- data[i+1]
}
}
q4 <- function(data,n,p,i,f) {
np <- n*p
i <<- floor(np)
f <<- np - i
if (f==0) {
qvalue <- (data[i]+data[i+1])/2
} else {
qvalue <- data[i+1]
}
}
q5 <- function(data,n,p,i,f) {
np <- (n-1)*p
i <<- floor(np)
f <<- np - i
if (f==0) {
qvalue <- data[i+1]
} else {
qvalue <- data[i+1] + f*(data[i+2]-data[i+1])
}
}
q6 <- function(data,n,p,i,f) {
np <- n*p+0.5
i <<- floor(np)
f <<- np - i
qvalue <- data[i]
}
q7 <- function(data,n,p,i,f) {
np <- (n+1)*p
i <<- floor(np)
f <<- np - i
if (f==0) {
qvalue <- data[i]
} else {
qvalue <- f*data[i] + (1-f)*data[i+1]
}
}
q8 <- function(data,n,p,i,f) {
np <- (n+1)*p
i <<- floor(np)
f <<- np - i
if (f==0) {
qvalue <- data[i]
} else {
if (f == 0.5) {
qvalue <- (data[i]+data[i+1])/2
} else {
if (f < 0.5) {
qvalue <- data[i]
} else {
qvalue <- data[i+1]
}
}
}
}
midmean <- function(x,def) {
x <-sort(x[!is.na(x)])
n<-length(x)
if (def==1) {
qvalue1 <- q1(x,n,0.25,i,f)
qvalue3 <- q1(x,n,0.75,i,f)
}
if (def==2) {
qvalue1 <- q2(x,n,0.25,i,f)
qvalue3 <- q2(x,n,0.75,i,f)
}
if (def==3) {
qvalue1 <- q3(x,n,0.25,i,f)
qvalue3 <- q3(x,n,0.75,i,f)
}
if (def==4) {
qvalue1 <- q4(x,n,0.25,i,f)
qvalue3 <- q4(x,n,0.75,i,f)
}
if (def==5) {
qvalue1 <- q5(x,n,0.25,i,f)
qvalue3 <- q5(x,n,0.75,i,f)
}
if (def==6) {
qvalue1 <- q6(x,n,0.25,i,f)
qvalue3 <- q6(x,n,0.75,i,f)
}
if (def==7) {
qvalue1 <- q7(x,n,0.25,i,f)
qvalue3 <- q7(x,n,0.75,i,f)
}
if (def==8) {
qvalue1 <- q8(x,n,0.25,i,f)
qvalue3 <- q8(x,n,0.75,i,f)
}
midm <- 0
myn <- 0
roundno4 <- round(n/4)
round3no4 <- round(3*n/4)
for (i in 1:n) {
if ((x[i]>=qvalue1) & (x[i]<=qvalue3)){
midm = midm + x[i]
myn = myn + 1
}
}
midm = midm / myn
return(midm)
}
(arm <- mean(x))
sqrtn <- sqrt(length(x))
(armse <- sd(x) / sqrtn)
(armose <- arm / armse)
(geo <- geomean(x))
(har <- harmean(x))
(qua <- quamean(x))
(win <- winmean(x))
(tri <- trimean(x))
(midr <- midrange(x))
midm <- array(NA,dim=8)
for (j in 1:8) midm[j] <- midmean(x,j)
midm
bitmap(file='test1.png')
lb <- win[,1] - 2*win[,2]
ub <- win[,1] + 2*win[,2]
if ((ylimmin == '') | (ylimmax == '')) plot(win[,1],type='b',main=main, xlab='j', pch=19, ylab='Winsorized Mean(j/n)', ylim=c(min(lb),max(ub))) else plot(win[,1],type='l',main=main, xlab='j', pch=19, ylab='Winsorized Mean(j/n)', ylim=c(ylimmin,ylimmax))
lines(ub,lty=3)
lines(lb,lty=3)
grid()
dev.off()
bitmap(file='test2.png')
lb <- tri[,1] - 2*tri[,2]
ub <- tri[,1] + 2*tri[,2]
if ((ylimmin == '') | (ylimmax == '')) plot(tri[,1],type='b',main=main, xlab='j', pch=19, ylab='Trimmed Mean(j/n)', ylim=c(min(lb),max(ub))) else plot(tri[,1],type='l',main=main, xlab='j', pch=19, ylab='Trimmed Mean(j/n)', ylim=c(ylimmin,ylimmax))
lines(ub,lty=3)
lines(lb,lty=3)
grid()
dev.off()
load(file='createtable')
a<-table.start()
a<-table.row.start(a)
a<-table.element(a,'Central Tendency - Ungrouped Data',4,TRUE)
a<-table.row.end(a)
a<-table.row.start(a)
a<-table.element(a,'Measure',header=TRUE)
a<-table.element(a,'Value',header=TRUE)
a<-table.element(a,'S.E.',header=TRUE)
a<-table.element(a,'Value/S.E.',header=TRUE)
a<-table.row.end(a)
a<-table.row.start(a)
a<-table.element(a,hyperlink('arithmetic_mean.htm', 'Arithmetic Mean', 'click to view the definition of the Arithmetic Mean'),header=TRUE)
a<-table.element(a,arm)
a<-table.element(a,hyperlink('arithmetic_mean_standard_error.htm', armse, 'click to view the definition of the Standard Error of the Arithmetic Mean'))
a<-table.element(a,armose)
a<-table.row.end(a)
a<-table.row.start(a)
a<-table.element(a,hyperlink('geometric_mean.htm', 'Geometric Mean', 'click to view the definition of the Geometric Mean'),header=TRUE)
a<-table.element(a,geo)
a<-table.element(a,'')
a<-table.row.end(a)
a<-table.row.start(a)
a<-table.element(a,hyperlink('harmonic_mean.htm', 'Harmonic Mean', 'click to view the definition of the Harmonic Mean'),header=TRUE)
a<-table.element(a,har)
a<-table.element(a,'')
a<-table.row.end(a)
a<-table.row.start(a)
a<-table.element(a,hyperlink('quadratic_mean.htm', 'Quadratic Mean', 'click to view the definition of the Quadratic Mean'),header=TRUE)
a<-table.element(a,qua)
a<-table.element(a,'')
a<-table.row.end(a)
for (j in 1:length(win[,1])) {
a<-table.row.start(a)
mylabel <- paste('Winsorized Mean (',j)
mylabel <- paste(mylabel,'/')
mylabel <- paste(mylabel,length(win[,1]))
mylabel <- paste(mylabel,')')
a<-table.element(a,hyperlink('winsorized_mean.htm', mylabel, 'click to view the definition of the Winsorized Mean'),header=TRUE)
a<-table.element(a,win[j,1])
a<-table.element(a,win[j,2])
a<-table.element(a,win[j,1]/win[j,2])
a<-table.row.end(a)
}
for (j in 1:length(tri[,1])) {
a<-table.row.start(a)
mylabel <- paste('Trimmed Mean (',j)
mylabel <- paste(mylabel,'/')
mylabel <- paste(mylabel,length(tri[,1]))
mylabel <- paste(mylabel,')')
a<-table.element(a,hyperlink('arithmetic_mean.htm', mylabel, 'click to view the definition of the Trimmed Mean'),header=TRUE)
a<-table.element(a,tri[j,1])
a<-table.element(a,tri[j,2])
a<-table.element(a,tri[j,1]/tri[j,2])
a<-table.row.end(a)
}
a<-table.row.start(a)
a<-table.element(a,hyperlink('median_1.htm', 'Median', 'click to view the definition of the Median'),header=TRUE)
a<-table.element(a,median(x))
a<-table.element(a,'')
a<-table.row.end(a)
a<-table.row.start(a)
a<-table.element(a,hyperlink('midrange.htm', 'Midrange', 'click to view the definition of the Midrange'),header=TRUE)
a<-table.element(a,midr)
a<-table.element(a,'')
a<-table.row.end(a)
a<-table.row.start(a)
mymid <- hyperlink('midmean.htm', 'Midmean', 'click to view the definition of the Midmean')
mylabel <- paste(mymid,hyperlink('method_1.htm','Weighted Average at Xnp',''),sep=' - ')
a<-table.element(a,mylabel,header=TRUE)
a<-table.element(a,midm[1])
a<-table.element(a,'')
a<-table.row.end(a)
a<-table.row.start(a)
mymid <- hyperlink('midmean.htm', 'Midmean', 'click to view the definition of the Midmean')
mylabel <- paste(mymid,hyperlink('method_2.htm','Weighted Average at X(n+1)p',''),sep=' - ')
a<-table.element(a,mylabel,header=TRUE)
a<-table.element(a,midm[2])
a<-table.element(a,'')
a<-table.row.end(a)
a<-table.row.start(a)
mymid <- hyperlink('midmean.htm', 'Midmean', 'click to view the definition of the Midmean')
mylabel <- paste(mymid,hyperlink('method_3.htm','Empirical Distribution Function',''),sep=' - ')
a<-table.element(a,mylabel,header=TRUE)
a<-table.element(a,midm[3])
a<-table.element(a,'')
a<-table.row.end(a)
a<-table.row.start(a)
mymid <- hyperlink('midmean.htm', 'Midmean', 'click to view the definition of the Midmean')
mylabel <- paste(mymid,hyperlink('method_4.htm','Empirical Distribution Function - Averaging',''),sep=' - ')
a<-table.element(a,mylabel,header=TRUE)
a<-table.element(a,midm[4])
a<-table.element(a,'')
a<-table.row.end(a)
a<-table.row.start(a)
mymid <- hyperlink('midmean.htm', 'Midmean', 'click to view the definition of the Midmean')
mylabel <- paste(mymid,hyperlink('method_5.htm','Empirical Distribution Function - Interpolation',''),sep=' - ')
a<-table.element(a,mylabel,header=TRUE)
a<-table.element(a,midm[5])
a<-table.element(a,'')
a<-table.row.end(a)
a<-table.row.start(a)
mymid <- hyperlink('midmean.htm', 'Midmean', 'click to view the definition of the Midmean')
mylabel <- paste(mymid,hyperlink('method_6.htm','Closest Observation',''),sep=' - ')
a<-table.element(a,mylabel,header=TRUE)
a<-table.element(a,midm[6])
a<-table.element(a,'')
a<-table.row.end(a)
a<-table.row.start(a)
mymid <- hyperlink('midmean.htm', 'Midmean', 'click to view the definition of the Midmean')
mylabel <- paste(mymid,hyperlink('method_7.htm','True Basic - Statistics Graphics Toolkit',''),sep=' - ')
a<-table.element(a,mylabel,header=TRUE)
a<-table.element(a,midm[7])
a<-table.element(a,'')
a<-table.row.end(a)
a<-table.row.start(a)
mymid <- hyperlink('midmean.htm', 'Midmean', 'click to view the definition of the Midmean')
mylabel <- paste(mymid,hyperlink('method_8.htm','MS Excel (old versions)',''),sep=' - ')
a<-table.element(a,mylabel,header=TRUE)
a<-table.element(a,midm[8])
a<-table.element(a,'')
a<-table.row.end(a)
a<-table.row.start(a)
a<-table.element(a,'Number of observations',header=TRUE)
a<-table.element(a,length(x))
a<-table.element(a,'')
a<-table.row.end(a)
a<-table.end(a)
table.save(a,file='mytable.tab')