Free Statistics

of Irreproducible Research!

Author's title

Author*Unverified author*
R Software Modulerwasp_centraltendency.wasp
Title produced by softwareCentral Tendency
Date of computationMon, 21 Apr 2008 08:48:57 -0600
Cite this page as followsStatistical Computations at FreeStatistics.org, Office for Research Development and Education, URL https://freestatistics.org/blog/index.php?v=date/2008/Apr/21/t1208789467fhwez702zzgda2n.htm/, Retrieved Thu, 16 May 2024 05:27:34 +0000
Statistical Computations at FreeStatistics.org, Office for Research Development and Education, URL https://freestatistics.org/blog/index.php?pk=10513, Retrieved Thu, 16 May 2024 05:27:34 +0000
QR Codes:

Original text written by user:
IsPrivate?No (this computation is public)
User-defined keywords
Estimated Impact237
Family? (F = Feedback message, R = changed R code, M = changed R Module, P = changed Parameters, D = changed Data)
-       [Central Tendency] [Centrummaten sina...] [2008-04-21 14:48:57] [7f4b1d09016442cbb55a129b1af5b7b8] [Current]
Feedback Forum

Post a new message
Dataseries X:
16.100
15.800
16.900
17.800
17.600
18.300
18.000
15.700
14.500
14.000
15.500
15.800
15.800
15.900
18.000
19.900
20.600
20.600
20.800
20.000
18.500
17.700
17.000
16.600
16.700
17.300
19.100
20.200
20.700
21.500
21.000
16.800
16.800
16.500
17.200
17.300
17.600
18.400
19.900
20.500
21.200
21.300
20.800
18.800
18.100
18.100
18.800
18.700
18.700
19.000
20.100
20.500
21.600
21.800
21.500
21.200
20.400
20.400
20.600
19.300
18.600
19.400
23.500
24.600
25.900
26.600
24.100
21.800
21.300
21.100
21.200
21.600


Summary of compuational transaction
Raw Inputview raw input (R code)
Raw Outputview raw output of R engine
Computing time1 seconds
R Server'George Udny Yule' @ 72.249.76.132

\begin{tabular}{lllllllll}
\hline
Summary of compuational transaction \tabularnewline
Raw Input & view raw input (R code)  \tabularnewline
Raw Output & view raw output of R engine  \tabularnewline
Computing time & 1 seconds \tabularnewline
R Server & 'George Udny Yule' @ 72.249.76.132 \tabularnewline
\hline
\end{tabular}
%Source: https://freestatistics.org/blog/index.php?pk=10513&T=0

[TABLE]
[ROW][C]Summary of compuational transaction[/C][/ROW]
[ROW][C]Raw Input[/C][C]view raw input (R code) [/C][/ROW]
[ROW][C]Raw Output[/C][C]view raw output of R engine [/C][/ROW]
[ROW][C]Computing time[/C][C]1 seconds[/C][/ROW]
[ROW][C]R Server[/C][C]'George Udny Yule' @ 72.249.76.132[/C][/ROW]
[/TABLE]
Source: https://freestatistics.org/blog/index.php?pk=10513&T=0

Globally Unique Identifier (entire table): ba.freestatistics.org/blog/index.php?pk=10513&T=0

As an alternative you can also use a QR Code:  

The GUIDs for individual cells are displayed in the table below:

Summary of compuational transaction
Raw Inputview raw input (R code)
Raw Outputview raw output of R engine
Computing time1 seconds
R Server'George Udny Yule' @ 72.249.76.132


Central Tendency - Ungrouped Data
MeasureValueS.E.Value/S.E.
Arithmetic Mean19.24305555555560.29954207610215764.2415776973945
Geometric Mean19.0803046483409
Harmonic Mean18.9197590674905
Quadratic Mean19.4078771235920
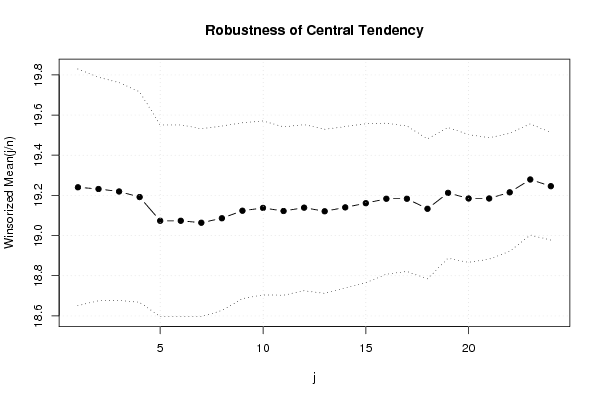
Winsorized Mean ( 1 / 24 )19.24027777777780.29466872013378465.2946053080978
Winsorized Mean ( 2 / 24 )19.23194444444440.27820424031734569.1288688573069
Winsorized Mean ( 3 / 24 )19.21944444444440.27118126000541770.8730553286039
Winsorized Mean ( 4 / 24 )19.19166666666670.26207721747344473.2290538326222
Winsorized Mean ( 5 / 24 )19.07361111111110.23872045004355379.8993597223498
Winsorized Mean ( 6 / 24 )19.07361111111110.23872045004355379.8993597223498
Winsorized Mean ( 7 / 24 )19.06388888888890.23380490204545281.537592762631
Winsorized Mean ( 8 / 24 )19.08611111111110.22965158303694683.1089899695599
Winsorized Mean ( 9 / 24 )19.12361111111110.21892550465096787.3521389917538
Winsorized Mean ( 10 / 24 )19.13750.21660740883408288.3510868949963
Winsorized Mean ( 11 / 24 )19.12222222222220.20951750053167091.2678996919006
Winsorized Mean ( 12 / 24 )19.13888888888890.20683314848644392.5329862690908
Winsorized Mean ( 13 / 24 )19.12083333333330.20420977795291993.6332898698987
Winsorized Mean ( 14 / 24 )19.14027777777780.20112807567715595.1646243983419
Winsorized Mean ( 15 / 24 )19.16111111111110.19789142345126996.8263847767488
Winsorized Mean ( 16 / 24 )19.18333333333330.187959140500409102.061188842750
Winsorized Mean ( 17 / 24 )19.18333333333330.181111159115560105.920217324065
Winsorized Mean ( 18 / 24 )19.13333333333330.174207348619365109.830804985952
Winsorized Mean ( 19 / 24 )19.21250.162806680631404118.008056705592
Winsorized Mean ( 20 / 24 )19.18472222222220.159034889064747120.632160245112
Winsorized Mean ( 21 / 24 )19.18472222222220.151087084846595126.977909737958
Winsorized Mean ( 22 / 24 )19.21527777777780.146898820243649130.806208966873
Winsorized Mean ( 23 / 24 )19.27916666666670.138400451786738139.299882462624
Winsorized Mean ( 24 / 24 )19.24583333333330.133961803761295143.666573552767
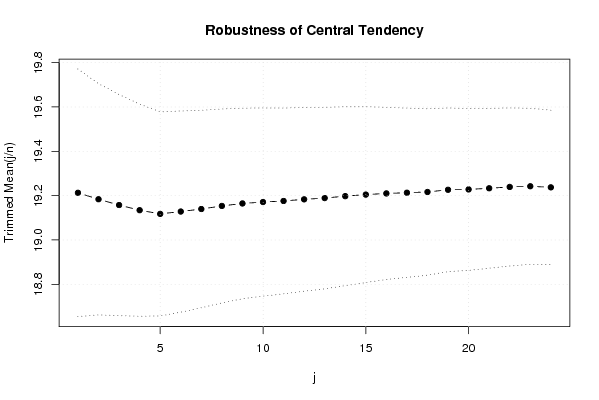
Trimmed Mean ( 1 / 24 )19.21285714285710.27938057355552368.7694813506382
Trimmed Mean ( 2 / 24 )19.18382352941180.26085402298734373.5423717438414
Trimmed Mean ( 3 / 24 )19.15757575757580.24950356870691376.7827725144877
Trimmed Mean ( 4 / 24 )19.1343750.23917246083490880.0024172231426
Trimmed Mean ( 5 / 24 )19.11774193548390.23021986356949983.0412356217586
Trimmed Mean ( 6 / 24 )19.12833333333330.22689368408898684.3052701538899
Trimmed Mean ( 7 / 24 )19.13965517241380.22273854651561085.9287962134227
Trimmed Mean ( 8 / 24 )19.15357142857140.21880674456167387.5364763866902
Trimmed Mean ( 9 / 24 )19.16481481481480.21487580160329189.1901957866682
Trimmed Mean ( 10 / 24 )19.17115384615380.21235120846137090.2804085037332
Trimmed Mean ( 11 / 24 )19.1760.20951956705661691.5236713658266
Trimmed Mean ( 12 / 24 )19.18333333333330.20725608010940792.5586034590966
Trimmed Mean ( 13 / 24 )19.18913043478260.20470854174054893.7387872124228
Trimmed Mean ( 14 / 24 )19.19772727272730.20172324824703995.168640399925
Trimmed Mean ( 15 / 24 )19.20476190476190.19827808054246796.8577154480204
Trimmed Mean ( 16 / 24 )19.210.19423749671009798.8995447602541
Trimmed Mean ( 17 / 24 )19.21315789473680.190908997730305100.640399997695
Trimmed Mean ( 18 / 24 )19.21666666666670.187696986470638102.381327628149
Trimmed Mean ( 19 / 24 )19.22647058823530.184531435497583104.190760432724
Trimmed Mean ( 20 / 24 )19.2281250.182623929143932105.288091709196
Trimmed Mean ( 21 / 24 )19.23333333333330.180250995714139106.703062899223
Trimmed Mean ( 22 / 24 )19.23928571428570.178347743499852107.875128312468
Trimmed Mean ( 23 / 24 )19.24230769230770.175952185543781109.361004143479
Trimmed Mean ( 24 / 24 )19.23750.174124362104390110.481381051474
Median19.05
Midrange20.3
Midmean - Weighted Average at Xnp19.1648648648649
Midmean - Weighted Average at X(n+1)p19.1648648648649
Midmean - Empirical Distribution Function19.1648648648649
Midmean - Empirical Distribution Function - Averaging19.1648648648649
Midmean - Empirical Distribution Function - Interpolation19.1648648648649
Midmean - Closest Observation19.1648648648649
Midmean - True Basic - Statistics Graphics Toolkit19.1648648648649
Midmean - MS Excel (old versions)19.2131578947368
Number of observations72

\begin{tabular}{lllllllll}
\hline
Central Tendency - Ungrouped Data \tabularnewline
Measure & Value & S.E. & Value/S.E. \tabularnewline
Arithmetic Mean & 19.2430555555556 & 0.299542076102157 & 64.2415776973945 \tabularnewline
Geometric Mean & 19.0803046483409 &  &  \tabularnewline
Harmonic Mean & 18.9197590674905 &  &  \tabularnewline
Quadratic Mean & 19.4078771235920 &  &  \tabularnewline
Winsorized Mean ( 1 / 24 ) & 19.2402777777778 & 0.294668720133784 & 65.2946053080978 \tabularnewline
Winsorized Mean ( 2 / 24 ) & 19.2319444444444 & 0.278204240317345 & 69.1288688573069 \tabularnewline
Winsorized Mean ( 3 / 24 ) & 19.2194444444444 & 0.271181260005417 & 70.8730553286039 \tabularnewline
Winsorized Mean ( 4 / 24 ) & 19.1916666666667 & 0.262077217473444 & 73.2290538326222 \tabularnewline
Winsorized Mean ( 5 / 24 ) & 19.0736111111111 & 0.238720450043553 & 79.8993597223498 \tabularnewline
Winsorized Mean ( 6 / 24 ) & 19.0736111111111 & 0.238720450043553 & 79.8993597223498 \tabularnewline
Winsorized Mean ( 7 / 24 ) & 19.0638888888889 & 0.233804902045452 & 81.537592762631 \tabularnewline
Winsorized Mean ( 8 / 24 ) & 19.0861111111111 & 0.229651583036946 & 83.1089899695599 \tabularnewline
Winsorized Mean ( 9 / 24 ) & 19.1236111111111 & 0.218925504650967 & 87.3521389917538 \tabularnewline
Winsorized Mean ( 10 / 24 ) & 19.1375 & 0.216607408834082 & 88.3510868949963 \tabularnewline
Winsorized Mean ( 11 / 24 ) & 19.1222222222222 & 0.209517500531670 & 91.2678996919006 \tabularnewline
Winsorized Mean ( 12 / 24 ) & 19.1388888888889 & 0.206833148486443 & 92.5329862690908 \tabularnewline
Winsorized Mean ( 13 / 24 ) & 19.1208333333333 & 0.204209777952919 & 93.6332898698987 \tabularnewline
Winsorized Mean ( 14 / 24 ) & 19.1402777777778 & 0.201128075677155 & 95.1646243983419 \tabularnewline
Winsorized Mean ( 15 / 24 ) & 19.1611111111111 & 0.197891423451269 & 96.8263847767488 \tabularnewline
Winsorized Mean ( 16 / 24 ) & 19.1833333333333 & 0.187959140500409 & 102.061188842750 \tabularnewline
Winsorized Mean ( 17 / 24 ) & 19.1833333333333 & 0.181111159115560 & 105.920217324065 \tabularnewline
Winsorized Mean ( 18 / 24 ) & 19.1333333333333 & 0.174207348619365 & 109.830804985952 \tabularnewline
Winsorized Mean ( 19 / 24 ) & 19.2125 & 0.162806680631404 & 118.008056705592 \tabularnewline
Winsorized Mean ( 20 / 24 ) & 19.1847222222222 & 0.159034889064747 & 120.632160245112 \tabularnewline
Winsorized Mean ( 21 / 24 ) & 19.1847222222222 & 0.151087084846595 & 126.977909737958 \tabularnewline
Winsorized Mean ( 22 / 24 ) & 19.2152777777778 & 0.146898820243649 & 130.806208966873 \tabularnewline
Winsorized Mean ( 23 / 24 ) & 19.2791666666667 & 0.138400451786738 & 139.299882462624 \tabularnewline
Winsorized Mean ( 24 / 24 ) & 19.2458333333333 & 0.133961803761295 & 143.666573552767 \tabularnewline
Trimmed Mean ( 1 / 24 ) & 19.2128571428571 & 0.279380573555523 & 68.7694813506382 \tabularnewline
Trimmed Mean ( 2 / 24 ) & 19.1838235294118 & 0.260854022987343 & 73.5423717438414 \tabularnewline
Trimmed Mean ( 3 / 24 ) & 19.1575757575758 & 0.249503568706913 & 76.7827725144877 \tabularnewline
Trimmed Mean ( 4 / 24 ) & 19.134375 & 0.239172460834908 & 80.0024172231426 \tabularnewline
Trimmed Mean ( 5 / 24 ) & 19.1177419354839 & 0.230219863569499 & 83.0412356217586 \tabularnewline
Trimmed Mean ( 6 / 24 ) & 19.1283333333333 & 0.226893684088986 & 84.3052701538899 \tabularnewline
Trimmed Mean ( 7 / 24 ) & 19.1396551724138 & 0.222738546515610 & 85.9287962134227 \tabularnewline
Trimmed Mean ( 8 / 24 ) & 19.1535714285714 & 0.218806744561673 & 87.5364763866902 \tabularnewline
Trimmed Mean ( 9 / 24 ) & 19.1648148148148 & 0.214875801603291 & 89.1901957866682 \tabularnewline
Trimmed Mean ( 10 / 24 ) & 19.1711538461538 & 0.212351208461370 & 90.2804085037332 \tabularnewline
Trimmed Mean ( 11 / 24 ) & 19.176 & 0.209519567056616 & 91.5236713658266 \tabularnewline
Trimmed Mean ( 12 / 24 ) & 19.1833333333333 & 0.207256080109407 & 92.5586034590966 \tabularnewline
Trimmed Mean ( 13 / 24 ) & 19.1891304347826 & 0.204708541740548 & 93.7387872124228 \tabularnewline
Trimmed Mean ( 14 / 24 ) & 19.1977272727273 & 0.201723248247039 & 95.168640399925 \tabularnewline
Trimmed Mean ( 15 / 24 ) & 19.2047619047619 & 0.198278080542467 & 96.8577154480204 \tabularnewline
Trimmed Mean ( 16 / 24 ) & 19.21 & 0.194237496710097 & 98.8995447602541 \tabularnewline
Trimmed Mean ( 17 / 24 ) & 19.2131578947368 & 0.190908997730305 & 100.640399997695 \tabularnewline
Trimmed Mean ( 18 / 24 ) & 19.2166666666667 & 0.187696986470638 & 102.381327628149 \tabularnewline
Trimmed Mean ( 19 / 24 ) & 19.2264705882353 & 0.184531435497583 & 104.190760432724 \tabularnewline
Trimmed Mean ( 20 / 24 ) & 19.228125 & 0.182623929143932 & 105.288091709196 \tabularnewline
Trimmed Mean ( 21 / 24 ) & 19.2333333333333 & 0.180250995714139 & 106.703062899223 \tabularnewline
Trimmed Mean ( 22 / 24 ) & 19.2392857142857 & 0.178347743499852 & 107.875128312468 \tabularnewline
Trimmed Mean ( 23 / 24 ) & 19.2423076923077 & 0.175952185543781 & 109.361004143479 \tabularnewline
Trimmed Mean ( 24 / 24 ) & 19.2375 & 0.174124362104390 & 110.481381051474 \tabularnewline
Median & 19.05 &  &  \tabularnewline
Midrange & 20.3 &  &  \tabularnewline
Midmean - Weighted Average at Xnp & 19.1648648648649 &  &  \tabularnewline
Midmean - Weighted Average at X(n+1)p & 19.1648648648649 &  &  \tabularnewline
Midmean - Empirical Distribution Function & 19.1648648648649 &  &  \tabularnewline
Midmean - Empirical Distribution Function - Averaging & 19.1648648648649 &  &  \tabularnewline
Midmean - Empirical Distribution Function - Interpolation & 19.1648648648649 &  &  \tabularnewline
Midmean - Closest Observation & 19.1648648648649 &  &  \tabularnewline
Midmean - True Basic - Statistics Graphics Toolkit & 19.1648648648649 &  &  \tabularnewline
Midmean - MS Excel (old versions) & 19.2131578947368 &  &  \tabularnewline
Number of observations & 72 &  &  \tabularnewline
\hline
\end{tabular}
%Source: https://freestatistics.org/blog/index.php?pk=10513&T=1

[TABLE]
[ROW][C]Central Tendency - Ungrouped Data[/C][/ROW]
[ROW][C]Measure[/C][C]Value[/C][C]S.E.[/C][C]Value/S.E.[/C][/ROW]
[ROW][C]Arithmetic Mean[/C][C]19.2430555555556[/C][C]0.299542076102157[/C][C]64.2415776973945[/C][/ROW]
[ROW][C]Geometric Mean[/C][C]19.0803046483409[/C][C][/C][C][/C][/ROW]
[ROW][C]Harmonic Mean[/C][C]18.9197590674905[/C][C][/C][C][/C][/ROW]
[ROW][C]Quadratic Mean[/C][C]19.4078771235920[/C][C][/C][C][/C][/ROW]
[ROW][C]Winsorized Mean ( 1 / 24 )[/C][C]19.2402777777778[/C][C]0.294668720133784[/C][C]65.2946053080978[/C][/ROW]
[ROW][C]Winsorized Mean ( 2 / 24 )[/C][C]19.2319444444444[/C][C]0.278204240317345[/C][C]69.1288688573069[/C][/ROW]
[ROW][C]Winsorized Mean ( 3 / 24 )[/C][C]19.2194444444444[/C][C]0.271181260005417[/C][C]70.8730553286039[/C][/ROW]
[ROW][C]Winsorized Mean ( 4 / 24 )[/C][C]19.1916666666667[/C][C]0.262077217473444[/C][C]73.2290538326222[/C][/ROW]
[ROW][C]Winsorized Mean ( 5 / 24 )[/C][C]19.0736111111111[/C][C]0.238720450043553[/C][C]79.8993597223498[/C][/ROW]
[ROW][C]Winsorized Mean ( 6 / 24 )[/C][C]19.0736111111111[/C][C]0.238720450043553[/C][C]79.8993597223498[/C][/ROW]
[ROW][C]Winsorized Mean ( 7 / 24 )[/C][C]19.0638888888889[/C][C]0.233804902045452[/C][C]81.537592762631[/C][/ROW]
[ROW][C]Winsorized Mean ( 8 / 24 )[/C][C]19.0861111111111[/C][C]0.229651583036946[/C][C]83.1089899695599[/C][/ROW]
[ROW][C]Winsorized Mean ( 9 / 24 )[/C][C]19.1236111111111[/C][C]0.218925504650967[/C][C]87.3521389917538[/C][/ROW]
[ROW][C]Winsorized Mean ( 10 / 24 )[/C][C]19.1375[/C][C]0.216607408834082[/C][C]88.3510868949963[/C][/ROW]
[ROW][C]Winsorized Mean ( 11 / 24 )[/C][C]19.1222222222222[/C][C]0.209517500531670[/C][C]91.2678996919006[/C][/ROW]
[ROW][C]Winsorized Mean ( 12 / 24 )[/C][C]19.1388888888889[/C][C]0.206833148486443[/C][C]92.5329862690908[/C][/ROW]
[ROW][C]Winsorized Mean ( 13 / 24 )[/C][C]19.1208333333333[/C][C]0.204209777952919[/C][C]93.6332898698987[/C][/ROW]
[ROW][C]Winsorized Mean ( 14 / 24 )[/C][C]19.1402777777778[/C][C]0.201128075677155[/C][C]95.1646243983419[/C][/ROW]
[ROW][C]Winsorized Mean ( 15 / 24 )[/C][C]19.1611111111111[/C][C]0.197891423451269[/C][C]96.8263847767488[/C][/ROW]
[ROW][C]Winsorized Mean ( 16 / 24 )[/C][C]19.1833333333333[/C][C]0.187959140500409[/C][C]102.061188842750[/C][/ROW]
[ROW][C]Winsorized Mean ( 17 / 24 )[/C][C]19.1833333333333[/C][C]0.181111159115560[/C][C]105.920217324065[/C][/ROW]
[ROW][C]Winsorized Mean ( 18 / 24 )[/C][C]19.1333333333333[/C][C]0.174207348619365[/C][C]109.830804985952[/C][/ROW]
[ROW][C]Winsorized Mean ( 19 / 24 )[/C][C]19.2125[/C][C]0.162806680631404[/C][C]118.008056705592[/C][/ROW]
[ROW][C]Winsorized Mean ( 20 / 24 )[/C][C]19.1847222222222[/C][C]0.159034889064747[/C][C]120.632160245112[/C][/ROW]
[ROW][C]Winsorized Mean ( 21 / 24 )[/C][C]19.1847222222222[/C][C]0.151087084846595[/C][C]126.977909737958[/C][/ROW]
[ROW][C]Winsorized Mean ( 22 / 24 )[/C][C]19.2152777777778[/C][C]0.146898820243649[/C][C]130.806208966873[/C][/ROW]
[ROW][C]Winsorized Mean ( 23 / 24 )[/C][C]19.2791666666667[/C][C]0.138400451786738[/C][C]139.299882462624[/C][/ROW]
[ROW][C]Winsorized Mean ( 24 / 24 )[/C][C]19.2458333333333[/C][C]0.133961803761295[/C][C]143.666573552767[/C][/ROW]
[ROW][C]Trimmed Mean ( 1 / 24 )[/C][C]19.2128571428571[/C][C]0.279380573555523[/C][C]68.7694813506382[/C][/ROW]
[ROW][C]Trimmed Mean ( 2 / 24 )[/C][C]19.1838235294118[/C][C]0.260854022987343[/C][C]73.5423717438414[/C][/ROW]
[ROW][C]Trimmed Mean ( 3 / 24 )[/C][C]19.1575757575758[/C][C]0.249503568706913[/C][C]76.7827725144877[/C][/ROW]
[ROW][C]Trimmed Mean ( 4 / 24 )[/C][C]19.134375[/C][C]0.239172460834908[/C][C]80.0024172231426[/C][/ROW]
[ROW][C]Trimmed Mean ( 5 / 24 )[/C][C]19.1177419354839[/C][C]0.230219863569499[/C][C]83.0412356217586[/C][/ROW]
[ROW][C]Trimmed Mean ( 6 / 24 )[/C][C]19.1283333333333[/C][C]0.226893684088986[/C][C]84.3052701538899[/C][/ROW]
[ROW][C]Trimmed Mean ( 7 / 24 )[/C][C]19.1396551724138[/C][C]0.222738546515610[/C][C]85.9287962134227[/C][/ROW]
[ROW][C]Trimmed Mean ( 8 / 24 )[/C][C]19.1535714285714[/C][C]0.218806744561673[/C][C]87.5364763866902[/C][/ROW]
[ROW][C]Trimmed Mean ( 9 / 24 )[/C][C]19.1648148148148[/C][C]0.214875801603291[/C][C]89.1901957866682[/C][/ROW]
[ROW][C]Trimmed Mean ( 10 / 24 )[/C][C]19.1711538461538[/C][C]0.212351208461370[/C][C]90.2804085037332[/C][/ROW]
[ROW][C]Trimmed Mean ( 11 / 24 )[/C][C]19.176[/C][C]0.209519567056616[/C][C]91.5236713658266[/C][/ROW]
[ROW][C]Trimmed Mean ( 12 / 24 )[/C][C]19.1833333333333[/C][C]0.207256080109407[/C][C]92.5586034590966[/C][/ROW]
[ROW][C]Trimmed Mean ( 13 / 24 )[/C][C]19.1891304347826[/C][C]0.204708541740548[/C][C]93.7387872124228[/C][/ROW]
[ROW][C]Trimmed Mean ( 14 / 24 )[/C][C]19.1977272727273[/C][C]0.201723248247039[/C][C]95.168640399925[/C][/ROW]
[ROW][C]Trimmed Mean ( 15 / 24 )[/C][C]19.2047619047619[/C][C]0.198278080542467[/C][C]96.8577154480204[/C][/ROW]
[ROW][C]Trimmed Mean ( 16 / 24 )[/C][C]19.21[/C][C]0.194237496710097[/C][C]98.8995447602541[/C][/ROW]
[ROW][C]Trimmed Mean ( 17 / 24 )[/C][C]19.2131578947368[/C][C]0.190908997730305[/C][C]100.640399997695[/C][/ROW]
[ROW][C]Trimmed Mean ( 18 / 24 )[/C][C]19.2166666666667[/C][C]0.187696986470638[/C][C]102.381327628149[/C][/ROW]
[ROW][C]Trimmed Mean ( 19 / 24 )[/C][C]19.2264705882353[/C][C]0.184531435497583[/C][C]104.190760432724[/C][/ROW]
[ROW][C]Trimmed Mean ( 20 / 24 )[/C][C]19.228125[/C][C]0.182623929143932[/C][C]105.288091709196[/C][/ROW]
[ROW][C]Trimmed Mean ( 21 / 24 )[/C][C]19.2333333333333[/C][C]0.180250995714139[/C][C]106.703062899223[/C][/ROW]
[ROW][C]Trimmed Mean ( 22 / 24 )[/C][C]19.2392857142857[/C][C]0.178347743499852[/C][C]107.875128312468[/C][/ROW]
[ROW][C]Trimmed Mean ( 23 / 24 )[/C][C]19.2423076923077[/C][C]0.175952185543781[/C][C]109.361004143479[/C][/ROW]
[ROW][C]Trimmed Mean ( 24 / 24 )[/C][C]19.2375[/C][C]0.174124362104390[/C][C]110.481381051474[/C][/ROW]
[ROW][C]Median[/C][C]19.05[/C][C][/C][C][/C][/ROW]
[ROW][C]Midrange[/C][C]20.3[/C][C][/C][C][/C][/ROW]
[ROW][C]Midmean - Weighted Average at Xnp[/C][C]19.1648648648649[/C][C][/C][C][/C][/ROW]
[ROW][C]Midmean - Weighted Average at X(n+1)p[/C][C]19.1648648648649[/C][C][/C][C][/C][/ROW]
[ROW][C]Midmean - Empirical Distribution Function[/C][C]19.1648648648649[/C][C][/C][C][/C][/ROW]
[ROW][C]Midmean - Empirical Distribution Function - Averaging[/C][C]19.1648648648649[/C][C][/C][C][/C][/ROW]
[ROW][C]Midmean - Empirical Distribution Function - Interpolation[/C][C]19.1648648648649[/C][C][/C][C][/C][/ROW]
[ROW][C]Midmean - Closest Observation[/C][C]19.1648648648649[/C][C][/C][C][/C][/ROW]
[ROW][C]Midmean - True Basic - Statistics Graphics Toolkit[/C][C]19.1648648648649[/C][C][/C][C][/C][/ROW]
[ROW][C]Midmean - MS Excel (old versions)[/C][C]19.2131578947368[/C][C][/C][C][/C][/ROW]
[ROW][C]Number of observations[/C][C]72[/C][C][/C][C][/C][/ROW]
[/TABLE]
Source: https://freestatistics.org/blog/index.php?pk=10513&T=1

Globally Unique Identifier (entire table): ba.freestatistics.org/blog/index.php?pk=10513&T=1

As an alternative you can also use a QR Code:  

The GUIDs for individual cells are displayed in the table below:

Central Tendency - Ungrouped Data
MeasureValueS.E.Value/S.E.
Arithmetic Mean19.24305555555560.29954207610215764.2415776973945
Geometric Mean19.0803046483409
Harmonic Mean18.9197590674905
Quadratic Mean19.4078771235920
Winsorized Mean ( 1 / 24 )19.24027777777780.29466872013378465.2946053080978
Winsorized Mean ( 2 / 24 )19.23194444444440.27820424031734569.1288688573069
Winsorized Mean ( 3 / 24 )19.21944444444440.27118126000541770.8730553286039
Winsorized Mean ( 4 / 24 )19.19166666666670.26207721747344473.2290538326222
Winsorized Mean ( 5 / 24 )19.07361111111110.23872045004355379.8993597223498
Winsorized Mean ( 6 / 24 )19.07361111111110.23872045004355379.8993597223498
Winsorized Mean ( 7 / 24 )19.06388888888890.23380490204545281.537592762631
Winsorized Mean ( 8 / 24 )19.08611111111110.22965158303694683.1089899695599
Winsorized Mean ( 9 / 24 )19.12361111111110.21892550465096787.3521389917538
Winsorized Mean ( 10 / 24 )19.13750.21660740883408288.3510868949963
Winsorized Mean ( 11 / 24 )19.12222222222220.20951750053167091.2678996919006
Winsorized Mean ( 12 / 24 )19.13888888888890.20683314848644392.5329862690908
Winsorized Mean ( 13 / 24 )19.12083333333330.20420977795291993.6332898698987
Winsorized Mean ( 14 / 24 )19.14027777777780.20112807567715595.1646243983419
Winsorized Mean ( 15 / 24 )19.16111111111110.19789142345126996.8263847767488
Winsorized Mean ( 16 / 24 )19.18333333333330.187959140500409102.061188842750
Winsorized Mean ( 17 / 24 )19.18333333333330.181111159115560105.920217324065
Winsorized Mean ( 18 / 24 )19.13333333333330.174207348619365109.830804985952
Winsorized Mean ( 19 / 24 )19.21250.162806680631404118.008056705592
Winsorized Mean ( 20 / 24 )19.18472222222220.159034889064747120.632160245112
Winsorized Mean ( 21 / 24 )19.18472222222220.151087084846595126.977909737958
Winsorized Mean ( 22 / 24 )19.21527777777780.146898820243649130.806208966873
Winsorized Mean ( 23 / 24 )19.27916666666670.138400451786738139.299882462624
Winsorized Mean ( 24 / 24 )19.24583333333330.133961803761295143.666573552767
Trimmed Mean ( 1 / 24 )19.21285714285710.27938057355552368.7694813506382
Trimmed Mean ( 2 / 24 )19.18382352941180.26085402298734373.5423717438414
Trimmed Mean ( 3 / 24 )19.15757575757580.24950356870691376.7827725144877
Trimmed Mean ( 4 / 24 )19.1343750.23917246083490880.0024172231426
Trimmed Mean ( 5 / 24 )19.11774193548390.23021986356949983.0412356217586
Trimmed Mean ( 6 / 24 )19.12833333333330.22689368408898684.3052701538899
Trimmed Mean ( 7 / 24 )19.13965517241380.22273854651561085.9287962134227
Trimmed Mean ( 8 / 24 )19.15357142857140.21880674456167387.5364763866902
Trimmed Mean ( 9 / 24 )19.16481481481480.21487580160329189.1901957866682
Trimmed Mean ( 10 / 24 )19.17115384615380.21235120846137090.2804085037332
Trimmed Mean ( 11 / 24 )19.1760.20951956705661691.5236713658266
Trimmed Mean ( 12 / 24 )19.18333333333330.20725608010940792.5586034590966
Trimmed Mean ( 13 / 24 )19.18913043478260.20470854174054893.7387872124228
Trimmed Mean ( 14 / 24 )19.19772727272730.20172324824703995.168640399925
Trimmed Mean ( 15 / 24 )19.20476190476190.19827808054246796.8577154480204
Trimmed Mean ( 16 / 24 )19.210.19423749671009798.8995447602541
Trimmed Mean ( 17 / 24 )19.21315789473680.190908997730305100.640399997695
Trimmed Mean ( 18 / 24 )19.21666666666670.187696986470638102.381327628149
Trimmed Mean ( 19 / 24 )19.22647058823530.184531435497583104.190760432724
Trimmed Mean ( 20 / 24 )19.2281250.182623929143932105.288091709196
Trimmed Mean ( 21 / 24 )19.23333333333330.180250995714139106.703062899223
Trimmed Mean ( 22 / 24 )19.23928571428570.178347743499852107.875128312468
Trimmed Mean ( 23 / 24 )19.24230769230770.175952185543781109.361004143479
Trimmed Mean ( 24 / 24 )19.23750.174124362104390110.481381051474
Median19.05
Midrange20.3
Midmean - Weighted Average at Xnp19.1648648648649
Midmean - Weighted Average at X(n+1)p19.1648648648649
Midmean - Empirical Distribution Function19.1648648648649
Midmean - Empirical Distribution Function - Averaging19.1648648648649
Midmean - Empirical Distribution Function - Interpolation19.1648648648649
Midmean - Closest Observation19.1648648648649
Midmean - True Basic - Statistics Graphics Toolkit19.1648648648649
Midmean - MS Excel (old versions)19.2131578947368
Number of observations72


Parameters (Session):
Parameters (R input):
R code (references can be found in the software module):
geomean <- function(x) {
return(exp(mean(log(x))))
}
harmean <- function(x) {
return(1/mean(1/x))
}
quamean <- function(x) {
return(sqrt(mean(x*x)))
}
winmean <- function(x) {
x <-sort(x[!is.na(x)])
n<-length(x)
denom <- 3
nodenom <- n/denom
if (nodenom>40) denom <- n/40
sqrtn = sqrt(n)
roundnodenom = floor(nodenom)
win <- array(NA,dim=c(roundnodenom,2))
for (j in 1:roundnodenom) {
win[j,1] <- (j*x[j+1]+sum(x[(j+1):(n-j)])+j*x[n-j])/n
win[j,2] <- sd(c(rep(x[j+1],j),x[(j+1):(n-j)],rep(x[n-j],j)))/sqrtn
}
return(win)
}
trimean <- function(x) {
x <-sort(x[!is.na(x)])
n<-length(x)
denom <- 3
nodenom <- n/denom
if (nodenom>40) denom <- n/40
sqrtn = sqrt(n)
roundnodenom = floor(nodenom)
tri <- array(NA,dim=c(roundnodenom,2))
for (j in 1:roundnodenom) {
tri[j,1] <- mean(x,trim=j/n)
tri[j,2] <- sd(x[(j+1):(n-j)]) / sqrt(n-j*2)
}
return(tri)
}
midrange <- function(x) {
return((max(x)+min(x))/2)
}
q1 <- function(data,n,p,i,f) {
np <- n*p;
i <<- floor(np)
f <<- np - i
qvalue <- (1-f)*data[i] + f*data[i+1]
}
q2 <- function(data,n,p,i,f) {
np <- (n+1)*p
i <<- floor(np)
f <<- np - i
qvalue <- (1-f)*data[i] + f*data[i+1]
}
q3 <- function(data,n,p,i,f) {
np <- n*p
i <<- floor(np)
f <<- np - i
if (f==0) {
qvalue <- data[i]
} else {
qvalue <- data[i+1]
}
}
q4 <- function(data,n,p,i,f) {
np <- n*p
i <<- floor(np)
f <<- np - i
if (f==0) {
qvalue <- (data[i]+data[i+1])/2
} else {
qvalue <- data[i+1]
}
}
q5 <- function(data,n,p,i,f) {
np <- (n-1)*p
i <<- floor(np)
f <<- np - i
if (f==0) {
qvalue <- data[i+1]
} else {
qvalue <- data[i+1] + f*(data[i+2]-data[i+1])
}
}
q6 <- function(data,n,p,i,f) {
np <- n*p+0.5
i <<- floor(np)
f <<- np - i
qvalue <- data[i]
}
q7 <- function(data,n,p,i,f) {
np <- (n+1)*p
i <<- floor(np)
f <<- np - i
if (f==0) {
qvalue <- data[i]
} else {
qvalue <- f*data[i] + (1-f)*data[i+1]
}
}
q8 <- function(data,n,p,i,f) {
np <- (n+1)*p
i <<- floor(np)
f <<- np - i
if (f==0) {
qvalue <- data[i]
} else {
if (f == 0.5) {
qvalue <- (data[i]+data[i+1])/2
} else {
if (f < 0.5) {
qvalue <- data[i]
} else {
qvalue <- data[i+1]
}
}
}
}
midmean <- function(x,def) {
x <-sort(x[!is.na(x)])
n<-length(x)
if (def==1) {
qvalue1 <- q1(x,n,0.25,i,f)
qvalue3 <- q1(x,n,0.75,i,f)
}
if (def==2) {
qvalue1 <- q2(x,n,0.25,i,f)
qvalue3 <- q2(x,n,0.75,i,f)
}
if (def==3) {
qvalue1 <- q3(x,n,0.25,i,f)
qvalue3 <- q3(x,n,0.75,i,f)
}
if (def==4) {
qvalue1 <- q4(x,n,0.25,i,f)
qvalue3 <- q4(x,n,0.75,i,f)
}
if (def==5) {
qvalue1 <- q5(x,n,0.25,i,f)
qvalue3 <- q5(x,n,0.75,i,f)
}
if (def==6) {
qvalue1 <- q6(x,n,0.25,i,f)
qvalue3 <- q6(x,n,0.75,i,f)
}
if (def==7) {
qvalue1 <- q7(x,n,0.25,i,f)
qvalue3 <- q7(x,n,0.75,i,f)
}
if (def==8) {
qvalue1 <- q8(x,n,0.25,i,f)
qvalue3 <- q8(x,n,0.75,i,f)
}
midm <- 0
myn <- 0
roundno4 <- round(n/4)
round3no4 <- round(3*n/4)
for (i in 1:n) {
if ((x[i]>=qvalue1) & (x[i]<=qvalue3)){
midm = midm + x[i]
myn = myn + 1
}
}
midm = midm / myn
return(midm)
}
(arm <- mean(x))
sqrtn <- sqrt(length(x))
(armse <- sd(x) / sqrtn)
(armose <- arm / armse)
(geo <- geomean(x))
(har <- harmean(x))
(qua <- quamean(x))
(win <- winmean(x))
(tri <- trimean(x))
(midr <- midrange(x))
midm <- array(NA,dim=8)
for (j in 1:8) midm[j] <- midmean(x,j)
midm
bitmap(file='test1.png')
lb <- win[,1] - 2*win[,2]
ub <- win[,1] + 2*win[,2]
if ((ylimmin == '') | (ylimmax == '')) plot(win[,1],type='b',main=main, xlab='j', pch=19, ylab='Winsorized Mean(j/n)', ylim=c(min(lb),max(ub))) else plot(win[,1],type='l',main=main, xlab='j', pch=19, ylab='Winsorized Mean(j/n)', ylim=c(ylimmin,ylimmax))
lines(ub,lty=3)
lines(lb,lty=3)
grid()
dev.off()
bitmap(file='test2.png')
lb <- tri[,1] - 2*tri[,2]
ub <- tri[,1] + 2*tri[,2]
if ((ylimmin == '') | (ylimmax == '')) plot(tri[,1],type='b',main=main, xlab='j', pch=19, ylab='Trimmed Mean(j/n)', ylim=c(min(lb),max(ub))) else plot(tri[,1],type='l',main=main, xlab='j', pch=19, ylab='Trimmed Mean(j/n)', ylim=c(ylimmin,ylimmax))
lines(ub,lty=3)
lines(lb,lty=3)
grid()
dev.off()
load(file='createtable')
a<-table.start()
a<-table.row.start(a)
a<-table.element(a,'Central Tendency - Ungrouped Data',4,TRUE)
a<-table.row.end(a)
a<-table.row.start(a)
a<-table.element(a,'Measure',header=TRUE)
a<-table.element(a,'Value',header=TRUE)
a<-table.element(a,'S.E.',header=TRUE)
a<-table.element(a,'Value/S.E.',header=TRUE)
a<-table.row.end(a)
a<-table.row.start(a)
a<-table.element(a,hyperlink('arithmetic_mean.htm', 'Arithmetic Mean', 'click to view the definition of the Arithmetic Mean'),header=TRUE)
a<-table.element(a,arm)
a<-table.element(a,hyperlink('arithmetic_mean_standard_error.htm', armse, 'click to view the definition of the Standard Error of the Arithmetic Mean'))
a<-table.element(a,armose)
a<-table.row.end(a)
a<-table.row.start(a)
a<-table.element(a,hyperlink('geometric_mean.htm', 'Geometric Mean', 'click to view the definition of the Geometric Mean'),header=TRUE)
a<-table.element(a,geo)
a<-table.element(a,'')
a<-table.row.end(a)
a<-table.row.start(a)
a<-table.element(a,hyperlink('harmonic_mean.htm', 'Harmonic Mean', 'click to view the definition of the Harmonic Mean'),header=TRUE)
a<-table.element(a,har)
a<-table.element(a,'')
a<-table.row.end(a)
a<-table.row.start(a)
a<-table.element(a,hyperlink('quadratic_mean.htm', 'Quadratic Mean', 'click to view the definition of the Quadratic Mean'),header=TRUE)
a<-table.element(a,qua)
a<-table.element(a,'')
a<-table.row.end(a)
for (j in 1:length(win[,1])) {
a<-table.row.start(a)
mylabel <- paste('Winsorized Mean (',j)
mylabel <- paste(mylabel,'/')
mylabel <- paste(mylabel,length(win[,1]))
mylabel <- paste(mylabel,')')
a<-table.element(a,hyperlink('winsorized_mean.htm', mylabel, 'click to view the definition of the Winsorized Mean'),header=TRUE)
a<-table.element(a,win[j,1])
a<-table.element(a,win[j,2])
a<-table.element(a,win[j,1]/win[j,2])
a<-table.row.end(a)
}
for (j in 1:length(tri[,1])) {
a<-table.row.start(a)
mylabel <- paste('Trimmed Mean (',j)
mylabel <- paste(mylabel,'/')
mylabel <- paste(mylabel,length(tri[,1]))
mylabel <- paste(mylabel,')')
a<-table.element(a,hyperlink('arithmetic_mean.htm', mylabel, 'click to view the definition of the Trimmed Mean'),header=TRUE)
a<-table.element(a,tri[j,1])
a<-table.element(a,tri[j,2])
a<-table.element(a,tri[j,1]/tri[j,2])
a<-table.row.end(a)
}
a<-table.row.start(a)
a<-table.element(a,hyperlink('median_1.htm', 'Median', 'click to view the definition of the Median'),header=TRUE)
a<-table.element(a,median(x))
a<-table.element(a,'')
a<-table.row.end(a)
a<-table.row.start(a)
a<-table.element(a,hyperlink('midrange.htm', 'Midrange', 'click to view the definition of the Midrange'),header=TRUE)
a<-table.element(a,midr)
a<-table.element(a,'')
a<-table.row.end(a)
a<-table.row.start(a)
mymid <- hyperlink('midmean.htm', 'Midmean', 'click to view the definition of the Midmean')
mylabel <- paste(mymid,hyperlink('method_1.htm','Weighted Average at Xnp',''),sep=' - ')
a<-table.element(a,mylabel,header=TRUE)
a<-table.element(a,midm[1])
a<-table.element(a,'')
a<-table.row.end(a)
a<-table.row.start(a)
mymid <- hyperlink('midmean.htm', 'Midmean', 'click to view the definition of the Midmean')
mylabel <- paste(mymid,hyperlink('method_2.htm','Weighted Average at X(n+1)p',''),sep=' - ')
a<-table.element(a,mylabel,header=TRUE)
a<-table.element(a,midm[2])
a<-table.element(a,'')
a<-table.row.end(a)
a<-table.row.start(a)
mymid <- hyperlink('midmean.htm', 'Midmean', 'click to view the definition of the Midmean')
mylabel <- paste(mymid,hyperlink('method_3.htm','Empirical Distribution Function',''),sep=' - ')
a<-table.element(a,mylabel,header=TRUE)
a<-table.element(a,midm[3])
a<-table.element(a,'')
a<-table.row.end(a)
a<-table.row.start(a)
mymid <- hyperlink('midmean.htm', 'Midmean', 'click to view the definition of the Midmean')
mylabel <- paste(mymid,hyperlink('method_4.htm','Empirical Distribution Function - Averaging',''),sep=' - ')
a<-table.element(a,mylabel,header=TRUE)
a<-table.element(a,midm[4])
a<-table.element(a,'')
a<-table.row.end(a)
a<-table.row.start(a)
mymid <- hyperlink('midmean.htm', 'Midmean', 'click to view the definition of the Midmean')
mylabel <- paste(mymid,hyperlink('method_5.htm','Empirical Distribution Function - Interpolation',''),sep=' - ')
a<-table.element(a,mylabel,header=TRUE)
a<-table.element(a,midm[5])
a<-table.element(a,'')
a<-table.row.end(a)
a<-table.row.start(a)
mymid <- hyperlink('midmean.htm', 'Midmean', 'click to view the definition of the Midmean')
mylabel <- paste(mymid,hyperlink('method_6.htm','Closest Observation',''),sep=' - ')
a<-table.element(a,mylabel,header=TRUE)
a<-table.element(a,midm[6])
a<-table.element(a,'')
a<-table.row.end(a)
a<-table.row.start(a)
mymid <- hyperlink('midmean.htm', 'Midmean', 'click to view the definition of the Midmean')
mylabel <- paste(mymid,hyperlink('method_7.htm','True Basic - Statistics Graphics Toolkit',''),sep=' - ')
a<-table.element(a,mylabel,header=TRUE)
a<-table.element(a,midm[7])
a<-table.element(a,'')
a<-table.row.end(a)
a<-table.row.start(a)
mymid <- hyperlink('midmean.htm', 'Midmean', 'click to view the definition of the Midmean')
mylabel <- paste(mymid,hyperlink('method_8.htm','MS Excel (old versions)',''),sep=' - ')
a<-table.element(a,mylabel,header=TRUE)
a<-table.element(a,midm[8])
a<-table.element(a,'')
a<-table.row.end(a)
a<-table.row.start(a)
a<-table.element(a,'Number of observations',header=TRUE)
a<-table.element(a,length(x))
a<-table.element(a,'')
a<-table.row.end(a)
a<-table.end(a)
table.save(a,file='mytable.tab')