Free Statistics

of Irreproducible Research!

Author's title

Author*Unverified author*
R Software Modulerwasp_centraltendency.wasp
Title produced by softwareCentral Tendency
Date of computationMon, 21 Apr 2008 02:45:25 -0600
Cite this page as followsStatistical Computations at FreeStatistics.org, Office for Research Development and Education, URL https://freestatistics.org/blog/index.php?v=date/2008/Apr/21/t1208767575u0x3de4qsj2zpss.htm/, Retrieved Thu, 16 May 2024 09:32:46 +0000
Statistical Computations at FreeStatistics.org, Office for Research Development and Education, URL https://freestatistics.org/blog/index.php?pk=10464, Retrieved Thu, 16 May 2024 09:32:46 +0000
QR Codes:

Original text written by user:
IsPrivate?No (this computation is public)
User-defined keywords
Estimated Impact242
Family? (F = Feedback message, R = changed R code, M = changed R Module, P = changed Parameters, D = changed Data)
-       [Central Tendency] [Eigenmaten] [2008-04-21 08:45:25] [8e49e33bff217c9d761ee51a4d4e5949] [Current]
Feedback Forum

Post a new message
Dataseries X:
2434
2637
1831
1851
1839
2609
2417
2394
2372
2717
2998
2538
3007
2475
2175
2465
2279
2323
2746
2601
2486
2718
2646
2551
2712
2606
2365
3533
3509
2912
3599
2719
2869
4085
2686
2545
3071
3388
2652
3190
2884
3295
3818
3226
3953
3810
2877
3515
3708
3450
3360
4098
4374
3703
4257
3487
3659
3904
2957
3320
3420
3500
2791
2919
3179
3016
3492
3034
2612
3525
2846
3212
2591


Summary of compuational transaction
Raw Inputview raw input (R code)
Raw Outputview raw output of R engine
Computing time1 seconds
R Server'Gwilym Jenkins' @ 72.249.127.135

\begin{tabular}{lllllllll}
\hline
Summary of compuational transaction \tabularnewline
Raw Input & view raw input (R code)  \tabularnewline
Raw Output & view raw output of R engine  \tabularnewline
Computing time & 1 seconds \tabularnewline
R Server & 'Gwilym Jenkins' @ 72.249.127.135 \tabularnewline
\hline
\end{tabular}
%Source: https://freestatistics.org/blog/index.php?pk=10464&T=0

[TABLE]
[ROW][C]Summary of compuational transaction[/C][/ROW]
[ROW][C]Raw Input[/C][C]view raw input (R code) [/C][/ROW]
[ROW][C]Raw Output[/C][C]view raw output of R engine [/C][/ROW]
[ROW][C]Computing time[/C][C]1 seconds[/C][/ROW]
[ROW][C]R Server[/C][C]'Gwilym Jenkins' @ 72.249.127.135[/C][/ROW]
[/TABLE]
Source: https://freestatistics.org/blog/index.php?pk=10464&T=0

Globally Unique Identifier (entire table): ba.freestatistics.org/blog/index.php?pk=10464&T=0

As an alternative you can also use a QR Code:  

The GUIDs for individual cells are displayed in the table below:

Summary of compuational transaction
Raw Inputview raw input (R code)
Raw Outputview raw output of R engine
Computing time1 seconds
R Server'Gwilym Jenkins' @ 72.249.127.135


Central Tendency - Ungrouped Data
MeasureValueS.E.Value/S.E.
Arithmetic Mean3004.6849315068567.945339849562744.2220899646613
Geometric Mean2949.16068961325
Harmonic Mean2893.28767625999
Quadratic Mean3059.49742940698
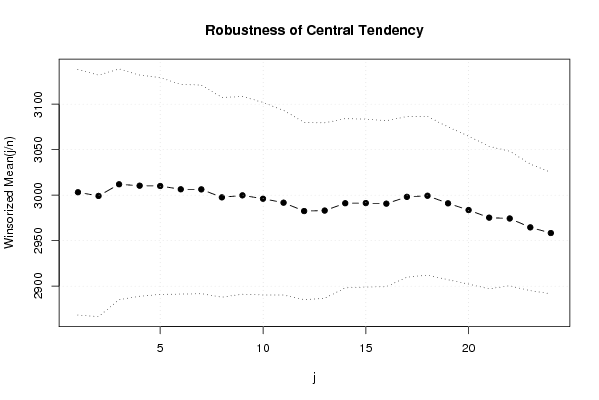
Winsorized Mean ( 1 / 24 )3003.1917808219267.48792004634644.4996938527597
Winsorized Mean ( 2 / 24 )2999.1643835616466.345461976289545.205267914684
Winsorized Mean ( 3 / 24 )3011.9452054794563.391603482554447.5133146980317
Winsorized Mean ( 4 / 24 )3010.4109589041160.760833872511749.545254188258
Winsorized Mean ( 5 / 24 )3010.0684931506859.555850157336750.5419448332714
Winsorized Mean ( 6 / 24 )3006.4520547945257.582724692961652.2110072217893
Winsorized Mean ( 7 / 24 )3006.3561643835657.329461779468352.439985847909
Winsorized Mean ( 8 / 24 )2997.5890410958954.86488119544954.6358431073125
Winsorized Mean ( 9 / 24 )2999.8082191780854.326125168044855.2185198171027
Winsorized Mean ( 10 / 24 )2996.1095890411052.914427780069456.6217894577631
Winsorized Mean ( 11 / 24 )2991.739726027450.693197164270959.0165918384017
Winsorized Mean ( 12 / 24 )2982.5342465753448.700460065334761.2424244570603
Winsorized Mean ( 13 / 24 )2983.0684931506848.195304914659761.8954169588274
Winsorized Mean ( 14 / 24 )2991.1232876712346.505793100807564.3172191728367
Winsorized Mean ( 15 / 24 )2991.3287671232946.119253692846464.8607366252172
Winsorized Mean ( 16 / 24 )2990.6712328767145.636234797383765.5328215869414
Winsorized Mean ( 17 / 24 )2998.1232876712344.126556031331767.9437408517094
Winsorized Mean ( 18 / 24 )2999.3561643835643.620650794628968.7600049459344
Winsorized Mean ( 19 / 24 )2991.0273972602741.976065753233371.2555439293375
Winsorized Mean ( 20 / 24 )2983.630136986340.633854880181373.4271987185132
Winsorized Mean ( 21 / 24 )2975.2876712328839.162568907624975.9727401501896
Winsorized Mean ( 22 / 24 )2974.3835616438436.970573421829580.452730005199
Winsorized Mean ( 23 / 24 )2964.6164383561634.80351255769385.1815296930672
Winsorized Mean ( 24 / 24 )2958.369863013733.394079960775788.5896502161032
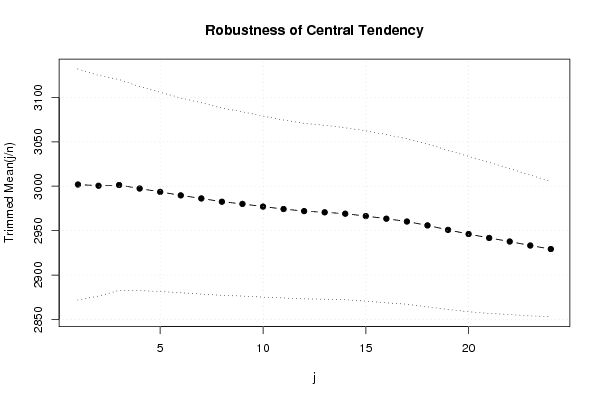
Trimmed Mean ( 1 / 24 )3001.9295774647965.02064158844446.1688704406496
Trimmed Mean ( 2 / 24 )3000.5942028985562.082121584862548.3326620659527
Trimmed Mean ( 3 / 24 )3001.3731343283659.315314837904450.6003068942725
Trimmed Mean ( 4 / 24 )2997.4153846153857.386580833530452.2319911916416
Trimmed Mean ( 5 / 24 )2993.6507936507956.046663128954553.4135419759581
Trimmed Mean ( 6 / 24 )2989.7213114754154.797661247745854.5592867177046
Trimmed Mean ( 7 / 24 )2986.2711864406853.82278120866655.4834053421204
Trimmed Mean ( 8 / 24 )2982.5964912280752.674509224917556.6231472322321
Trimmed Mean ( 9 / 24 )2980.1090909090951.84650794098857.4794563657222
Trimmed Mean ( 10 / 24 )2977.0943396226450.911127096427158.4762999645233
Trimmed Mean ( 11 / 24 )2974.3725490196150.031636742414859.4498349980634
Trimmed Mean ( 12 / 24 )2972.0204081632749.371814801212660.1967017037881
Trimmed Mean ( 13 / 24 )2970.6595744680848.907417648181360.7404708185109
Trimmed Mean ( 14 / 24 )2969.1111111111148.351973649273361.4062030362588
Trimmed Mean ( 15 / 24 )2966.4418604651247.906970830779461.9208814296233
Trimmed Mean ( 16 / 24 )2963.4878048780547.322004394789962.623885923233
Trimmed Mean ( 17 / 24 )2960.3076923076946.570541357487963.5661000713644
Trimmed Mean ( 18 / 24 )2955.9189189189245.80270685803564.5359002052162
Trimmed Mean ( 19 / 24 )2950.8857142857144.772867898761565.9079003149436
Trimmed Mean ( 20 / 24 )2946.2121212121243.700767917975567.4178569754664
Trimmed Mean ( 21 / 24 )2941.8064516129042.475987380976869.25810635612
Trimmed Mean ( 22 / 24 )2937.7931034482841.069248839877671.5326719244918
Trimmed Mean ( 23 / 24 )2933.2962962963039.59023789767374.0914036404087
Trimmed Mean ( 24 / 24 )2929.3238.031378272859577.0237665062604
Median2912
Midrange3102.5
Midmean - Weighted Average at Xnp2941.16666666667
Midmean - Weighted Average at X(n+1)p2955.91891891892
Midmean - Empirical Distribution Function2955.91891891892
Midmean - Empirical Distribution Function - Averaging2955.91891891892
Midmean - Empirical Distribution Function - Interpolation2955.91891891892
Midmean - Closest Observation2946.31578947368
Midmean - True Basic - Statistics Graphics Toolkit2955.91891891892
Midmean - MS Excel (old versions)2955.91891891892
Number of observations73

\begin{tabular}{lllllllll}
\hline
Central Tendency - Ungrouped Data \tabularnewline
Measure & Value & S.E. & Value/S.E. \tabularnewline
Arithmetic Mean & 3004.68493150685 & 67.9453398495627 & 44.2220899646613 \tabularnewline
Geometric Mean & 2949.16068961325 &  &  \tabularnewline
Harmonic Mean & 2893.28767625999 &  &  \tabularnewline
Quadratic Mean & 3059.49742940698 &  &  \tabularnewline
Winsorized Mean ( 1 / 24 ) & 3003.19178082192 & 67.487920046346 & 44.4996938527597 \tabularnewline
Winsorized Mean ( 2 / 24 ) & 2999.16438356164 & 66.3454619762895 & 45.205267914684 \tabularnewline
Winsorized Mean ( 3 / 24 ) & 3011.94520547945 & 63.3916034825544 & 47.5133146980317 \tabularnewline
Winsorized Mean ( 4 / 24 ) & 3010.41095890411 & 60.7608338725117 & 49.545254188258 \tabularnewline
Winsorized Mean ( 5 / 24 ) & 3010.06849315068 & 59.5558501573367 & 50.5419448332714 \tabularnewline
Winsorized Mean ( 6 / 24 ) & 3006.45205479452 & 57.5827246929616 & 52.2110072217893 \tabularnewline
Winsorized Mean ( 7 / 24 ) & 3006.35616438356 & 57.3294617794683 & 52.439985847909 \tabularnewline
Winsorized Mean ( 8 / 24 ) & 2997.58904109589 & 54.864881195449 & 54.6358431073125 \tabularnewline
Winsorized Mean ( 9 / 24 ) & 2999.80821917808 & 54.3261251680448 & 55.2185198171027 \tabularnewline
Winsorized Mean ( 10 / 24 ) & 2996.10958904110 & 52.9144277800694 & 56.6217894577631 \tabularnewline
Winsorized Mean ( 11 / 24 ) & 2991.7397260274 & 50.6931971642709 & 59.0165918384017 \tabularnewline
Winsorized Mean ( 12 / 24 ) & 2982.53424657534 & 48.7004600653347 & 61.2424244570603 \tabularnewline
Winsorized Mean ( 13 / 24 ) & 2983.06849315068 & 48.1953049146597 & 61.8954169588274 \tabularnewline
Winsorized Mean ( 14 / 24 ) & 2991.12328767123 & 46.5057931008075 & 64.3172191728367 \tabularnewline
Winsorized Mean ( 15 / 24 ) & 2991.32876712329 & 46.1192536928464 & 64.8607366252172 \tabularnewline
Winsorized Mean ( 16 / 24 ) & 2990.67123287671 & 45.6362347973837 & 65.5328215869414 \tabularnewline
Winsorized Mean ( 17 / 24 ) & 2998.12328767123 & 44.1265560313317 & 67.9437408517094 \tabularnewline
Winsorized Mean ( 18 / 24 ) & 2999.35616438356 & 43.6206507946289 & 68.7600049459344 \tabularnewline
Winsorized Mean ( 19 / 24 ) & 2991.02739726027 & 41.9760657532333 & 71.2555439293375 \tabularnewline
Winsorized Mean ( 20 / 24 ) & 2983.6301369863 & 40.6338548801813 & 73.4271987185132 \tabularnewline
Winsorized Mean ( 21 / 24 ) & 2975.28767123288 & 39.1625689076249 & 75.9727401501896 \tabularnewline
Winsorized Mean ( 22 / 24 ) & 2974.38356164384 & 36.9705734218295 & 80.452730005199 \tabularnewline
Winsorized Mean ( 23 / 24 ) & 2964.61643835616 & 34.803512557693 & 85.1815296930672 \tabularnewline
Winsorized Mean ( 24 / 24 ) & 2958.3698630137 & 33.3940799607757 & 88.5896502161032 \tabularnewline
Trimmed Mean ( 1 / 24 ) & 3001.92957746479 & 65.020641588444 & 46.1688704406496 \tabularnewline
Trimmed Mean ( 2 / 24 ) & 3000.59420289855 & 62.0821215848625 & 48.3326620659527 \tabularnewline
Trimmed Mean ( 3 / 24 ) & 3001.37313432836 & 59.3153148379044 & 50.6003068942725 \tabularnewline
Trimmed Mean ( 4 / 24 ) & 2997.41538461538 & 57.3865808335304 & 52.2319911916416 \tabularnewline
Trimmed Mean ( 5 / 24 ) & 2993.65079365079 & 56.0466631289545 & 53.4135419759581 \tabularnewline
Trimmed Mean ( 6 / 24 ) & 2989.72131147541 & 54.7976612477458 & 54.5592867177046 \tabularnewline
Trimmed Mean ( 7 / 24 ) & 2986.27118644068 & 53.822781208666 & 55.4834053421204 \tabularnewline
Trimmed Mean ( 8 / 24 ) & 2982.59649122807 & 52.6745092249175 & 56.6231472322321 \tabularnewline
Trimmed Mean ( 9 / 24 ) & 2980.10909090909 & 51.846507940988 & 57.4794563657222 \tabularnewline
Trimmed Mean ( 10 / 24 ) & 2977.09433962264 & 50.9111270964271 & 58.4762999645233 \tabularnewline
Trimmed Mean ( 11 / 24 ) & 2974.37254901961 & 50.0316367424148 & 59.4498349980634 \tabularnewline
Trimmed Mean ( 12 / 24 ) & 2972.02040816327 & 49.3718148012126 & 60.1967017037881 \tabularnewline
Trimmed Mean ( 13 / 24 ) & 2970.65957446808 & 48.9074176481813 & 60.7404708185109 \tabularnewline
Trimmed Mean ( 14 / 24 ) & 2969.11111111111 & 48.3519736492733 & 61.4062030362588 \tabularnewline
Trimmed Mean ( 15 / 24 ) & 2966.44186046512 & 47.9069708307794 & 61.9208814296233 \tabularnewline
Trimmed Mean ( 16 / 24 ) & 2963.48780487805 & 47.3220043947899 & 62.623885923233 \tabularnewline
Trimmed Mean ( 17 / 24 ) & 2960.30769230769 & 46.5705413574879 & 63.5661000713644 \tabularnewline
Trimmed Mean ( 18 / 24 ) & 2955.91891891892 & 45.802706858035 & 64.5359002052162 \tabularnewline
Trimmed Mean ( 19 / 24 ) & 2950.88571428571 & 44.7728678987615 & 65.9079003149436 \tabularnewline
Trimmed Mean ( 20 / 24 ) & 2946.21212121212 & 43.7007679179755 & 67.4178569754664 \tabularnewline
Trimmed Mean ( 21 / 24 ) & 2941.80645161290 & 42.4759873809768 & 69.25810635612 \tabularnewline
Trimmed Mean ( 22 / 24 ) & 2937.79310344828 & 41.0692488398776 & 71.5326719244918 \tabularnewline
Trimmed Mean ( 23 / 24 ) & 2933.29629629630 & 39.590237897673 & 74.0914036404087 \tabularnewline
Trimmed Mean ( 24 / 24 ) & 2929.32 & 38.0313782728595 & 77.0237665062604 \tabularnewline
Median & 2912 &  &  \tabularnewline
Midrange & 3102.5 &  &  \tabularnewline
Midmean - Weighted Average at Xnp & 2941.16666666667 &  &  \tabularnewline
Midmean - Weighted Average at X(n+1)p & 2955.91891891892 &  &  \tabularnewline
Midmean - Empirical Distribution Function & 2955.91891891892 &  &  \tabularnewline
Midmean - Empirical Distribution Function - Averaging & 2955.91891891892 &  &  \tabularnewline
Midmean - Empirical Distribution Function - Interpolation & 2955.91891891892 &  &  \tabularnewline
Midmean - Closest Observation & 2946.31578947368 &  &  \tabularnewline
Midmean - True Basic - Statistics Graphics Toolkit & 2955.91891891892 &  &  \tabularnewline
Midmean - MS Excel (old versions) & 2955.91891891892 &  &  \tabularnewline
Number of observations & 73 &  &  \tabularnewline
\hline
\end{tabular}
%Source: https://freestatistics.org/blog/index.php?pk=10464&T=1

[TABLE]
[ROW][C]Central Tendency - Ungrouped Data[/C][/ROW]
[ROW][C]Measure[/C][C]Value[/C][C]S.E.[/C][C]Value/S.E.[/C][/ROW]
[ROW][C]Arithmetic Mean[/C][C]3004.68493150685[/C][C]67.9453398495627[/C][C]44.2220899646613[/C][/ROW]
[ROW][C]Geometric Mean[/C][C]2949.16068961325[/C][C][/C][C][/C][/ROW]
[ROW][C]Harmonic Mean[/C][C]2893.28767625999[/C][C][/C][C][/C][/ROW]
[ROW][C]Quadratic Mean[/C][C]3059.49742940698[/C][C][/C][C][/C][/ROW]
[ROW][C]Winsorized Mean ( 1 / 24 )[/C][C]3003.19178082192[/C][C]67.487920046346[/C][C]44.4996938527597[/C][/ROW]
[ROW][C]Winsorized Mean ( 2 / 24 )[/C][C]2999.16438356164[/C][C]66.3454619762895[/C][C]45.205267914684[/C][/ROW]
[ROW][C]Winsorized Mean ( 3 / 24 )[/C][C]3011.94520547945[/C][C]63.3916034825544[/C][C]47.5133146980317[/C][/ROW]
[ROW][C]Winsorized Mean ( 4 / 24 )[/C][C]3010.41095890411[/C][C]60.7608338725117[/C][C]49.545254188258[/C][/ROW]
[ROW][C]Winsorized Mean ( 5 / 24 )[/C][C]3010.06849315068[/C][C]59.5558501573367[/C][C]50.5419448332714[/C][/ROW]
[ROW][C]Winsorized Mean ( 6 / 24 )[/C][C]3006.45205479452[/C][C]57.5827246929616[/C][C]52.2110072217893[/C][/ROW]
[ROW][C]Winsorized Mean ( 7 / 24 )[/C][C]3006.35616438356[/C][C]57.3294617794683[/C][C]52.439985847909[/C][/ROW]
[ROW][C]Winsorized Mean ( 8 / 24 )[/C][C]2997.58904109589[/C][C]54.864881195449[/C][C]54.6358431073125[/C][/ROW]
[ROW][C]Winsorized Mean ( 9 / 24 )[/C][C]2999.80821917808[/C][C]54.3261251680448[/C][C]55.2185198171027[/C][/ROW]
[ROW][C]Winsorized Mean ( 10 / 24 )[/C][C]2996.10958904110[/C][C]52.9144277800694[/C][C]56.6217894577631[/C][/ROW]
[ROW][C]Winsorized Mean ( 11 / 24 )[/C][C]2991.7397260274[/C][C]50.6931971642709[/C][C]59.0165918384017[/C][/ROW]
[ROW][C]Winsorized Mean ( 12 / 24 )[/C][C]2982.53424657534[/C][C]48.7004600653347[/C][C]61.2424244570603[/C][/ROW]
[ROW][C]Winsorized Mean ( 13 / 24 )[/C][C]2983.06849315068[/C][C]48.1953049146597[/C][C]61.8954169588274[/C][/ROW]
[ROW][C]Winsorized Mean ( 14 / 24 )[/C][C]2991.12328767123[/C][C]46.5057931008075[/C][C]64.3172191728367[/C][/ROW]
[ROW][C]Winsorized Mean ( 15 / 24 )[/C][C]2991.32876712329[/C][C]46.1192536928464[/C][C]64.8607366252172[/C][/ROW]
[ROW][C]Winsorized Mean ( 16 / 24 )[/C][C]2990.67123287671[/C][C]45.6362347973837[/C][C]65.5328215869414[/C][/ROW]
[ROW][C]Winsorized Mean ( 17 / 24 )[/C][C]2998.12328767123[/C][C]44.1265560313317[/C][C]67.9437408517094[/C][/ROW]
[ROW][C]Winsorized Mean ( 18 / 24 )[/C][C]2999.35616438356[/C][C]43.6206507946289[/C][C]68.7600049459344[/C][/ROW]
[ROW][C]Winsorized Mean ( 19 / 24 )[/C][C]2991.02739726027[/C][C]41.9760657532333[/C][C]71.2555439293375[/C][/ROW]
[ROW][C]Winsorized Mean ( 20 / 24 )[/C][C]2983.6301369863[/C][C]40.6338548801813[/C][C]73.4271987185132[/C][/ROW]
[ROW][C]Winsorized Mean ( 21 / 24 )[/C][C]2975.28767123288[/C][C]39.1625689076249[/C][C]75.9727401501896[/C][/ROW]
[ROW][C]Winsorized Mean ( 22 / 24 )[/C][C]2974.38356164384[/C][C]36.9705734218295[/C][C]80.452730005199[/C][/ROW]
[ROW][C]Winsorized Mean ( 23 / 24 )[/C][C]2964.61643835616[/C][C]34.803512557693[/C][C]85.1815296930672[/C][/ROW]
[ROW][C]Winsorized Mean ( 24 / 24 )[/C][C]2958.3698630137[/C][C]33.3940799607757[/C][C]88.5896502161032[/C][/ROW]
[ROW][C]Trimmed Mean ( 1 / 24 )[/C][C]3001.92957746479[/C][C]65.020641588444[/C][C]46.1688704406496[/C][/ROW]
[ROW][C]Trimmed Mean ( 2 / 24 )[/C][C]3000.59420289855[/C][C]62.0821215848625[/C][C]48.3326620659527[/C][/ROW]
[ROW][C]Trimmed Mean ( 3 / 24 )[/C][C]3001.37313432836[/C][C]59.3153148379044[/C][C]50.6003068942725[/C][/ROW]
[ROW][C]Trimmed Mean ( 4 / 24 )[/C][C]2997.41538461538[/C][C]57.3865808335304[/C][C]52.2319911916416[/C][/ROW]
[ROW][C]Trimmed Mean ( 5 / 24 )[/C][C]2993.65079365079[/C][C]56.0466631289545[/C][C]53.4135419759581[/C][/ROW]
[ROW][C]Trimmed Mean ( 6 / 24 )[/C][C]2989.72131147541[/C][C]54.7976612477458[/C][C]54.5592867177046[/C][/ROW]
[ROW][C]Trimmed Mean ( 7 / 24 )[/C][C]2986.27118644068[/C][C]53.822781208666[/C][C]55.4834053421204[/C][/ROW]
[ROW][C]Trimmed Mean ( 8 / 24 )[/C][C]2982.59649122807[/C][C]52.6745092249175[/C][C]56.6231472322321[/C][/ROW]
[ROW][C]Trimmed Mean ( 9 / 24 )[/C][C]2980.10909090909[/C][C]51.846507940988[/C][C]57.4794563657222[/C][/ROW]
[ROW][C]Trimmed Mean ( 10 / 24 )[/C][C]2977.09433962264[/C][C]50.9111270964271[/C][C]58.4762999645233[/C][/ROW]
[ROW][C]Trimmed Mean ( 11 / 24 )[/C][C]2974.37254901961[/C][C]50.0316367424148[/C][C]59.4498349980634[/C][/ROW]
[ROW][C]Trimmed Mean ( 12 / 24 )[/C][C]2972.02040816327[/C][C]49.3718148012126[/C][C]60.1967017037881[/C][/ROW]
[ROW][C]Trimmed Mean ( 13 / 24 )[/C][C]2970.65957446808[/C][C]48.9074176481813[/C][C]60.7404708185109[/C][/ROW]
[ROW][C]Trimmed Mean ( 14 / 24 )[/C][C]2969.11111111111[/C][C]48.3519736492733[/C][C]61.4062030362588[/C][/ROW]
[ROW][C]Trimmed Mean ( 15 / 24 )[/C][C]2966.44186046512[/C][C]47.9069708307794[/C][C]61.9208814296233[/C][/ROW]
[ROW][C]Trimmed Mean ( 16 / 24 )[/C][C]2963.48780487805[/C][C]47.3220043947899[/C][C]62.623885923233[/C][/ROW]
[ROW][C]Trimmed Mean ( 17 / 24 )[/C][C]2960.30769230769[/C][C]46.5705413574879[/C][C]63.5661000713644[/C][/ROW]
[ROW][C]Trimmed Mean ( 18 / 24 )[/C][C]2955.91891891892[/C][C]45.802706858035[/C][C]64.5359002052162[/C][/ROW]
[ROW][C]Trimmed Mean ( 19 / 24 )[/C][C]2950.88571428571[/C][C]44.7728678987615[/C][C]65.9079003149436[/C][/ROW]
[ROW][C]Trimmed Mean ( 20 / 24 )[/C][C]2946.21212121212[/C][C]43.7007679179755[/C][C]67.4178569754664[/C][/ROW]
[ROW][C]Trimmed Mean ( 21 / 24 )[/C][C]2941.80645161290[/C][C]42.4759873809768[/C][C]69.25810635612[/C][/ROW]
[ROW][C]Trimmed Mean ( 22 / 24 )[/C][C]2937.79310344828[/C][C]41.0692488398776[/C][C]71.5326719244918[/C][/ROW]
[ROW][C]Trimmed Mean ( 23 / 24 )[/C][C]2933.29629629630[/C][C]39.590237897673[/C][C]74.0914036404087[/C][/ROW]
[ROW][C]Trimmed Mean ( 24 / 24 )[/C][C]2929.32[/C][C]38.0313782728595[/C][C]77.0237665062604[/C][/ROW]
[ROW][C]Median[/C][C]2912[/C][C][/C][C][/C][/ROW]
[ROW][C]Midrange[/C][C]3102.5[/C][C][/C][C][/C][/ROW]
[ROW][C]Midmean - Weighted Average at Xnp[/C][C]2941.16666666667[/C][C][/C][C][/C][/ROW]
[ROW][C]Midmean - Weighted Average at X(n+1)p[/C][C]2955.91891891892[/C][C][/C][C][/C][/ROW]
[ROW][C]Midmean - Empirical Distribution Function[/C][C]2955.91891891892[/C][C][/C][C][/C][/ROW]
[ROW][C]Midmean - Empirical Distribution Function - Averaging[/C][C]2955.91891891892[/C][C][/C][C][/C][/ROW]
[ROW][C]Midmean - Empirical Distribution Function - Interpolation[/C][C]2955.91891891892[/C][C][/C][C][/C][/ROW]
[ROW][C]Midmean - Closest Observation[/C][C]2946.31578947368[/C][C][/C][C][/C][/ROW]
[ROW][C]Midmean - True Basic - Statistics Graphics Toolkit[/C][C]2955.91891891892[/C][C][/C][C][/C][/ROW]
[ROW][C]Midmean - MS Excel (old versions)[/C][C]2955.91891891892[/C][C][/C][C][/C][/ROW]
[ROW][C]Number of observations[/C][C]73[/C][C][/C][C][/C][/ROW]
[/TABLE]
Source: https://freestatistics.org/blog/index.php?pk=10464&T=1

Globally Unique Identifier (entire table): ba.freestatistics.org/blog/index.php?pk=10464&T=1

As an alternative you can also use a QR Code:  

The GUIDs for individual cells are displayed in the table below:

Central Tendency - Ungrouped Data
MeasureValueS.E.Value/S.E.
Arithmetic Mean3004.6849315068567.945339849562744.2220899646613
Geometric Mean2949.16068961325
Harmonic Mean2893.28767625999
Quadratic Mean3059.49742940698
Winsorized Mean ( 1 / 24 )3003.1917808219267.48792004634644.4996938527597
Winsorized Mean ( 2 / 24 )2999.1643835616466.345461976289545.205267914684
Winsorized Mean ( 3 / 24 )3011.9452054794563.391603482554447.5133146980317
Winsorized Mean ( 4 / 24 )3010.4109589041160.760833872511749.545254188258
Winsorized Mean ( 5 / 24 )3010.0684931506859.555850157336750.5419448332714
Winsorized Mean ( 6 / 24 )3006.4520547945257.582724692961652.2110072217893
Winsorized Mean ( 7 / 24 )3006.3561643835657.329461779468352.439985847909
Winsorized Mean ( 8 / 24 )2997.5890410958954.86488119544954.6358431073125
Winsorized Mean ( 9 / 24 )2999.8082191780854.326125168044855.2185198171027
Winsorized Mean ( 10 / 24 )2996.1095890411052.914427780069456.6217894577631
Winsorized Mean ( 11 / 24 )2991.739726027450.693197164270959.0165918384017
Winsorized Mean ( 12 / 24 )2982.5342465753448.700460065334761.2424244570603
Winsorized Mean ( 13 / 24 )2983.0684931506848.195304914659761.8954169588274
Winsorized Mean ( 14 / 24 )2991.1232876712346.505793100807564.3172191728367
Winsorized Mean ( 15 / 24 )2991.3287671232946.119253692846464.8607366252172
Winsorized Mean ( 16 / 24 )2990.6712328767145.636234797383765.5328215869414
Winsorized Mean ( 17 / 24 )2998.1232876712344.126556031331767.9437408517094
Winsorized Mean ( 18 / 24 )2999.3561643835643.620650794628968.7600049459344
Winsorized Mean ( 19 / 24 )2991.0273972602741.976065753233371.2555439293375
Winsorized Mean ( 20 / 24 )2983.630136986340.633854880181373.4271987185132
Winsorized Mean ( 21 / 24 )2975.2876712328839.162568907624975.9727401501896
Winsorized Mean ( 22 / 24 )2974.3835616438436.970573421829580.452730005199
Winsorized Mean ( 23 / 24 )2964.6164383561634.80351255769385.1815296930672
Winsorized Mean ( 24 / 24 )2958.369863013733.394079960775788.5896502161032
Trimmed Mean ( 1 / 24 )3001.9295774647965.02064158844446.1688704406496
Trimmed Mean ( 2 / 24 )3000.5942028985562.082121584862548.3326620659527
Trimmed Mean ( 3 / 24 )3001.3731343283659.315314837904450.6003068942725
Trimmed Mean ( 4 / 24 )2997.4153846153857.386580833530452.2319911916416
Trimmed Mean ( 5 / 24 )2993.6507936507956.046663128954553.4135419759581
Trimmed Mean ( 6 / 24 )2989.7213114754154.797661247745854.5592867177046
Trimmed Mean ( 7 / 24 )2986.2711864406853.82278120866655.4834053421204
Trimmed Mean ( 8 / 24 )2982.5964912280752.674509224917556.6231472322321
Trimmed Mean ( 9 / 24 )2980.1090909090951.84650794098857.4794563657222
Trimmed Mean ( 10 / 24 )2977.0943396226450.911127096427158.4762999645233
Trimmed Mean ( 11 / 24 )2974.3725490196150.031636742414859.4498349980634
Trimmed Mean ( 12 / 24 )2972.0204081632749.371814801212660.1967017037881
Trimmed Mean ( 13 / 24 )2970.6595744680848.907417648181360.7404708185109
Trimmed Mean ( 14 / 24 )2969.1111111111148.351973649273361.4062030362588
Trimmed Mean ( 15 / 24 )2966.4418604651247.906970830779461.9208814296233
Trimmed Mean ( 16 / 24 )2963.4878048780547.322004394789962.623885923233
Trimmed Mean ( 17 / 24 )2960.3076923076946.570541357487963.5661000713644
Trimmed Mean ( 18 / 24 )2955.9189189189245.80270685803564.5359002052162
Trimmed Mean ( 19 / 24 )2950.8857142857144.772867898761565.9079003149436
Trimmed Mean ( 20 / 24 )2946.2121212121243.700767917975567.4178569754664
Trimmed Mean ( 21 / 24 )2941.8064516129042.475987380976869.25810635612
Trimmed Mean ( 22 / 24 )2937.7931034482841.069248839877671.5326719244918
Trimmed Mean ( 23 / 24 )2933.2962962963039.59023789767374.0914036404087
Trimmed Mean ( 24 / 24 )2929.3238.031378272859577.0237665062604
Median2912
Midrange3102.5
Midmean - Weighted Average at Xnp2941.16666666667
Midmean - Weighted Average at X(n+1)p2955.91891891892
Midmean - Empirical Distribution Function2955.91891891892
Midmean - Empirical Distribution Function - Averaging2955.91891891892
Midmean - Empirical Distribution Function - Interpolation2955.91891891892
Midmean - Closest Observation2946.31578947368
Midmean - True Basic - Statistics Graphics Toolkit2955.91891891892
Midmean - MS Excel (old versions)2955.91891891892
Number of observations73


Parameters (Session):
Parameters (R input):
R code (references can be found in the software module):
geomean <- function(x) {
return(exp(mean(log(x))))
}
harmean <- function(x) {
return(1/mean(1/x))
}
quamean <- function(x) {
return(sqrt(mean(x*x)))
}
winmean <- function(x) {
x <-sort(x[!is.na(x)])
n<-length(x)
denom <- 3
nodenom <- n/denom
if (nodenom>40) denom <- n/40
sqrtn = sqrt(n)
roundnodenom = floor(nodenom)
win <- array(NA,dim=c(roundnodenom,2))
for (j in 1:roundnodenom) {
win[j,1] <- (j*x[j+1]+sum(x[(j+1):(n-j)])+j*x[n-j])/n
win[j,2] <- sd(c(rep(x[j+1],j),x[(j+1):(n-j)],rep(x[n-j],j)))/sqrtn
}
return(win)
}
trimean <- function(x) {
x <-sort(x[!is.na(x)])
n<-length(x)
denom <- 3
nodenom <- n/denom
if (nodenom>40) denom <- n/40
sqrtn = sqrt(n)
roundnodenom = floor(nodenom)
tri <- array(NA,dim=c(roundnodenom,2))
for (j in 1:roundnodenom) {
tri[j,1] <- mean(x,trim=j/n)
tri[j,2] <- sd(x[(j+1):(n-j)]) / sqrt(n-j*2)
}
return(tri)
}
midrange <- function(x) {
return((max(x)+min(x))/2)
}
q1 <- function(data,n,p,i,f) {
np <- n*p;
i <<- floor(np)
f <<- np - i
qvalue <- (1-f)*data[i] + f*data[i+1]
}
q2 <- function(data,n,p,i,f) {
np <- (n+1)*p
i <<- floor(np)
f <<- np - i
qvalue <- (1-f)*data[i] + f*data[i+1]
}
q3 <- function(data,n,p,i,f) {
np <- n*p
i <<- floor(np)
f <<- np - i
if (f==0) {
qvalue <- data[i]
} else {
qvalue <- data[i+1]
}
}
q4 <- function(data,n,p,i,f) {
np <- n*p
i <<- floor(np)
f <<- np - i
if (f==0) {
qvalue <- (data[i]+data[i+1])/2
} else {
qvalue <- data[i+1]
}
}
q5 <- function(data,n,p,i,f) {
np <- (n-1)*p
i <<- floor(np)
f <<- np - i
if (f==0) {
qvalue <- data[i+1]
} else {
qvalue <- data[i+1] + f*(data[i+2]-data[i+1])
}
}
q6 <- function(data,n,p,i,f) {
np <- n*p+0.5
i <<- floor(np)
f <<- np - i
qvalue <- data[i]
}
q7 <- function(data,n,p,i,f) {
np <- (n+1)*p
i <<- floor(np)
f <<- np - i
if (f==0) {
qvalue <- data[i]
} else {
qvalue <- f*data[i] + (1-f)*data[i+1]
}
}
q8 <- function(data,n,p,i,f) {
np <- (n+1)*p
i <<- floor(np)
f <<- np - i
if (f==0) {
qvalue <- data[i]
} else {
if (f == 0.5) {
qvalue <- (data[i]+data[i+1])/2
} else {
if (f < 0.5) {
qvalue <- data[i]
} else {
qvalue <- data[i+1]
}
}
}
}
midmean <- function(x,def) {
x <-sort(x[!is.na(x)])
n<-length(x)
if (def==1) {
qvalue1 <- q1(x,n,0.25,i,f)
qvalue3 <- q1(x,n,0.75,i,f)
}
if (def==2) {
qvalue1 <- q2(x,n,0.25,i,f)
qvalue3 <- q2(x,n,0.75,i,f)
}
if (def==3) {
qvalue1 <- q3(x,n,0.25,i,f)
qvalue3 <- q3(x,n,0.75,i,f)
}
if (def==4) {
qvalue1 <- q4(x,n,0.25,i,f)
qvalue3 <- q4(x,n,0.75,i,f)
}
if (def==5) {
qvalue1 <- q5(x,n,0.25,i,f)
qvalue3 <- q5(x,n,0.75,i,f)
}
if (def==6) {
qvalue1 <- q6(x,n,0.25,i,f)
qvalue3 <- q6(x,n,0.75,i,f)
}
if (def==7) {
qvalue1 <- q7(x,n,0.25,i,f)
qvalue3 <- q7(x,n,0.75,i,f)
}
if (def==8) {
qvalue1 <- q8(x,n,0.25,i,f)
qvalue3 <- q8(x,n,0.75,i,f)
}
midm <- 0
myn <- 0
roundno4 <- round(n/4)
round3no4 <- round(3*n/4)
for (i in 1:n) {
if ((x[i]>=qvalue1) & (x[i]<=qvalue3)){
midm = midm + x[i]
myn = myn + 1
}
}
midm = midm / myn
return(midm)
}
(arm <- mean(x))
sqrtn <- sqrt(length(x))
(armse <- sd(x) / sqrtn)
(armose <- arm / armse)
(geo <- geomean(x))
(har <- harmean(x))
(qua <- quamean(x))
(win <- winmean(x))
(tri <- trimean(x))
(midr <- midrange(x))
midm <- array(NA,dim=8)
for (j in 1:8) midm[j] <- midmean(x,j)
midm
bitmap(file='test1.png')
lb <- win[,1] - 2*win[,2]
ub <- win[,1] + 2*win[,2]
if ((ylimmin == '') | (ylimmax == '')) plot(win[,1],type='b',main=main, xlab='j', pch=19, ylab='Winsorized Mean(j/n)', ylim=c(min(lb),max(ub))) else plot(win[,1],type='l',main=main, xlab='j', pch=19, ylab='Winsorized Mean(j/n)', ylim=c(ylimmin,ylimmax))
lines(ub,lty=3)
lines(lb,lty=3)
grid()
dev.off()
bitmap(file='test2.png')
lb <- tri[,1] - 2*tri[,2]
ub <- tri[,1] + 2*tri[,2]
if ((ylimmin == '') | (ylimmax == '')) plot(tri[,1],type='b',main=main, xlab='j', pch=19, ylab='Trimmed Mean(j/n)', ylim=c(min(lb),max(ub))) else plot(tri[,1],type='l',main=main, xlab='j', pch=19, ylab='Trimmed Mean(j/n)', ylim=c(ylimmin,ylimmax))
lines(ub,lty=3)
lines(lb,lty=3)
grid()
dev.off()
load(file='createtable')
a<-table.start()
a<-table.row.start(a)
a<-table.element(a,'Central Tendency - Ungrouped Data',4,TRUE)
a<-table.row.end(a)
a<-table.row.start(a)
a<-table.element(a,'Measure',header=TRUE)
a<-table.element(a,'Value',header=TRUE)
a<-table.element(a,'S.E.',header=TRUE)
a<-table.element(a,'Value/S.E.',header=TRUE)
a<-table.row.end(a)
a<-table.row.start(a)
a<-table.element(a,hyperlink('arithmetic_mean.htm', 'Arithmetic Mean', 'click to view the definition of the Arithmetic Mean'),header=TRUE)
a<-table.element(a,arm)
a<-table.element(a,hyperlink('arithmetic_mean_standard_error.htm', armse, 'click to view the definition of the Standard Error of the Arithmetic Mean'))
a<-table.element(a,armose)
a<-table.row.end(a)
a<-table.row.start(a)
a<-table.element(a,hyperlink('geometric_mean.htm', 'Geometric Mean', 'click to view the definition of the Geometric Mean'),header=TRUE)
a<-table.element(a,geo)
a<-table.element(a,'')
a<-table.row.end(a)
a<-table.row.start(a)
a<-table.element(a,hyperlink('harmonic_mean.htm', 'Harmonic Mean', 'click to view the definition of the Harmonic Mean'),header=TRUE)
a<-table.element(a,har)
a<-table.element(a,'')
a<-table.row.end(a)
a<-table.row.start(a)
a<-table.element(a,hyperlink('quadratic_mean.htm', 'Quadratic Mean', 'click to view the definition of the Quadratic Mean'),header=TRUE)
a<-table.element(a,qua)
a<-table.element(a,'')
a<-table.row.end(a)
for (j in 1:length(win[,1])) {
a<-table.row.start(a)
mylabel <- paste('Winsorized Mean (',j)
mylabel <- paste(mylabel,'/')
mylabel <- paste(mylabel,length(win[,1]))
mylabel <- paste(mylabel,')')
a<-table.element(a,hyperlink('winsorized_mean.htm', mylabel, 'click to view the definition of the Winsorized Mean'),header=TRUE)
a<-table.element(a,win[j,1])
a<-table.element(a,win[j,2])
a<-table.element(a,win[j,1]/win[j,2])
a<-table.row.end(a)
}
for (j in 1:length(tri[,1])) {
a<-table.row.start(a)
mylabel <- paste('Trimmed Mean (',j)
mylabel <- paste(mylabel,'/')
mylabel <- paste(mylabel,length(tri[,1]))
mylabel <- paste(mylabel,')')
a<-table.element(a,hyperlink('arithmetic_mean.htm', mylabel, 'click to view the definition of the Trimmed Mean'),header=TRUE)
a<-table.element(a,tri[j,1])
a<-table.element(a,tri[j,2])
a<-table.element(a,tri[j,1]/tri[j,2])
a<-table.row.end(a)
}
a<-table.row.start(a)
a<-table.element(a,hyperlink('median_1.htm', 'Median', 'click to view the definition of the Median'),header=TRUE)
a<-table.element(a,median(x))
a<-table.element(a,'')
a<-table.row.end(a)
a<-table.row.start(a)
a<-table.element(a,hyperlink('midrange.htm', 'Midrange', 'click to view the definition of the Midrange'),header=TRUE)
a<-table.element(a,midr)
a<-table.element(a,'')
a<-table.row.end(a)
a<-table.row.start(a)
mymid <- hyperlink('midmean.htm', 'Midmean', 'click to view the definition of the Midmean')
mylabel <- paste(mymid,hyperlink('method_1.htm','Weighted Average at Xnp',''),sep=' - ')
a<-table.element(a,mylabel,header=TRUE)
a<-table.element(a,midm[1])
a<-table.element(a,'')
a<-table.row.end(a)
a<-table.row.start(a)
mymid <- hyperlink('midmean.htm', 'Midmean', 'click to view the definition of the Midmean')
mylabel <- paste(mymid,hyperlink('method_2.htm','Weighted Average at X(n+1)p',''),sep=' - ')
a<-table.element(a,mylabel,header=TRUE)
a<-table.element(a,midm[2])
a<-table.element(a,'')
a<-table.row.end(a)
a<-table.row.start(a)
mymid <- hyperlink('midmean.htm', 'Midmean', 'click to view the definition of the Midmean')
mylabel <- paste(mymid,hyperlink('method_3.htm','Empirical Distribution Function',''),sep=' - ')
a<-table.element(a,mylabel,header=TRUE)
a<-table.element(a,midm[3])
a<-table.element(a,'')
a<-table.row.end(a)
a<-table.row.start(a)
mymid <- hyperlink('midmean.htm', 'Midmean', 'click to view the definition of the Midmean')
mylabel <- paste(mymid,hyperlink('method_4.htm','Empirical Distribution Function - Averaging',''),sep=' - ')
a<-table.element(a,mylabel,header=TRUE)
a<-table.element(a,midm[4])
a<-table.element(a,'')
a<-table.row.end(a)
a<-table.row.start(a)
mymid <- hyperlink('midmean.htm', 'Midmean', 'click to view the definition of the Midmean')
mylabel <- paste(mymid,hyperlink('method_5.htm','Empirical Distribution Function - Interpolation',''),sep=' - ')
a<-table.element(a,mylabel,header=TRUE)
a<-table.element(a,midm[5])
a<-table.element(a,'')
a<-table.row.end(a)
a<-table.row.start(a)
mymid <- hyperlink('midmean.htm', 'Midmean', 'click to view the definition of the Midmean')
mylabel <- paste(mymid,hyperlink('method_6.htm','Closest Observation',''),sep=' - ')
a<-table.element(a,mylabel,header=TRUE)
a<-table.element(a,midm[6])
a<-table.element(a,'')
a<-table.row.end(a)
a<-table.row.start(a)
mymid <- hyperlink('midmean.htm', 'Midmean', 'click to view the definition of the Midmean')
mylabel <- paste(mymid,hyperlink('method_7.htm','True Basic - Statistics Graphics Toolkit',''),sep=' - ')
a<-table.element(a,mylabel,header=TRUE)
a<-table.element(a,midm[7])
a<-table.element(a,'')
a<-table.row.end(a)
a<-table.row.start(a)
mymid <- hyperlink('midmean.htm', 'Midmean', 'click to view the definition of the Midmean')
mylabel <- paste(mymid,hyperlink('method_8.htm','MS Excel (old versions)',''),sep=' - ')
a<-table.element(a,mylabel,header=TRUE)
a<-table.element(a,midm[8])
a<-table.element(a,'')
a<-table.row.end(a)
a<-table.row.start(a)
a<-table.element(a,'Number of observations',header=TRUE)
a<-table.element(a,length(x))
a<-table.element(a,'')
a<-table.row.end(a)
a<-table.end(a)
table.save(a,file='mytable.tab')