Free Statistics

of Irreproducible Research!

Author's title

Author*Unverified author*
R Software Modulerwasp_centraltendency.wasp
Title produced by softwareCentral Tendency
Date of computationSun, 21 Oct 2007 05:22:13 -0700
Cite this page as followsStatistical Computations at FreeStatistics.org, Office for Research Development and Education, URL https://freestatistics.org/blog/index.php?v=date/2007/Oct/21/oqbne80dfxjjfhi1192969314.htm/, Retrieved Thu, 09 May 2024 19:18:43 +0000
Statistical Computations at FreeStatistics.org, Office for Research Development and Education, URL https://freestatistics.org/blog/index.php?pk=1274, Retrieved Thu, 09 May 2024 19:18:43 +0000
QR Codes:

Original text written by user:
IsPrivate?No (this computation is public)
User-defined keywordsWS2Q9BASISMETAAL
Estimated Impact157
Family? (F = Feedback message, R = changed R code, M = changed R Module, P = changed Parameters, D = changed Data)
-       [Central Tendency] [WS2Q9BASISMETAAL] [2007-10-21 12:22:13] [e0964b90cb3acfe235da067e79729c23] [Current]
Feedback Forum

Post a new message
Dataseries X:
2,354
2,318
2,25
2,219
2,206
2,146
2,212
2,243
2,275
2,291
2,141
2,134
2,18
2,183
2,169
2,132
2,092
2,069
2,099
2,073
2,051
2,082
2,059
2,101
2,158
2,153
2,145
2,149
2,135
2,097
2,143
2,13
2,132
2,142
2,094
2,147
2,203
2,244
2,26
2,254
2,231
2,211
2,209
2,191
2,21
2,257
2,252
2,266
2,264
2,265
2,255
2,28
2,288
2,284
2,282
2,271
2,296
2,303
2,316
2,325
2,415
2,402
2,425
2,4
2,424
2,393
2,419
2,415
2,425
2,421
2,378
2,364


Summary of compuational transaction
Raw Inputview raw input (R code)
Raw Outputview raw output of R engine
Computing time1 seconds
R Server'Gwilym Jenkins' @ 72.249.127.135

\begin{tabular}{lllllllll}
\hline
Summary of compuational transaction \tabularnewline
Raw Input & view raw input (R code)  \tabularnewline
Raw Output & view raw output of R engine  \tabularnewline
Computing time & 1 seconds \tabularnewline
R Server & 'Gwilym Jenkins' @ 72.249.127.135 \tabularnewline
\hline
\end{tabular}
%Source: https://freestatistics.org/blog/index.php?pk=1274&T=0

[TABLE]
[ROW][C]Summary of compuational transaction[/C][/ROW]
[ROW][C]Raw Input[/C][C]view raw input (R code) [/C][/ROW]
[ROW][C]Raw Output[/C][C]view raw output of R engine [/C][/ROW]
[ROW][C]Computing time[/C][C]1 seconds[/C][/ROW]
[ROW][C]R Server[/C][C]'Gwilym Jenkins' @ 72.249.127.135[/C][/ROW]
[/TABLE]
Source: https://freestatistics.org/blog/index.php?pk=1274&T=0

Globally Unique Identifier (entire table): ba.freestatistics.org/blog/index.php?pk=1274&T=0

As an alternative you can also use a QR Code:  

The GUIDs for individual cells are displayed in the table below:

Summary of compuational transaction
Raw Inputview raw input (R code)
Raw Outputview raw output of R engine
Computing time1 seconds
R Server'Gwilym Jenkins' @ 72.249.127.135


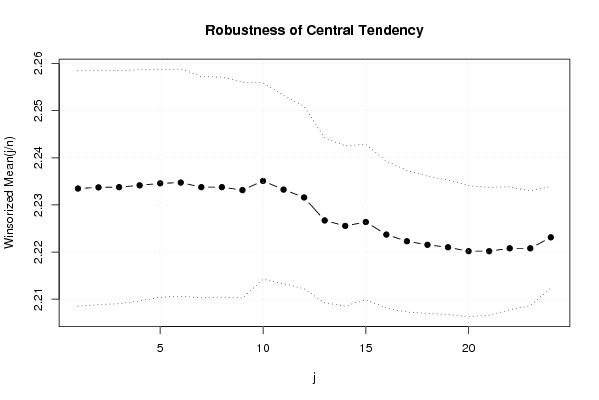
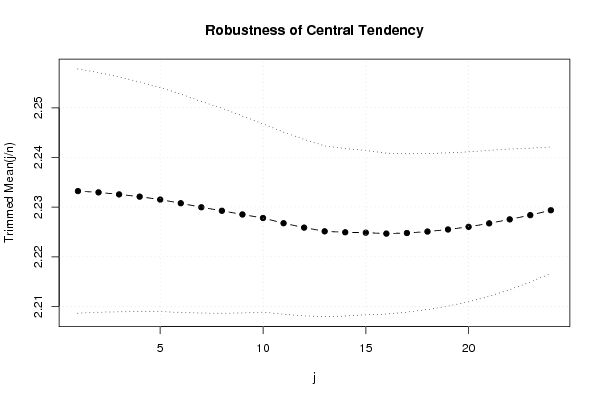
Central Tendency - Ungrouped Data
MeasureValueS.E.Value/S.E.
Arithmetic Mean2.233361111111110.0125062473520562178.579636899947
Geometric Mean2.23089112209359
Harmonic Mean2.22843836895438
Quadratic Mean2.23584585659308
Winsorized Mean ( 1 / 24 )2.233472222222220.012483901561972178.908189169461
Winsorized Mean ( 2 / 24 )2.233722222222220.0124246275677176179.781825253742
Winsorized Mean ( 3 / 24 )2.233763888888890.012366999683195180.622943811041
Winsorized Mean ( 4 / 24 )2.234152777777780.0122538464422392182.322570166754
Winsorized Mean ( 5 / 24 )2.234569444444440.0120766304282099185.032526889677
Winsorized Mean ( 6 / 24 )2.234736111111110.0120490649423172185.469671033356
Winsorized Mean ( 7 / 24 )2.233763888888890.0117403690269393190.263515888072
Winsorized Mean ( 8 / 24 )2.233763888888890.0116593117838786191.586255715155
Winsorized Mean ( 9 / 24 )2.233138888888890.0114446908636886195.124439400467
Winsorized Mean ( 10 / 24 )2.235083333333330.0104230121517783214.437371921512
Winsorized Mean ( 11 / 24 )2.233250.00997531675910316223.877602479340
Winsorized Mean ( 12 / 24 )2.231583333333330.00967285195509716230.705829438172
Winsorized Mean ( 13 / 24 )2.226708333333330.00873551646144637254.902883322442
Winsorized Mean ( 14 / 24 )2.225541666666670.0084941510185434262.008723627369
Winsorized Mean ( 15 / 24 )2.2263750.00824529641370895270.017581939
Winsorized Mean ( 16 / 24 )2.223708333333330.00778389245862966285.680762568605
Winsorized Mean ( 17 / 24 )2.222291666666670.00751611303822946295.670335898802
Winsorized Mean ( 18 / 24 )2.221541666666670.00727145084951854305.515599656946
Winsorized Mean ( 19 / 24 )2.221013888888890.0071266623697147311.648535270488
Winsorized Mean ( 20 / 24 )2.220180555555560.00693992008329175319.914426810298
Winsorized Mean ( 21 / 24 )2.220180555555560.00677821369560751327.546556549892
Winsorized Mean ( 22 / 24 )2.220791666666670.00651998065117571340.613229621503
Winsorized Mean ( 23 / 24 )2.220791666666670.00608449688210079364.991832471758
Winsorized Mean ( 24 / 24 )2.2231250.00539129803327251412.354313614261
Trimmed Mean ( 1 / 24 )2.233228571428570.0122901965919411181.708124416248
Trimmed Mean ( 2 / 24 )2.232970588235290.0120580788437913185.184606699188
Trimmed Mean ( 3 / 24 )2.232560606060610.0118167856745112188.931293801515
Trimmed Mean ( 4 / 24 )2.2321093750.0115519254988896193.224010595858
Trimmed Mean ( 5 / 24 )2.231516129032260.0112724948013177197.961158409353
Trimmed Mean ( 6 / 24 )2.230783333333330.0109880801278668203.018480696719
Trimmed Mean ( 7 / 24 )2.229965517241380.0106464938608390209.455389388226
Trimmed Mean ( 8 / 24 )2.229267857142860.0103105195011718216.212951916680
Trimmed Mean ( 9 / 24 )2.228518518518520.00991359388084564224.794211393338
Trimmed Mean ( 10 / 24 )2.227807692307690.00947199724828121235.199360167883
Trimmed Mean ( 11 / 24 )2.226760.00916415198655353242.9859307514
Trimmed Mean ( 12 / 24 )2.2258750.0088801927671397250.65615785241
Trimmed Mean ( 13 / 24 )2.225130434782610.00858740841469785259.115477840109
Trimmed Mean ( 14 / 24 )2.224931818181820.00842730371558214264.014671035043
Trimmed Mean ( 15 / 24 )2.224857142857140.00826461127752588269.202878168903
Trimmed Mean ( 16 / 24 )2.2246750.00809711783955824274.748996381331
Trimmed Mean ( 17 / 24 )2.224789473684210.00796990765412454279.148714167704
Trimmed Mean ( 18 / 24 )2.225083333333330.00784496350411857283.632082184343
Trimmed Mean ( 19 / 24 )2.22550.00771486631189022288.469029796413
Trimmed Mean ( 20 / 24 )2.226031250.00754989910942523294.842516136545
Trimmed Mean ( 21 / 24 )2.226733333333330.00734407781325899303.201217355458
Trimmed Mean ( 22 / 24 )2.227535714285710.00707190621549707314.983774728855
Trimmed Mean ( 23 / 24 )2.228384615384620.00673477243589667330.877492386709
Trimmed Mean ( 24 / 24 )2.2293750.0063604907351009350.503615656102
Median2.237
Midrange2.238
Midmean - Weighted Average at Xnp2.22286486486487
Midmean - Weighted Average at X(n+1)p2.22508333333333
Midmean - Empirical Distribution Function2.22286486486487
Midmean - Empirical Distribution Function - Averaging2.22508333333333
Midmean - Empirical Distribution Function - Interpolation2.22508333333333
Midmean - Closest Observation2.22286486486487
Midmean - True Basic - Statistics Graphics Toolkit2.22508333333333
Midmean - MS Excel (old versions)2.22478947368421
Number of observations72

\begin{tabular}{lllllllll}
\hline
Central Tendency - Ungrouped Data \tabularnewline
Measure & Value & S.E. & Value/S.E. \tabularnewline
Arithmetic Mean & 2.23336111111111 & 0.0125062473520562 & 178.579636899947 \tabularnewline
Geometric Mean & 2.23089112209359 &  &  \tabularnewline
Harmonic Mean & 2.22843836895438 &  &  \tabularnewline
Quadratic Mean & 2.23584585659308 &  &  \tabularnewline
Winsorized Mean ( 1 / 24 ) & 2.23347222222222 & 0.012483901561972 & 178.908189169461 \tabularnewline
Winsorized Mean ( 2 / 24 ) & 2.23372222222222 & 0.0124246275677176 & 179.781825253742 \tabularnewline
Winsorized Mean ( 3 / 24 ) & 2.23376388888889 & 0.012366999683195 & 180.622943811041 \tabularnewline
Winsorized Mean ( 4 / 24 ) & 2.23415277777778 & 0.0122538464422392 & 182.322570166754 \tabularnewline
Winsorized Mean ( 5 / 24 ) & 2.23456944444444 & 0.0120766304282099 & 185.032526889677 \tabularnewline
Winsorized Mean ( 6 / 24 ) & 2.23473611111111 & 0.0120490649423172 & 185.469671033356 \tabularnewline
Winsorized Mean ( 7 / 24 ) & 2.23376388888889 & 0.0117403690269393 & 190.263515888072 \tabularnewline
Winsorized Mean ( 8 / 24 ) & 2.23376388888889 & 0.0116593117838786 & 191.586255715155 \tabularnewline
Winsorized Mean ( 9 / 24 ) & 2.23313888888889 & 0.0114446908636886 & 195.124439400467 \tabularnewline
Winsorized Mean ( 10 / 24 ) & 2.23508333333333 & 0.0104230121517783 & 214.437371921512 \tabularnewline
Winsorized Mean ( 11 / 24 ) & 2.23325 & 0.00997531675910316 & 223.877602479340 \tabularnewline
Winsorized Mean ( 12 / 24 ) & 2.23158333333333 & 0.00967285195509716 & 230.705829438172 \tabularnewline
Winsorized Mean ( 13 / 24 ) & 2.22670833333333 & 0.00873551646144637 & 254.902883322442 \tabularnewline
Winsorized Mean ( 14 / 24 ) & 2.22554166666667 & 0.0084941510185434 & 262.008723627369 \tabularnewline
Winsorized Mean ( 15 / 24 ) & 2.226375 & 0.00824529641370895 & 270.017581939 \tabularnewline
Winsorized Mean ( 16 / 24 ) & 2.22370833333333 & 0.00778389245862966 & 285.680762568605 \tabularnewline
Winsorized Mean ( 17 / 24 ) & 2.22229166666667 & 0.00751611303822946 & 295.670335898802 \tabularnewline
Winsorized Mean ( 18 / 24 ) & 2.22154166666667 & 0.00727145084951854 & 305.515599656946 \tabularnewline
Winsorized Mean ( 19 / 24 ) & 2.22101388888889 & 0.0071266623697147 & 311.648535270488 \tabularnewline
Winsorized Mean ( 20 / 24 ) & 2.22018055555556 & 0.00693992008329175 & 319.914426810298 \tabularnewline
Winsorized Mean ( 21 / 24 ) & 2.22018055555556 & 0.00677821369560751 & 327.546556549892 \tabularnewline
Winsorized Mean ( 22 / 24 ) & 2.22079166666667 & 0.00651998065117571 & 340.613229621503 \tabularnewline
Winsorized Mean ( 23 / 24 ) & 2.22079166666667 & 0.00608449688210079 & 364.991832471758 \tabularnewline
Winsorized Mean ( 24 / 24 ) & 2.223125 & 0.00539129803327251 & 412.354313614261 \tabularnewline
Trimmed Mean ( 1 / 24 ) & 2.23322857142857 & 0.0122901965919411 & 181.708124416248 \tabularnewline
Trimmed Mean ( 2 / 24 ) & 2.23297058823529 & 0.0120580788437913 & 185.184606699188 \tabularnewline
Trimmed Mean ( 3 / 24 ) & 2.23256060606061 & 0.0118167856745112 & 188.931293801515 \tabularnewline
Trimmed Mean ( 4 / 24 ) & 2.232109375 & 0.0115519254988896 & 193.224010595858 \tabularnewline
Trimmed Mean ( 5 / 24 ) & 2.23151612903226 & 0.0112724948013177 & 197.961158409353 \tabularnewline
Trimmed Mean ( 6 / 24 ) & 2.23078333333333 & 0.0109880801278668 & 203.018480696719 \tabularnewline
Trimmed Mean ( 7 / 24 ) & 2.22996551724138 & 0.0106464938608390 & 209.455389388226 \tabularnewline
Trimmed Mean ( 8 / 24 ) & 2.22926785714286 & 0.0103105195011718 & 216.212951916680 \tabularnewline
Trimmed Mean ( 9 / 24 ) & 2.22851851851852 & 0.00991359388084564 & 224.794211393338 \tabularnewline
Trimmed Mean ( 10 / 24 ) & 2.22780769230769 & 0.00947199724828121 & 235.199360167883 \tabularnewline
Trimmed Mean ( 11 / 24 ) & 2.22676 & 0.00916415198655353 & 242.9859307514 \tabularnewline
Trimmed Mean ( 12 / 24 ) & 2.225875 & 0.0088801927671397 & 250.65615785241 \tabularnewline
Trimmed Mean ( 13 / 24 ) & 2.22513043478261 & 0.00858740841469785 & 259.115477840109 \tabularnewline
Trimmed Mean ( 14 / 24 ) & 2.22493181818182 & 0.00842730371558214 & 264.014671035043 \tabularnewline
Trimmed Mean ( 15 / 24 ) & 2.22485714285714 & 0.00826461127752588 & 269.202878168903 \tabularnewline
Trimmed Mean ( 16 / 24 ) & 2.224675 & 0.00809711783955824 & 274.748996381331 \tabularnewline
Trimmed Mean ( 17 / 24 ) & 2.22478947368421 & 0.00796990765412454 & 279.148714167704 \tabularnewline
Trimmed Mean ( 18 / 24 ) & 2.22508333333333 & 0.00784496350411857 & 283.632082184343 \tabularnewline
Trimmed Mean ( 19 / 24 ) & 2.2255 & 0.00771486631189022 & 288.469029796413 \tabularnewline
Trimmed Mean ( 20 / 24 ) & 2.22603125 & 0.00754989910942523 & 294.842516136545 \tabularnewline
Trimmed Mean ( 21 / 24 ) & 2.22673333333333 & 0.00734407781325899 & 303.201217355458 \tabularnewline
Trimmed Mean ( 22 / 24 ) & 2.22753571428571 & 0.00707190621549707 & 314.983774728855 \tabularnewline
Trimmed Mean ( 23 / 24 ) & 2.22838461538462 & 0.00673477243589667 & 330.877492386709 \tabularnewline
Trimmed Mean ( 24 / 24 ) & 2.229375 & 0.0063604907351009 & 350.503615656102 \tabularnewline
Median & 2.237 &  &  \tabularnewline
Midrange & 2.238 &  &  \tabularnewline
Midmean - Weighted Average at Xnp & 2.22286486486487 &  &  \tabularnewline
Midmean - Weighted Average at X(n+1)p & 2.22508333333333 &  &  \tabularnewline
Midmean - Empirical Distribution Function & 2.22286486486487 &  &  \tabularnewline
Midmean - Empirical Distribution Function - Averaging & 2.22508333333333 &  &  \tabularnewline
Midmean - Empirical Distribution Function - Interpolation & 2.22508333333333 &  &  \tabularnewline
Midmean - Closest Observation & 2.22286486486487 &  &  \tabularnewline
Midmean - True Basic - Statistics Graphics Toolkit & 2.22508333333333 &  &  \tabularnewline
Midmean - MS Excel (old versions) & 2.22478947368421 &  &  \tabularnewline
Number of observations & 72 &  &  \tabularnewline
\hline
\end{tabular}
%Source: https://freestatistics.org/blog/index.php?pk=1274&T=1

[TABLE]
[ROW][C]Central Tendency - Ungrouped Data[/C][/ROW]
[ROW][C]Measure[/C][C]Value[/C][C]S.E.[/C][C]Value/S.E.[/C][/ROW]
[ROW][C]Arithmetic Mean[/C][C]2.23336111111111[/C][C]0.0125062473520562[/C][C]178.579636899947[/C][/ROW]
[ROW][C]Geometric Mean[/C][C]2.23089112209359[/C][C][/C][C][/C][/ROW]
[ROW][C]Harmonic Mean[/C][C]2.22843836895438[/C][C][/C][C][/C][/ROW]
[ROW][C]Quadratic Mean[/C][C]2.23584585659308[/C][C][/C][C][/C][/ROW]
[ROW][C]Winsorized Mean ( 1 / 24 )[/C][C]2.23347222222222[/C][C]0.012483901561972[/C][C]178.908189169461[/C][/ROW]
[ROW][C]Winsorized Mean ( 2 / 24 )[/C][C]2.23372222222222[/C][C]0.0124246275677176[/C][C]179.781825253742[/C][/ROW]
[ROW][C]Winsorized Mean ( 3 / 24 )[/C][C]2.23376388888889[/C][C]0.012366999683195[/C][C]180.622943811041[/C][/ROW]
[ROW][C]Winsorized Mean ( 4 / 24 )[/C][C]2.23415277777778[/C][C]0.0122538464422392[/C][C]182.322570166754[/C][/ROW]
[ROW][C]Winsorized Mean ( 5 / 24 )[/C][C]2.23456944444444[/C][C]0.0120766304282099[/C][C]185.032526889677[/C][/ROW]
[ROW][C]Winsorized Mean ( 6 / 24 )[/C][C]2.23473611111111[/C][C]0.0120490649423172[/C][C]185.469671033356[/C][/ROW]
[ROW][C]Winsorized Mean ( 7 / 24 )[/C][C]2.23376388888889[/C][C]0.0117403690269393[/C][C]190.263515888072[/C][/ROW]
[ROW][C]Winsorized Mean ( 8 / 24 )[/C][C]2.23376388888889[/C][C]0.0116593117838786[/C][C]191.586255715155[/C][/ROW]
[ROW][C]Winsorized Mean ( 9 / 24 )[/C][C]2.23313888888889[/C][C]0.0114446908636886[/C][C]195.124439400467[/C][/ROW]
[ROW][C]Winsorized Mean ( 10 / 24 )[/C][C]2.23508333333333[/C][C]0.0104230121517783[/C][C]214.437371921512[/C][/ROW]
[ROW][C]Winsorized Mean ( 11 / 24 )[/C][C]2.23325[/C][C]0.00997531675910316[/C][C]223.877602479340[/C][/ROW]
[ROW][C]Winsorized Mean ( 12 / 24 )[/C][C]2.23158333333333[/C][C]0.00967285195509716[/C][C]230.705829438172[/C][/ROW]
[ROW][C]Winsorized Mean ( 13 / 24 )[/C][C]2.22670833333333[/C][C]0.00873551646144637[/C][C]254.902883322442[/C][/ROW]
[ROW][C]Winsorized Mean ( 14 / 24 )[/C][C]2.22554166666667[/C][C]0.0084941510185434[/C][C]262.008723627369[/C][/ROW]
[ROW][C]Winsorized Mean ( 15 / 24 )[/C][C]2.226375[/C][C]0.00824529641370895[/C][C]270.017581939[/C][/ROW]
[ROW][C]Winsorized Mean ( 16 / 24 )[/C][C]2.22370833333333[/C][C]0.00778389245862966[/C][C]285.680762568605[/C][/ROW]
[ROW][C]Winsorized Mean ( 17 / 24 )[/C][C]2.22229166666667[/C][C]0.00751611303822946[/C][C]295.670335898802[/C][/ROW]
[ROW][C]Winsorized Mean ( 18 / 24 )[/C][C]2.22154166666667[/C][C]0.00727145084951854[/C][C]305.515599656946[/C][/ROW]
[ROW][C]Winsorized Mean ( 19 / 24 )[/C][C]2.22101388888889[/C][C]0.0071266623697147[/C][C]311.648535270488[/C][/ROW]
[ROW][C]Winsorized Mean ( 20 / 24 )[/C][C]2.22018055555556[/C][C]0.00693992008329175[/C][C]319.914426810298[/C][/ROW]
[ROW][C]Winsorized Mean ( 21 / 24 )[/C][C]2.22018055555556[/C][C]0.00677821369560751[/C][C]327.546556549892[/C][/ROW]
[ROW][C]Winsorized Mean ( 22 / 24 )[/C][C]2.22079166666667[/C][C]0.00651998065117571[/C][C]340.613229621503[/C][/ROW]
[ROW][C]Winsorized Mean ( 23 / 24 )[/C][C]2.22079166666667[/C][C]0.00608449688210079[/C][C]364.991832471758[/C][/ROW]
[ROW][C]Winsorized Mean ( 24 / 24 )[/C][C]2.223125[/C][C]0.00539129803327251[/C][C]412.354313614261[/C][/ROW]
[ROW][C]Trimmed Mean ( 1 / 24 )[/C][C]2.23322857142857[/C][C]0.0122901965919411[/C][C]181.708124416248[/C][/ROW]
[ROW][C]Trimmed Mean ( 2 / 24 )[/C][C]2.23297058823529[/C][C]0.0120580788437913[/C][C]185.184606699188[/C][/ROW]
[ROW][C]Trimmed Mean ( 3 / 24 )[/C][C]2.23256060606061[/C][C]0.0118167856745112[/C][C]188.931293801515[/C][/ROW]
[ROW][C]Trimmed Mean ( 4 / 24 )[/C][C]2.232109375[/C][C]0.0115519254988896[/C][C]193.224010595858[/C][/ROW]
[ROW][C]Trimmed Mean ( 5 / 24 )[/C][C]2.23151612903226[/C][C]0.0112724948013177[/C][C]197.961158409353[/C][/ROW]
[ROW][C]Trimmed Mean ( 6 / 24 )[/C][C]2.23078333333333[/C][C]0.0109880801278668[/C][C]203.018480696719[/C][/ROW]
[ROW][C]Trimmed Mean ( 7 / 24 )[/C][C]2.22996551724138[/C][C]0.0106464938608390[/C][C]209.455389388226[/C][/ROW]
[ROW][C]Trimmed Mean ( 8 / 24 )[/C][C]2.22926785714286[/C][C]0.0103105195011718[/C][C]216.212951916680[/C][/ROW]
[ROW][C]Trimmed Mean ( 9 / 24 )[/C][C]2.22851851851852[/C][C]0.00991359388084564[/C][C]224.794211393338[/C][/ROW]
[ROW][C]Trimmed Mean ( 10 / 24 )[/C][C]2.22780769230769[/C][C]0.00947199724828121[/C][C]235.199360167883[/C][/ROW]
[ROW][C]Trimmed Mean ( 11 / 24 )[/C][C]2.22676[/C][C]0.00916415198655353[/C][C]242.9859307514[/C][/ROW]
[ROW][C]Trimmed Mean ( 12 / 24 )[/C][C]2.225875[/C][C]0.0088801927671397[/C][C]250.65615785241[/C][/ROW]
[ROW][C]Trimmed Mean ( 13 / 24 )[/C][C]2.22513043478261[/C][C]0.00858740841469785[/C][C]259.115477840109[/C][/ROW]
[ROW][C]Trimmed Mean ( 14 / 24 )[/C][C]2.22493181818182[/C][C]0.00842730371558214[/C][C]264.014671035043[/C][/ROW]
[ROW][C]Trimmed Mean ( 15 / 24 )[/C][C]2.22485714285714[/C][C]0.00826461127752588[/C][C]269.202878168903[/C][/ROW]
[ROW][C]Trimmed Mean ( 16 / 24 )[/C][C]2.224675[/C][C]0.00809711783955824[/C][C]274.748996381331[/C][/ROW]
[ROW][C]Trimmed Mean ( 17 / 24 )[/C][C]2.22478947368421[/C][C]0.00796990765412454[/C][C]279.148714167704[/C][/ROW]
[ROW][C]Trimmed Mean ( 18 / 24 )[/C][C]2.22508333333333[/C][C]0.00784496350411857[/C][C]283.632082184343[/C][/ROW]
[ROW][C]Trimmed Mean ( 19 / 24 )[/C][C]2.2255[/C][C]0.00771486631189022[/C][C]288.469029796413[/C][/ROW]
[ROW][C]Trimmed Mean ( 20 / 24 )[/C][C]2.22603125[/C][C]0.00754989910942523[/C][C]294.842516136545[/C][/ROW]
[ROW][C]Trimmed Mean ( 21 / 24 )[/C][C]2.22673333333333[/C][C]0.00734407781325899[/C][C]303.201217355458[/C][/ROW]
[ROW][C]Trimmed Mean ( 22 / 24 )[/C][C]2.22753571428571[/C][C]0.00707190621549707[/C][C]314.983774728855[/C][/ROW]
[ROW][C]Trimmed Mean ( 23 / 24 )[/C][C]2.22838461538462[/C][C]0.00673477243589667[/C][C]330.877492386709[/C][/ROW]
[ROW][C]Trimmed Mean ( 24 / 24 )[/C][C]2.229375[/C][C]0.0063604907351009[/C][C]350.503615656102[/C][/ROW]
[ROW][C]Median[/C][C]2.237[/C][C][/C][C][/C][/ROW]
[ROW][C]Midrange[/C][C]2.238[/C][C][/C][C][/C][/ROW]
[ROW][C]Midmean - Weighted Average at Xnp[/C][C]2.22286486486487[/C][C][/C][C][/C][/ROW]
[ROW][C]Midmean - Weighted Average at X(n+1)p[/C][C]2.22508333333333[/C][C][/C][C][/C][/ROW]
[ROW][C]Midmean - Empirical Distribution Function[/C][C]2.22286486486487[/C][C][/C][C][/C][/ROW]
[ROW][C]Midmean - Empirical Distribution Function - Averaging[/C][C]2.22508333333333[/C][C][/C][C][/C][/ROW]
[ROW][C]Midmean - Empirical Distribution Function - Interpolation[/C][C]2.22508333333333[/C][C][/C][C][/C][/ROW]
[ROW][C]Midmean - Closest Observation[/C][C]2.22286486486487[/C][C][/C][C][/C][/ROW]
[ROW][C]Midmean - True Basic - Statistics Graphics Toolkit[/C][C]2.22508333333333[/C][C][/C][C][/C][/ROW]
[ROW][C]Midmean - MS Excel (old versions)[/C][C]2.22478947368421[/C][C][/C][C][/C][/ROW]
[ROW][C]Number of observations[/C][C]72[/C][C][/C][C][/C][/ROW]
[/TABLE]
Source: https://freestatistics.org/blog/index.php?pk=1274&T=1

Globally Unique Identifier (entire table): ba.freestatistics.org/blog/index.php?pk=1274&T=1

As an alternative you can also use a QR Code:  

The GUIDs for individual cells are displayed in the table below:

Central Tendency - Ungrouped Data
MeasureValueS.E.Value/S.E.
Arithmetic Mean2.233361111111110.0125062473520562178.579636899947
Geometric Mean2.23089112209359
Harmonic Mean2.22843836895438
Quadratic Mean2.23584585659308
Winsorized Mean ( 1 / 24 )2.233472222222220.012483901561972178.908189169461
Winsorized Mean ( 2 / 24 )2.233722222222220.0124246275677176179.781825253742
Winsorized Mean ( 3 / 24 )2.233763888888890.012366999683195180.622943811041
Winsorized Mean ( 4 / 24 )2.234152777777780.0122538464422392182.322570166754
Winsorized Mean ( 5 / 24 )2.234569444444440.0120766304282099185.032526889677
Winsorized Mean ( 6 / 24 )2.234736111111110.0120490649423172185.469671033356
Winsorized Mean ( 7 / 24 )2.233763888888890.0117403690269393190.263515888072
Winsorized Mean ( 8 / 24 )2.233763888888890.0116593117838786191.586255715155
Winsorized Mean ( 9 / 24 )2.233138888888890.0114446908636886195.124439400467
Winsorized Mean ( 10 / 24 )2.235083333333330.0104230121517783214.437371921512
Winsorized Mean ( 11 / 24 )2.233250.00997531675910316223.877602479340
Winsorized Mean ( 12 / 24 )2.231583333333330.00967285195509716230.705829438172
Winsorized Mean ( 13 / 24 )2.226708333333330.00873551646144637254.902883322442
Winsorized Mean ( 14 / 24 )2.225541666666670.0084941510185434262.008723627369
Winsorized Mean ( 15 / 24 )2.2263750.00824529641370895270.017581939
Winsorized Mean ( 16 / 24 )2.223708333333330.00778389245862966285.680762568605
Winsorized Mean ( 17 / 24 )2.222291666666670.00751611303822946295.670335898802
Winsorized Mean ( 18 / 24 )2.221541666666670.00727145084951854305.515599656946
Winsorized Mean ( 19 / 24 )2.221013888888890.0071266623697147311.648535270488
Winsorized Mean ( 20 / 24 )2.220180555555560.00693992008329175319.914426810298
Winsorized Mean ( 21 / 24 )2.220180555555560.00677821369560751327.546556549892
Winsorized Mean ( 22 / 24 )2.220791666666670.00651998065117571340.613229621503
Winsorized Mean ( 23 / 24 )2.220791666666670.00608449688210079364.991832471758
Winsorized Mean ( 24 / 24 )2.2231250.00539129803327251412.354313614261
Trimmed Mean ( 1 / 24 )2.233228571428570.0122901965919411181.708124416248
Trimmed Mean ( 2 / 24 )2.232970588235290.0120580788437913185.184606699188
Trimmed Mean ( 3 / 24 )2.232560606060610.0118167856745112188.931293801515
Trimmed Mean ( 4 / 24 )2.2321093750.0115519254988896193.224010595858
Trimmed Mean ( 5 / 24 )2.231516129032260.0112724948013177197.961158409353
Trimmed Mean ( 6 / 24 )2.230783333333330.0109880801278668203.018480696719
Trimmed Mean ( 7 / 24 )2.229965517241380.0106464938608390209.455389388226
Trimmed Mean ( 8 / 24 )2.229267857142860.0103105195011718216.212951916680
Trimmed Mean ( 9 / 24 )2.228518518518520.00991359388084564224.794211393338
Trimmed Mean ( 10 / 24 )2.227807692307690.00947199724828121235.199360167883
Trimmed Mean ( 11 / 24 )2.226760.00916415198655353242.9859307514
Trimmed Mean ( 12 / 24 )2.2258750.0088801927671397250.65615785241
Trimmed Mean ( 13 / 24 )2.225130434782610.00858740841469785259.115477840109
Trimmed Mean ( 14 / 24 )2.224931818181820.00842730371558214264.014671035043
Trimmed Mean ( 15 / 24 )2.224857142857140.00826461127752588269.202878168903
Trimmed Mean ( 16 / 24 )2.2246750.00809711783955824274.748996381331
Trimmed Mean ( 17 / 24 )2.224789473684210.00796990765412454279.148714167704
Trimmed Mean ( 18 / 24 )2.225083333333330.00784496350411857283.632082184343
Trimmed Mean ( 19 / 24 )2.22550.00771486631189022288.469029796413
Trimmed Mean ( 20 / 24 )2.226031250.00754989910942523294.842516136545
Trimmed Mean ( 21 / 24 )2.226733333333330.00734407781325899303.201217355458
Trimmed Mean ( 22 / 24 )2.227535714285710.00707190621549707314.983774728855
Trimmed Mean ( 23 / 24 )2.228384615384620.00673477243589667330.877492386709
Trimmed Mean ( 24 / 24 )2.2293750.0063604907351009350.503615656102
Median2.237
Midrange2.238
Midmean - Weighted Average at Xnp2.22286486486487
Midmean - Weighted Average at X(n+1)p2.22508333333333
Midmean - Empirical Distribution Function2.22286486486487
Midmean - Empirical Distribution Function - Averaging2.22508333333333
Midmean - Empirical Distribution Function - Interpolation2.22508333333333
Midmean - Closest Observation2.22286486486487
Midmean - True Basic - Statistics Graphics Toolkit2.22508333333333
Midmean - MS Excel (old versions)2.22478947368421
Number of observations72


Parameters (Session):
Parameters (R input):
R code (references can be found in the software module):
geomean <- function(x) {
return(exp(mean(log(x))))
}
harmean <- function(x) {
return(1/mean(1/x))
}
quamean <- function(x) {
return(sqrt(mean(x*x)))
}
winmean <- function(x) {
x <-sort(x[!is.na(x)])
n<-length(x)
denom <- 3
nodenom <- n/denom
if (nodenom>40) denom <- n/40
sqrtn = sqrt(n)
roundnodenom = floor(nodenom)
win <- array(NA,dim=c(roundnodenom,2))
for (j in 1:roundnodenom) {
win[j,1] <- (j*x[j+1]+sum(x[(j+1):(n-j)])+j*x[n-j])/n
win[j,2] <- sd(c(rep(x[j+1],j),x[(j+1):(n-j)],rep(x[n-j],j)))/sqrtn
}
return(win)
}
trimean <- function(x) {
x <-sort(x[!is.na(x)])
n<-length(x)
denom <- 3
nodenom <- n/denom
if (nodenom>40) denom <- n/40
sqrtn = sqrt(n)
roundnodenom = floor(nodenom)
tri <- array(NA,dim=c(roundnodenom,2))
for (j in 1:roundnodenom) {
tri[j,1] <- mean(x,trim=j/n)
tri[j,2] <- sd(x[(j+1):(n-j)]) / sqrt(n-j*2)
}
return(tri)
}
midrange <- function(x) {
return((max(x)+min(x))/2)
}
q1 <- function(data,n,p,i,f) {
np <- n*p;
i <<- floor(np)
f <<- np - i
qvalue <- (1-f)*data[i] + f*data[i+1]
}
q2 <- function(data,n,p,i,f) {
np <- (n+1)*p
i <<- floor(np)
f <<- np - i
qvalue <- (1-f)*data[i] + f*data[i+1]
}
q3 <- function(data,n,p,i,f) {
np <- n*p
i <<- floor(np)
f <<- np - i
if (f==0) {
qvalue <- data[i]
} else {
qvalue <- data[i+1]
}
}
q4 <- function(data,n,p,i,f) {
np <- n*p
i <<- floor(np)
f <<- np - i
if (f==0) {
qvalue <- (data[i]+data[i+1])/2
} else {
qvalue <- data[i+1]
}
}
q5 <- function(data,n,p,i,f) {
np <- (n-1)*p
i <<- floor(np)
f <<- np - i
if (f==0) {
qvalue <- data[i+1]
} else {
qvalue <- data[i+1] + f*(data[i+2]-data[i+1])
}
}
q6 <- function(data,n,p,i,f) {
np <- n*p+0.5
i <<- floor(np)
f <<- np - i
qvalue <- data[i]
}
q7 <- function(data,n,p,i,f) {
np <- (n+1)*p
i <<- floor(np)
f <<- np - i
if (f==0) {
qvalue <- data[i]
} else {
qvalue <- f*data[i] + (1-f)*data[i+1]
}
}
q8 <- function(data,n,p,i,f) {
np <- (n+1)*p
i <<- floor(np)
f <<- np - i
if (f==0) {
qvalue <- data[i]
} else {
if (f == 0.5) {
qvalue <- (data[i]+data[i+1])/2
} else {
if (f < 0.5) {
qvalue <- data[i]
} else {
qvalue <- data[i+1]
}
}
}
}
midmean <- function(x,def) {
x <-sort(x[!is.na(x)])
n<-length(x)
if (def==1) {
qvalue1 <- q1(x,n,0.25,i,f)
qvalue3 <- q1(x,n,0.75,i,f)
}
if (def==2) {
qvalue1 <- q2(x,n,0.25,i,f)
qvalue3 <- q2(x,n,0.75,i,f)
}
if (def==3) {
qvalue1 <- q3(x,n,0.25,i,f)
qvalue3 <- q3(x,n,0.75,i,f)
}
if (def==4) {
qvalue1 <- q4(x,n,0.25,i,f)
qvalue3 <- q4(x,n,0.75,i,f)
}
if (def==5) {
qvalue1 <- q5(x,n,0.25,i,f)
qvalue3 <- q5(x,n,0.75,i,f)
}
if (def==6) {
qvalue1 <- q6(x,n,0.25,i,f)
qvalue3 <- q6(x,n,0.75,i,f)
}
if (def==7) {
qvalue1 <- q7(x,n,0.25,i,f)
qvalue3 <- q7(x,n,0.75,i,f)
}
if (def==8) {
qvalue1 <- q8(x,n,0.25,i,f)
qvalue3 <- q8(x,n,0.75,i,f)
}
midm <- 0
myn <- 0
roundno4 <- round(n/4)
round3no4 <- round(3*n/4)
for (i in 1:n) {
if ((x[i]>=qvalue1) & (x[i]<=qvalue3)){
midm = midm + x[i]
myn = myn + 1
}
}
midm = midm / myn
return(midm)
}
(arm <- mean(x))
sqrtn <- sqrt(length(x))
(armse <- sd(x) / sqrtn)
(armose <- arm / armse)
(geo <- geomean(x))
(har <- harmean(x))
(qua <- quamean(x))
(win <- winmean(x))
(tri <- trimean(x))
(midr <- midrange(x))
midm <- array(NA,dim=8)
for (j in 1:8) midm[j] <- midmean(x,j)
midm
bitmap(file='test1.png')
lb <- win[,1] - 2*win[,2]
ub <- win[,1] + 2*win[,2]
if ((ylimmin == '') | (ylimmax == '')) plot(win[,1],type='b',main=main, xlab='j', pch=19, ylab='Winsorized Mean(j/n)', ylim=c(min(lb),max(ub))) else plot(win[,1],type='l',main=main, xlab='j', pch=19, ylab='Winsorized Mean(j/n)', ylim=c(ylimmin,ylimmax))
lines(ub,lty=3)
lines(lb,lty=3)
grid()
dev.off()
bitmap(file='test2.png')
lb <- tri[,1] - 2*tri[,2]
ub <- tri[,1] + 2*tri[,2]
if ((ylimmin == '') | (ylimmax == '')) plot(tri[,1],type='b',main=main, xlab='j', pch=19, ylab='Trimmed Mean(j/n)', ylim=c(min(lb),max(ub))) else plot(tri[,1],type='l',main=main, xlab='j', pch=19, ylab='Trimmed Mean(j/n)', ylim=c(ylimmin,ylimmax))
lines(ub,lty=3)
lines(lb,lty=3)
grid()
dev.off()
load(file='createtable')
a<-table.start()
a<-table.row.start(a)
a<-table.element(a,'Central Tendency - Ungrouped Data',4,TRUE)
a<-table.row.end(a)
a<-table.row.start(a)
a<-table.element(a,'Measure',header=TRUE)
a<-table.element(a,'Value',header=TRUE)
a<-table.element(a,'S.E.',header=TRUE)
a<-table.element(a,'Value/S.E.',header=TRUE)
a<-table.row.end(a)
a<-table.row.start(a)
a<-table.element(a,hyperlink('arithmetic_mean.htm', 'Arithmetic Mean', 'click to view the definition of the Arithmetic Mean'),header=TRUE)
a<-table.element(a,arm)
a<-table.element(a,hyperlink('arithmetic_mean_standard_error.htm', armse, 'click to view the definition of the Standard Error of the Arithmetic Mean'))
a<-table.element(a,armose)
a<-table.row.end(a)
a<-table.row.start(a)
a<-table.element(a,hyperlink('geometric_mean.htm', 'Geometric Mean', 'click to view the definition of the Geometric Mean'),header=TRUE)
a<-table.element(a,geo)
a<-table.element(a,'')
a<-table.row.end(a)
a<-table.row.start(a)
a<-table.element(a,hyperlink('harmonic_mean.htm', 'Harmonic Mean', 'click to view the definition of the Harmonic Mean'),header=TRUE)
a<-table.element(a,har)
a<-table.element(a,'')
a<-table.row.end(a)
a<-table.row.start(a)
a<-table.element(a,hyperlink('quadratic_mean.htm', 'Quadratic Mean', 'click to view the definition of the Quadratic Mean'),header=TRUE)
a<-table.element(a,qua)
a<-table.element(a,'')
a<-table.row.end(a)
for (j in 1:length(win[,1])) {
a<-table.row.start(a)
mylabel <- paste('Winsorized Mean (',j)
mylabel <- paste(mylabel,'/')
mylabel <- paste(mylabel,length(win[,1]))
mylabel <- paste(mylabel,')')
a<-table.element(a,hyperlink('winsorized_mean.htm', mylabel, 'click to view the definition of the Winsorized Mean'),header=TRUE)
a<-table.element(a,win[j,1])
a<-table.element(a,win[j,2])
a<-table.element(a,win[j,1]/win[j,2])
a<-table.row.end(a)
}
for (j in 1:length(tri[,1])) {
a<-table.row.start(a)
mylabel <- paste('Trimmed Mean (',j)
mylabel <- paste(mylabel,'/')
mylabel <- paste(mylabel,length(tri[,1]))
mylabel <- paste(mylabel,')')
a<-table.element(a,hyperlink('arithmetic_mean.htm', mylabel, 'click to view the definition of the Trimmed Mean'),header=TRUE)
a<-table.element(a,tri[j,1])
a<-table.element(a,tri[j,2])
a<-table.element(a,tri[j,1]/tri[j,2])
a<-table.row.end(a)
}
a<-table.row.start(a)
a<-table.element(a,hyperlink('median_1.htm', 'Median', 'click to view the definition of the Median'),header=TRUE)
a<-table.element(a,median(x))
a<-table.element(a,'')
a<-table.row.end(a)
a<-table.row.start(a)
a<-table.element(a,hyperlink('midrange.htm', 'Midrange', 'click to view the definition of the Midrange'),header=TRUE)
a<-table.element(a,midr)
a<-table.element(a,'')
a<-table.row.end(a)
a<-table.row.start(a)
mymid <- hyperlink('midmean.htm', 'Midmean', 'click to view the definition of the Midmean')
mylabel <- paste(mymid,hyperlink('method_1.htm','Weighted Average at Xnp',''),sep=' - ')
a<-table.element(a,mylabel,header=TRUE)
a<-table.element(a,midm[1])
a<-table.element(a,'')
a<-table.row.end(a)
a<-table.row.start(a)
mymid <- hyperlink('midmean.htm', 'Midmean', 'click to view the definition of the Midmean')
mylabel <- paste(mymid,hyperlink('method_2.htm','Weighted Average at X(n+1)p',''),sep=' - ')
a<-table.element(a,mylabel,header=TRUE)
a<-table.element(a,midm[2])
a<-table.element(a,'')
a<-table.row.end(a)
a<-table.row.start(a)
mymid <- hyperlink('midmean.htm', 'Midmean', 'click to view the definition of the Midmean')
mylabel <- paste(mymid,hyperlink('method_3.htm','Empirical Distribution Function',''),sep=' - ')
a<-table.element(a,mylabel,header=TRUE)
a<-table.element(a,midm[3])
a<-table.element(a,'')
a<-table.row.end(a)
a<-table.row.start(a)
mymid <- hyperlink('midmean.htm', 'Midmean', 'click to view the definition of the Midmean')
mylabel <- paste(mymid,hyperlink('method_4.htm','Empirical Distribution Function - Averaging',''),sep=' - ')
a<-table.element(a,mylabel,header=TRUE)
a<-table.element(a,midm[4])
a<-table.element(a,'')
a<-table.row.end(a)
a<-table.row.start(a)
mymid <- hyperlink('midmean.htm', 'Midmean', 'click to view the definition of the Midmean')
mylabel <- paste(mymid,hyperlink('method_5.htm','Empirical Distribution Function - Interpolation',''),sep=' - ')
a<-table.element(a,mylabel,header=TRUE)
a<-table.element(a,midm[5])
a<-table.element(a,'')
a<-table.row.end(a)
a<-table.row.start(a)
mymid <- hyperlink('midmean.htm', 'Midmean', 'click to view the definition of the Midmean')
mylabel <- paste(mymid,hyperlink('method_6.htm','Closest Observation',''),sep=' - ')
a<-table.element(a,mylabel,header=TRUE)
a<-table.element(a,midm[6])
a<-table.element(a,'')
a<-table.row.end(a)
a<-table.row.start(a)
mymid <- hyperlink('midmean.htm', 'Midmean', 'click to view the definition of the Midmean')
mylabel <- paste(mymid,hyperlink('method_7.htm','True Basic - Statistics Graphics Toolkit',''),sep=' - ')
a<-table.element(a,mylabel,header=TRUE)
a<-table.element(a,midm[7])
a<-table.element(a,'')
a<-table.row.end(a)
a<-table.row.start(a)
mymid <- hyperlink('midmean.htm', 'Midmean', 'click to view the definition of the Midmean')
mylabel <- paste(mymid,hyperlink('method_8.htm','MS Excel (old versions)',''),sep=' - ')
a<-table.element(a,mylabel,header=TRUE)
a<-table.element(a,midm[8])
a<-table.element(a,'')
a<-table.row.end(a)
a<-table.row.start(a)
a<-table.element(a,'Number of observations',header=TRUE)
a<-table.element(a,length(x))
a<-table.element(a,'')
a<-table.row.end(a)
a<-table.end(a)
table.save(a,file='mytable.tab')