Free Statistics
of Irreproducible Research!
Description of Statistical Computation | |||||||||||||||||||||||||||||||||||||||||||||||||
|---|---|---|---|---|---|---|---|---|---|---|---|---|---|---|---|---|---|---|---|---|---|---|---|---|---|---|---|---|---|---|---|---|---|---|---|---|---|---|---|---|---|---|---|---|---|---|---|---|---|
| Author's title | |||||||||||||||||||||||||||||||||||||||||||||||||
| Author | *Unverified author* | ||||||||||||||||||||||||||||||||||||||||||||||||
| R Software Module | rwasp_tukeylambda.wasp | ||||||||||||||||||||||||||||||||||||||||||||||||
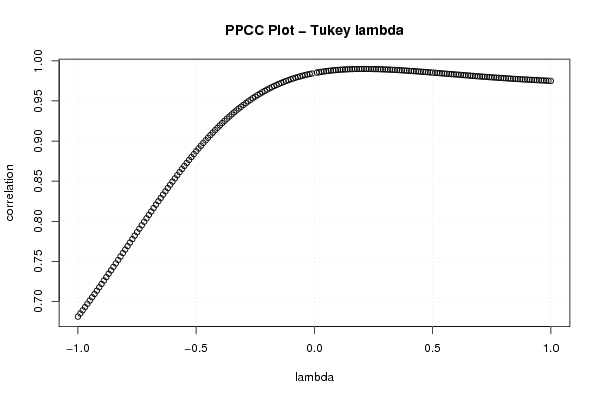
| Title produced by software | Tukey lambda PPCC Plot | ||||||||||||||||||||||||||||||||||||||||||||||||
| Date of computation | Sun, 21 Oct 2007 09:01:20 -0700 | ||||||||||||||||||||||||||||||||||||||||||||||||
| Cite this page as follows | Statistical Computations at FreeStatistics.org, Office for Research Development and Education, URL https://freestatistics.org/blog/index.php?v=date/2007/Oct/21/1ukb041mvmotdtx1192982274.htm/, Retrieved Thu, 09 May 2024 05:14:04 +0000 | ||||||||||||||||||||||||||||||||||||||||||||||||
| Statistical Computations at FreeStatistics.org, Office for Research Development and Education, URL https://freestatistics.org/blog/index.php?pk=1192, Retrieved Thu, 09 May 2024 05:14:04 +0000 | |||||||||||||||||||||||||||||||||||||||||||||||||
| QR Codes: | |||||||||||||||||||||||||||||||||||||||||||||||||
|
| |||||||||||||||||||||||||||||||||||||||||||||||||
| Original text written by user: | |||||||||||||||||||||||||||||||||||||||||||||||||
| IsPrivate? | No (this computation is public) | ||||||||||||||||||||||||||||||||||||||||||||||||
| User-defined keywords | Q1 Tukey Lambda PPCC Plot | ||||||||||||||||||||||||||||||||||||||||||||||||
| Estimated Impact | 538 | ||||||||||||||||||||||||||||||||||||||||||||||||
Tree of Dependent Computations | |||||||||||||||||||||||||||||||||||||||||||||||||
| Family? (F = Feedback message, R = changed R code, M = changed R Module, P = changed Parameters, D = changed Data) | |||||||||||||||||||||||||||||||||||||||||||||||||
| F [Tukey lambda PPCC Plot] [Investigating Dis...] [2007-10-21 16:01:20] [3cbd35878d9bd3c68c81c01c5c6ec146] [Current] - D [Tukey lambda PPCC Plot] [Tukey Lambda paper] [2007-12-19 15:13:15] [74be16979710d4c4e7c6647856088456] - D [Tukey lambda PPCC Plot] [Tukey Lambda Waarde] [2008-12-18 17:57:41] [1d635fe1113b56bab3f378c464a289bc] - R D [Tukey lambda PPCC Plot] [Tukey Lambda Waarde] [2008-12-18 18:20:14] [1d635fe1113b56bab3f378c464a289bc] - D [Tukey lambda PPCC Plot] [ppcc plot totale ...] [2008-10-22 11:33:24] [e43247bc0ab243a5af99ac7f55ba0b41] F D [Tukey lambda PPCC Plot] [q1 ppcc plot ] [2008-10-22 11:36:35] [7173087adebe3e3a714c80ea2417b3eb] F P [Tukey lambda PPCC Plot] [q1 distributions] [2008-10-27 10:22:51] [e43247bc0ab243a5af99ac7f55ba0b41] F [Tukey lambda PPCC Plot] [Q1 Tukey lambda P...] [2008-10-27 19:33:28] [c993f605b206b366f754f7f8c1fcc291] - RM D [Percentiles] [qq plot totale in...] [2008-10-22 11:50:43] [e43247bc0ab243a5af99ac7f55ba0b41] - RM D [Percentiles] [q1 Q-Q-plot] [2008-10-22 11:50:08] [7173087adebe3e3a714c80ea2417b3eb] - P [Percentiles] [q1 qq plot] [2008-10-27 10:24:50] [e43247bc0ab243a5af99ac7f55ba0b41] - [Percentiles] [q1 percentiles] [2008-10-27 19:37:22] [c993f605b206b366f754f7f8c1fcc291] F D [Tukey lambda PPCC Plot] [Tuley Lamba PPCC ...] [2008-10-22 12:31:50] [252acdb58d8522ab27f61fa1e87b5efe] - R D [Tukey lambda PPCC Plot] [Q1 Turkey Lambda ...] [2008-10-22 12:59:07] [f9b9e85820b2a54b20380c3265aca831] F D [Tukey lambda PPCC Plot] [Vraag 1: Q1 Best ...] [2008-10-22 18:03:27] [82d201ca7b4e7cd2c6f885d29b5b6937] F D [Tukey lambda PPCC Plot] [] [2008-10-23 08:27:13] [2a30350413961f11db13c46be07a5f73] F D [Tukey lambda PPCC Plot] [Investigating dis...] [2008-10-27 18:57:35] [090686c1af2bb318059a6f656863a319] F R D [Tukey lambda PPCC Plot] [the "best" (symme...] [2008-10-23 09:03:06] [cb714085b233acee8e8acd879ea442b6] - D [Tukey lambda PPCC Plot] [Q8] [2008-10-23 12:10:05] [cb714085b233acee8e8acd879ea442b6] F R D [Tukey lambda PPCC Plot] [] [2008-10-23 09:32:02] [4ddbf81f78ea7c738951638c7e93f6ee] - D [Tukey lambda PPCC Plot] [Tukey Lambda PPCC...] [2008-10-23 10:19:35] [adb6b6905cde49db36d59ca44433140d] F D [Tukey lambda PPCC Plot] [Q1:Tukey lambda] [2008-10-23 11:12:04] [1ce0d16c8f4225c977b42c8fa93bc163] - D [Tukey lambda PPCC Plot] [Q1] [2008-10-23 12:25:40] [74be16979710d4c4e7c6647856088456] F D [Tukey lambda PPCC Plot] [ppcc plot total p...] [2008-10-23 12:25:40] [529a65e524c481ca1098665a9566b89f] F D [Tukey lambda PPCC Plot] [Q8] [2008-10-27 18:30:03] [529a65e524c481ca1098665a9566b89f] - D [Tukey lambda PPCC Plot] [Q2 Investigating ...] [2008-10-23 12:38:00] [74be16979710d4c4e7c6647856088456] - RMPD [Univariate Explorative Data Analysis] [Q2 unvariate EDA] [2008-10-23 12:47:25] [529a65e524c481ca1098665a9566b89f] F RMPD [Univariate Explorative Data Analysis] [Q2 unvariate EDA] [2008-10-23 12:52:00] [529a65e524c481ca1098665a9566b89f] - P [Univariate Explorative Data Analysis] [Herberekening] [2008-11-02 13:32:47] [79c17183721a40a589db5f9f561947d8] F D [Tukey lambda PPCC Plot] [Q1: determine the...] [2008-10-23 13:22:02] [1e1d8320a8a1170c475bf6e4ce119de6] - [Tukey lambda PPCC Plot] [Q1: determine the...] [2008-10-27 18:42:30] [988ab43f527fc78aae41c84649095267] - [Tukey lambda PPCC Plot] [dd] [2008-10-27 18:42:30] [74be16979710d4c4e7c6647856088456] F D [Tukey lambda PPCC Plot] [PPCC-plot] [2008-10-23 13:41:30] [bc937651ef42bf891200cf0e0edc7238] F RMPD [Univariate Explorative Data Analysis] [Q3 ] [2008-10-23 14:06:35] [529a65e524c481ca1098665a9566b89f] F RMPD [Harrell-Davis Quantiles] [Q5] [2008-10-23 14:33:18] [529a65e524c481ca1098665a9566b89f] F RMPD [Central Tendency] [Q6] [2008-10-23 14:54:14] [529a65e524c481ca1098665a9566b89f] F RM D [Percentiles] [QQ plot - Q1] [2008-10-23 15:01:52] [e5d91604aae608e98a8ea24759233f66] F D [Percentiles] [QQ plot - Q2] [2008-10-23 15:26:39] [e5d91604aae608e98a8ea24759233f66] F D [Tukey lambda PPCC Plot] [q1 totale productie] [2008-10-23 15:24:51] [44a98561a4b3e6ab8cd5a857b48b0914] F D [Tukey lambda PPCC Plot] [Tukey Lambda PPCC...] [2008-10-23 16:11:20] [99d1f77cee9486be2a95cce072dea364] F D [Tukey lambda PPCC Plot] [Vraag 1] [2008-10-24 08:24:04] [87cabf13a90315c7085b765dcebb7412] F [Tukey lambda PPCC Plot] [Q1] [2008-10-27 21:40:48] [d2d412c7f4d35ffbf5ee5ee89db327d4] F D [Tukey lambda PPCC Plot] [Tukey lambda PPCC...] [2008-10-24 08:25:20] [58bf45a666dc5198906262e8815a9722] - D [Tukey lambda PPCC Plot] [Tukey Lambda PPCC...] [2008-10-24 12:43:53] [b635de6fc42b001d22cbe6e730fec936] - [Tukey lambda PPCC Plot] [weibul task 2] [2008-10-27 16:55:27] [fe7291e888d31b8c4db0b24d6c0f75c6] F D [Tukey lambda PPCC Plot] [Reproduce Q1 ] [2008-10-24 13:02:38] [deb3c14ac9e4607a6d84fc9d0e0e6cc2] F D [Tukey lambda PPCC Plot] [herberekening vra...] [2008-10-24 12:59:52] [c45c87b96bbf32ffc2144fc37d767b2e] F D [Tukey lambda PPCC Plot] [PPCC - tukey lambda] [2008-10-24 13:18:16] [1376d48f59a7212e8dd85a587491a69b] F D [Tukey lambda PPCC Plot] [Q1 PPCC Plot ] [2008-10-24 13:41:50] [7d3039e6253bb5fb3b26df1537d500b4] [Truncated] | |||||||||||||||||||||||||||||||||||||||||||||||||
| Feedback Forum | |||||||||||||||||||||||||||||||||||||||||||||||||
Post a new message | |||||||||||||||||||||||||||||||||||||||||||||||||
Dataset | |||||||||||||||||||||||||||||||||||||||||||||||||
| Dataseries X: | |||||||||||||||||||||||||||||||||||||||||||||||||
110,40 96,40 101,90 106,20 81,00 94,70 101,00 109,40 102,30 90,70 96,20 96,10 106,00 103,10 102,00 104,70 86,00 92,10 106,90 112,60 101,70 92,00 97,40 97,00 105,40 102,70 98,10 104,50 87,40 89,90 109,80 111,70 98,60 96,90 95,10 97,00 112,70 102,90 97,40 111,40 87,40 96,80 114,10 110,30 103,90 101,60 94,60 95,90 104,70 102,80 98,10 113,90 80,90 95,70 113,20 105,90 108,80 102,30 99,00 100,70 115,50 | |||||||||||||||||||||||||||||||||||||||||||||||||
Tables (Output of Computation) | |||||||||||||||||||||||||||||||||||||||||||||||||
| |||||||||||||||||||||||||||||||||||||||||||||||||
Figures (Output of Computation) | |||||||||||||||||||||||||||||||||||||||||||||||||
Input Parameters & R Code | |||||||||||||||||||||||||||||||||||||||||||||||||
| Parameters (Session): | |||||||||||||||||||||||||||||||||||||||||||||||||
| Parameters (R input): | |||||||||||||||||||||||||||||||||||||||||||||||||
| R code (references can be found in the software module): | |||||||||||||||||||||||||||||||||||||||||||||||||
gp <- function(lambda, p) | |||||||||||||||||||||||||||||||||||||||||||||||||