Free Statistics

of Irreproducible Research!

Author's title

Author*Unverified author*
R Software Modulerwasp_autocorrelation.wasp
Title produced by software(Partial) Autocorrelation Function
Date of computationSat, 01 Dec 2007 08:40:01 -0700
Cite this page as followsStatistical Computations at FreeStatistics.org, Office for Research Development and Education, URL https://freestatistics.org/blog/index.php?v=date/2007/Dec/01/t1196522966gi8n44q2jx7y9v2.htm/, Retrieved Sun, 19 May 2024 18:13:12 +0000
Statistical Computations at FreeStatistics.org, Office for Research Development and Education, URL https://freestatistics.org/blog/index.php?pk=2262, Retrieved Sun, 19 May 2024 18:13:12 +0000
QR Codes:

Original text written by user:
IsPrivate?No (this computation is public)
User-defined keywords
Estimated Impact183
Family? (F = Feedback message, R = changed R code, M = changed R Module, P = changed Parameters, D = changed Data)
-       [(Partial) Autocorrelation Function] [] [2007-12-01 15:40:01] [22d719c250b0837edaa2d173fd414084] [Current]
Feedback Forum

Post a new message
Dataseries X:
105.3
103
103.8
103.4
105.8
101.4
97
94.3
96.6
97.1
95.7
96.9
97.4
95.3
93.6
91.5
93.1
91.7
94.3
93.9
90.9
88.3
91.3
91.7
92.4
92
95.6
95.8
96.4
99
107
109.7
116.2
115.9
113.8
112.6
113.7
115.9
110.3
111.3
113.4
108.2
104.8
106
110.9
115
118.4
121.4
128.8
131.7
141.7
142.9
139.4
134.7
125
113.6
111.5
108.5
112.3
116.6
115.5
120.1
132.9
128.1
129.3
132.5
131
124.9
120.8
122
122.1
127.4
135.2
137.3
135
136
138.4
134.7
138.4
133.9
133.6
141.2
151.8
155.4
156.6
161.6
160.7
156
159.5
168.7
169.9
169.9
185.9


Summary of compuational transaction
Raw Inputview raw input (R code)
Raw Outputview raw output of R engine
Computing time2 seconds
R Server'Gwilym Jenkins' @ 72.249.127.135

\begin{tabular}{lllllllll}
\hline
Summary of compuational transaction \tabularnewline
Raw Input & view raw input (R code)  \tabularnewline
Raw Output & view raw output of R engine  \tabularnewline
Computing time & 2 seconds \tabularnewline
R Server & 'Gwilym Jenkins' @ 72.249.127.135 \tabularnewline
\hline
\end{tabular}
%Source: https://freestatistics.org/blog/index.php?pk=2262&T=0

[TABLE]
[ROW][C]Summary of compuational transaction[/C][/ROW]
[ROW][C]Raw Input[/C][C]view raw input (R code) [/C][/ROW]
[ROW][C]Raw Output[/C][C]view raw output of R engine [/C][/ROW]
[ROW][C]Computing time[/C][C]2 seconds[/C][/ROW]
[ROW][C]R Server[/C][C]'Gwilym Jenkins' @ 72.249.127.135[/C][/ROW]
[/TABLE]
Source: https://freestatistics.org/blog/index.php?pk=2262&T=0

Globally Unique Identifier (entire table): ba.freestatistics.org/blog/index.php?pk=2262&T=0

As an alternative you can also use a QR Code:  

The GUIDs for individual cells are displayed in the table below:

Summary of compuational transaction
Raw Inputview raw input (R code)
Raw Outputview raw output of R engine
Computing time2 seconds
R Server'Gwilym Jenkins' @ 72.249.127.135


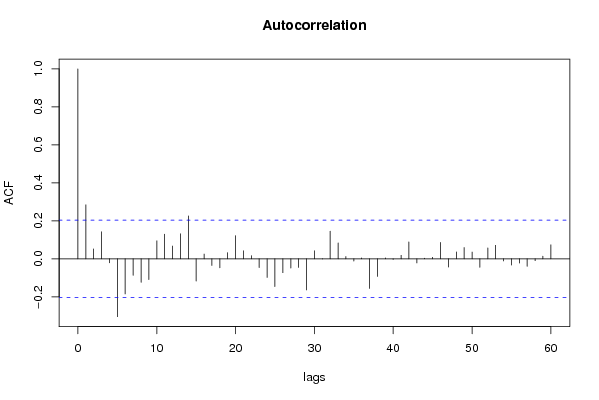
Autocorrelation Function
Time lag kACF(k)T-STATP-value
019.59170
10.2846762.73050.003789
20.0521980.50070.308901
30.1426311.36810.087311
4-0.020495-0.19660.577705
5-0.304248-2.91820.997788
6-0.184722-1.77180.96013
7-0.086861-0.83310.796539
8-0.12315-1.18120.879719
9-0.108707-1.04270.850085
100.095020.91140.182234
110.1302131.2490.107425
120.0672570.64510.260233
130.1320451.26650.104261
140.2261482.16910.016325
15-0.116631-1.11870.866906
160.0252210.24190.404693
17-0.034873-0.33450.630614
18-0.047375-0.45440.674694
190.0328670.31530.376642
200.1219471.16970.122577
210.0421480.40430.343476
220.0165180.15840.43723
23-0.045919-0.44040.669676
24-0.097571-0.93590.824104
25-0.145555-1.39610.91698
26-0.07311-0.70120.75754
27-0.048163-0.4620.677402
28-0.045047-0.43210.666652
29-0.163279-1.56610.939622
300.0422010.40480.343289
31-0.000619-0.00590.502362
320.1459081.39950.082513
330.0837490.80330.211939
340.0121240.11630.453837
35-0.011554-0.11080.544
360.0050670.04860.48067
37-0.155656-1.4930.930571
38-0.092536-0.88760.811459
390.0048410.04640.481532
40-0.00284-0.02720.510836
410.0185550.1780.429569
420.0892790.85630.197019
43-0.021757-0.20870.582423
440.0036140.03470.48621
450.0080770.07750.469209
460.0863990.82870.204707
47-0.043007-0.41250.659536
480.0363930.34910.363917
490.0595960.57160.284486
500.0360740.3460.365062
51-0.044425-0.42610.664489
520.0576040.55250.290968
530.0715310.68610.247187
54-0.010875-0.10430.541424
55-0.032556-0.31230.622227
56-0.022153-0.21250.583901
57-0.039222-0.37620.646186
58-0.009704-0.09310.536978
590.0143760.13790.445314

\begin{tabular}{lllllllll}
\hline
Autocorrelation Function \tabularnewline
Time lag k & ACF(k) & T-STAT & P-value \tabularnewline
0 & 1 & 9.5917 & 0 \tabularnewline
1 & 0.284676 & 2.7305 & 0.003789 \tabularnewline
2 & 0.052198 & 0.5007 & 0.308901 \tabularnewline
3 & 0.142631 & 1.3681 & 0.087311 \tabularnewline
4 & -0.020495 & -0.1966 & 0.577705 \tabularnewline
5 & -0.304248 & -2.9182 & 0.997788 \tabularnewline
6 & -0.184722 & -1.7718 & 0.96013 \tabularnewline
7 & -0.086861 & -0.8331 & 0.796539 \tabularnewline
8 & -0.12315 & -1.1812 & 0.879719 \tabularnewline
9 & -0.108707 & -1.0427 & 0.850085 \tabularnewline
10 & 0.09502 & 0.9114 & 0.182234 \tabularnewline
11 & 0.130213 & 1.249 & 0.107425 \tabularnewline
12 & 0.067257 & 0.6451 & 0.260233 \tabularnewline
13 & 0.132045 & 1.2665 & 0.104261 \tabularnewline
14 & 0.226148 & 2.1691 & 0.016325 \tabularnewline
15 & -0.116631 & -1.1187 & 0.866906 \tabularnewline
16 & 0.025221 & 0.2419 & 0.404693 \tabularnewline
17 & -0.034873 & -0.3345 & 0.630614 \tabularnewline
18 & -0.047375 & -0.4544 & 0.674694 \tabularnewline
19 & 0.032867 & 0.3153 & 0.376642 \tabularnewline
20 & 0.121947 & 1.1697 & 0.122577 \tabularnewline
21 & 0.042148 & 0.4043 & 0.343476 \tabularnewline
22 & 0.016518 & 0.1584 & 0.43723 \tabularnewline
23 & -0.045919 & -0.4404 & 0.669676 \tabularnewline
24 & -0.097571 & -0.9359 & 0.824104 \tabularnewline
25 & -0.145555 & -1.3961 & 0.91698 \tabularnewline
26 & -0.07311 & -0.7012 & 0.75754 \tabularnewline
27 & -0.048163 & -0.462 & 0.677402 \tabularnewline
28 & -0.045047 & -0.4321 & 0.666652 \tabularnewline
29 & -0.163279 & -1.5661 & 0.939622 \tabularnewline
30 & 0.042201 & 0.4048 & 0.343289 \tabularnewline
31 & -0.000619 & -0.0059 & 0.502362 \tabularnewline
32 & 0.145908 & 1.3995 & 0.082513 \tabularnewline
33 & 0.083749 & 0.8033 & 0.211939 \tabularnewline
34 & 0.012124 & 0.1163 & 0.453837 \tabularnewline
35 & -0.011554 & -0.1108 & 0.544 \tabularnewline
36 & 0.005067 & 0.0486 & 0.48067 \tabularnewline
37 & -0.155656 & -1.493 & 0.930571 \tabularnewline
38 & -0.092536 & -0.8876 & 0.811459 \tabularnewline
39 & 0.004841 & 0.0464 & 0.481532 \tabularnewline
40 & -0.00284 & -0.0272 & 0.510836 \tabularnewline
41 & 0.018555 & 0.178 & 0.429569 \tabularnewline
42 & 0.089279 & 0.8563 & 0.197019 \tabularnewline
43 & -0.021757 & -0.2087 & 0.582423 \tabularnewline
44 & 0.003614 & 0.0347 & 0.48621 \tabularnewline
45 & 0.008077 & 0.0775 & 0.469209 \tabularnewline
46 & 0.086399 & 0.8287 & 0.204707 \tabularnewline
47 & -0.043007 & -0.4125 & 0.659536 \tabularnewline
48 & 0.036393 & 0.3491 & 0.363917 \tabularnewline
49 & 0.059596 & 0.5716 & 0.284486 \tabularnewline
50 & 0.036074 & 0.346 & 0.365062 \tabularnewline
51 & -0.044425 & -0.4261 & 0.664489 \tabularnewline
52 & 0.057604 & 0.5525 & 0.290968 \tabularnewline
53 & 0.071531 & 0.6861 & 0.247187 \tabularnewline
54 & -0.010875 & -0.1043 & 0.541424 \tabularnewline
55 & -0.032556 & -0.3123 & 0.622227 \tabularnewline
56 & -0.022153 & -0.2125 & 0.583901 \tabularnewline
57 & -0.039222 & -0.3762 & 0.646186 \tabularnewline
58 & -0.009704 & -0.0931 & 0.536978 \tabularnewline
59 & 0.014376 & 0.1379 & 0.445314 \tabularnewline
\hline
\end{tabular}
%Source: https://freestatistics.org/blog/index.php?pk=2262&T=1

[TABLE]
[ROW][C]Autocorrelation Function[/C][/ROW]
[ROW][C]Time lag k[/C][C]ACF(k)[/C][C]T-STAT[/C][C]P-value[/C][/ROW]
[ROW][C]0[/C][C]1[/C][C]9.5917[/C][C]0[/C][/ROW]
[ROW][C]1[/C][C]0.284676[/C][C]2.7305[/C][C]0.003789[/C][/ROW]
[ROW][C]2[/C][C]0.052198[/C][C]0.5007[/C][C]0.308901[/C][/ROW]
[ROW][C]3[/C][C]0.142631[/C][C]1.3681[/C][C]0.087311[/C][/ROW]
[ROW][C]4[/C][C]-0.020495[/C][C]-0.1966[/C][C]0.577705[/C][/ROW]
[ROW][C]5[/C][C]-0.304248[/C][C]-2.9182[/C][C]0.997788[/C][/ROW]
[ROW][C]6[/C][C]-0.184722[/C][C]-1.7718[/C][C]0.96013[/C][/ROW]
[ROW][C]7[/C][C]-0.086861[/C][C]-0.8331[/C][C]0.796539[/C][/ROW]
[ROW][C]8[/C][C]-0.12315[/C][C]-1.1812[/C][C]0.879719[/C][/ROW]
[ROW][C]9[/C][C]-0.108707[/C][C]-1.0427[/C][C]0.850085[/C][/ROW]
[ROW][C]10[/C][C]0.09502[/C][C]0.9114[/C][C]0.182234[/C][/ROW]
[ROW][C]11[/C][C]0.130213[/C][C]1.249[/C][C]0.107425[/C][/ROW]
[ROW][C]12[/C][C]0.067257[/C][C]0.6451[/C][C]0.260233[/C][/ROW]
[ROW][C]13[/C][C]0.132045[/C][C]1.2665[/C][C]0.104261[/C][/ROW]
[ROW][C]14[/C][C]0.226148[/C][C]2.1691[/C][C]0.016325[/C][/ROW]
[ROW][C]15[/C][C]-0.116631[/C][C]-1.1187[/C][C]0.866906[/C][/ROW]
[ROW][C]16[/C][C]0.025221[/C][C]0.2419[/C][C]0.404693[/C][/ROW]
[ROW][C]17[/C][C]-0.034873[/C][C]-0.3345[/C][C]0.630614[/C][/ROW]
[ROW][C]18[/C][C]-0.047375[/C][C]-0.4544[/C][C]0.674694[/C][/ROW]
[ROW][C]19[/C][C]0.032867[/C][C]0.3153[/C][C]0.376642[/C][/ROW]
[ROW][C]20[/C][C]0.121947[/C][C]1.1697[/C][C]0.122577[/C][/ROW]
[ROW][C]21[/C][C]0.042148[/C][C]0.4043[/C][C]0.343476[/C][/ROW]
[ROW][C]22[/C][C]0.016518[/C][C]0.1584[/C][C]0.43723[/C][/ROW]
[ROW][C]23[/C][C]-0.045919[/C][C]-0.4404[/C][C]0.669676[/C][/ROW]
[ROW][C]24[/C][C]-0.097571[/C][C]-0.9359[/C][C]0.824104[/C][/ROW]
[ROW][C]25[/C][C]-0.145555[/C][C]-1.3961[/C][C]0.91698[/C][/ROW]
[ROW][C]26[/C][C]-0.07311[/C][C]-0.7012[/C][C]0.75754[/C][/ROW]
[ROW][C]27[/C][C]-0.048163[/C][C]-0.462[/C][C]0.677402[/C][/ROW]
[ROW][C]28[/C][C]-0.045047[/C][C]-0.4321[/C][C]0.666652[/C][/ROW]
[ROW][C]29[/C][C]-0.163279[/C][C]-1.5661[/C][C]0.939622[/C][/ROW]
[ROW][C]30[/C][C]0.042201[/C][C]0.4048[/C][C]0.343289[/C][/ROW]
[ROW][C]31[/C][C]-0.000619[/C][C]-0.0059[/C][C]0.502362[/C][/ROW]
[ROW][C]32[/C][C]0.145908[/C][C]1.3995[/C][C]0.082513[/C][/ROW]
[ROW][C]33[/C][C]0.083749[/C][C]0.8033[/C][C]0.211939[/C][/ROW]
[ROW][C]34[/C][C]0.012124[/C][C]0.1163[/C][C]0.453837[/C][/ROW]
[ROW][C]35[/C][C]-0.011554[/C][C]-0.1108[/C][C]0.544[/C][/ROW]
[ROW][C]36[/C][C]0.005067[/C][C]0.0486[/C][C]0.48067[/C][/ROW]
[ROW][C]37[/C][C]-0.155656[/C][C]-1.493[/C][C]0.930571[/C][/ROW]
[ROW][C]38[/C][C]-0.092536[/C][C]-0.8876[/C][C]0.811459[/C][/ROW]
[ROW][C]39[/C][C]0.004841[/C][C]0.0464[/C][C]0.481532[/C][/ROW]
[ROW][C]40[/C][C]-0.00284[/C][C]-0.0272[/C][C]0.510836[/C][/ROW]
[ROW][C]41[/C][C]0.018555[/C][C]0.178[/C][C]0.429569[/C][/ROW]
[ROW][C]42[/C][C]0.089279[/C][C]0.8563[/C][C]0.197019[/C][/ROW]
[ROW][C]43[/C][C]-0.021757[/C][C]-0.2087[/C][C]0.582423[/C][/ROW]
[ROW][C]44[/C][C]0.003614[/C][C]0.0347[/C][C]0.48621[/C][/ROW]
[ROW][C]45[/C][C]0.008077[/C][C]0.0775[/C][C]0.469209[/C][/ROW]
[ROW][C]46[/C][C]0.086399[/C][C]0.8287[/C][C]0.204707[/C][/ROW]
[ROW][C]47[/C][C]-0.043007[/C][C]-0.4125[/C][C]0.659536[/C][/ROW]
[ROW][C]48[/C][C]0.036393[/C][C]0.3491[/C][C]0.363917[/C][/ROW]
[ROW][C]49[/C][C]0.059596[/C][C]0.5716[/C][C]0.284486[/C][/ROW]
[ROW][C]50[/C][C]0.036074[/C][C]0.346[/C][C]0.365062[/C][/ROW]
[ROW][C]51[/C][C]-0.044425[/C][C]-0.4261[/C][C]0.664489[/C][/ROW]
[ROW][C]52[/C][C]0.057604[/C][C]0.5525[/C][C]0.290968[/C][/ROW]
[ROW][C]53[/C][C]0.071531[/C][C]0.6861[/C][C]0.247187[/C][/ROW]
[ROW][C]54[/C][C]-0.010875[/C][C]-0.1043[/C][C]0.541424[/C][/ROW]
[ROW][C]55[/C][C]-0.032556[/C][C]-0.3123[/C][C]0.622227[/C][/ROW]
[ROW][C]56[/C][C]-0.022153[/C][C]-0.2125[/C][C]0.583901[/C][/ROW]
[ROW][C]57[/C][C]-0.039222[/C][C]-0.3762[/C][C]0.646186[/C][/ROW]
[ROW][C]58[/C][C]-0.009704[/C][C]-0.0931[/C][C]0.536978[/C][/ROW]
[ROW][C]59[/C][C]0.014376[/C][C]0.1379[/C][C]0.445314[/C][/ROW]
[/TABLE]
Source: https://freestatistics.org/blog/index.php?pk=2262&T=1

Globally Unique Identifier (entire table): ba.freestatistics.org/blog/index.php?pk=2262&T=1

As an alternative you can also use a QR Code:  

The GUIDs for individual cells are displayed in the table below:

Autocorrelation Function
Time lag kACF(k)T-STATP-value
019.59170
10.2846762.73050.003789
20.0521980.50070.308901
30.1426311.36810.087311
4-0.020495-0.19660.577705
5-0.304248-2.91820.997788
6-0.184722-1.77180.96013
7-0.086861-0.83310.796539
8-0.12315-1.18120.879719
9-0.108707-1.04270.850085
100.095020.91140.182234
110.1302131.2490.107425
120.0672570.64510.260233
130.1320451.26650.104261
140.2261482.16910.016325
15-0.116631-1.11870.866906
160.0252210.24190.404693
17-0.034873-0.33450.630614
18-0.047375-0.45440.674694
190.0328670.31530.376642
200.1219471.16970.122577
210.0421480.40430.343476
220.0165180.15840.43723
23-0.045919-0.44040.669676
24-0.097571-0.93590.824104
25-0.145555-1.39610.91698
26-0.07311-0.70120.75754
27-0.048163-0.4620.677402
28-0.045047-0.43210.666652
29-0.163279-1.56610.939622
300.0422010.40480.343289
31-0.000619-0.00590.502362
320.1459081.39950.082513
330.0837490.80330.211939
340.0121240.11630.453837
35-0.011554-0.11080.544
360.0050670.04860.48067
37-0.155656-1.4930.930571
38-0.092536-0.88760.811459
390.0048410.04640.481532
40-0.00284-0.02720.510836
410.0185550.1780.429569
420.0892790.85630.197019
43-0.021757-0.20870.582423
440.0036140.03470.48621
450.0080770.07750.469209
460.0863990.82870.204707
47-0.043007-0.41250.659536
480.0363930.34910.363917
490.0595960.57160.284486
500.0360740.3460.365062
51-0.044425-0.42610.664489
520.0576040.55250.290968
530.0715310.68610.247187
54-0.010875-0.10430.541424
55-0.032556-0.31230.622227
56-0.022153-0.21250.583901
57-0.039222-0.37620.646186
58-0.009704-0.09310.536978
590.0143760.13790.445314


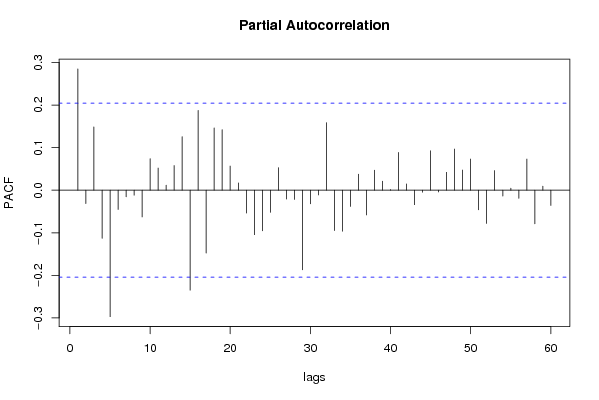
Partial Autocorrelation Function
Time lag kPACF(k)T-STATP-value
00.2846762.73050.003789
1-0.031386-0.3010.617969
20.1484011.42340.079
3-0.112905-1.0830.85917
4-0.296997-2.84870.997292
5-0.045235-0.43390.667303
6-0.015506-0.14870.558952
7-0.011905-0.11420.545331
8-0.062752-0.60190.725639
90.0738210.70810.240348
100.0520150.49890.309516
110.0117820.1130.455135
120.0577340.55380.290541
130.1254961.20370.115893
14-0.234921-2.25330.986691
150.1873441.79690.037813
16-0.147707-1.41680.920034
170.1460411.40080.082323
180.1420761.36270.088144
190.0567040.54390.293917
200.0170540.16360.435212
21-0.053887-0.51690.696756
22-0.104564-1.00290.84074
23-0.095551-0.91650.819097
24-0.052107-0.49980.690792
250.052780.50620.306946
26-0.0208-0.19950.578847
27-0.021675-0.20790.582115
28-0.186977-1.79340.961905
29-0.031966-0.30660.620084
30-0.011267-0.10810.542912
310.1583661.5190.066097
32-0.094875-0.910.817401
33-0.09617-0.92240.820642
34-0.038125-0.36570.64228
350.0376640.36130.359365
36-0.058301-0.55920.71131
370.0470480.45130.326429
380.0211190.20260.41996
390.0013560.0130.494826
400.0885270.84910.19901
410.0147510.14150.443897
42-0.033985-0.3260.627406
43-0.004687-0.0450.51788
440.0924540.88680.188752
45-0.004038-0.03870.515407
460.0420770.40360.343725
470.0966010.92660.178289
480.0473440.45410.325409
490.0729950.70010.242803
50-0.046023-0.44140.670035
51-0.078026-0.74840.771937
520.0459680.44090.330156
53-0.013953-0.13380.553085
540.00480.0460.481688
55-0.019-0.18220.572101
560.0731550.70170.242325
57-0.07907-0.75840.77493
580.0093220.08940.464473
59-0.035817-0.34350.634015

\begin{tabular}{lllllllll}
\hline
Partial Autocorrelation Function \tabularnewline
Time lag k & PACF(k) & T-STAT & P-value \tabularnewline
0 & 0.284676 & 2.7305 & 0.003789 \tabularnewline
1 & -0.031386 & -0.301 & 0.617969 \tabularnewline
2 & 0.148401 & 1.4234 & 0.079 \tabularnewline
3 & -0.112905 & -1.083 & 0.85917 \tabularnewline
4 & -0.296997 & -2.8487 & 0.997292 \tabularnewline
5 & -0.045235 & -0.4339 & 0.667303 \tabularnewline
6 & -0.015506 & -0.1487 & 0.558952 \tabularnewline
7 & -0.011905 & -0.1142 & 0.545331 \tabularnewline
8 & -0.062752 & -0.6019 & 0.725639 \tabularnewline
9 & 0.073821 & 0.7081 & 0.240348 \tabularnewline
10 & 0.052015 & 0.4989 & 0.309516 \tabularnewline
11 & 0.011782 & 0.113 & 0.455135 \tabularnewline
12 & 0.057734 & 0.5538 & 0.290541 \tabularnewline
13 & 0.125496 & 1.2037 & 0.115893 \tabularnewline
14 & -0.234921 & -2.2533 & 0.986691 \tabularnewline
15 & 0.187344 & 1.7969 & 0.037813 \tabularnewline
16 & -0.147707 & -1.4168 & 0.920034 \tabularnewline
17 & 0.146041 & 1.4008 & 0.082323 \tabularnewline
18 & 0.142076 & 1.3627 & 0.088144 \tabularnewline
19 & 0.056704 & 0.5439 & 0.293917 \tabularnewline
20 & 0.017054 & 0.1636 & 0.435212 \tabularnewline
21 & -0.053887 & -0.5169 & 0.696756 \tabularnewline
22 & -0.104564 & -1.0029 & 0.84074 \tabularnewline
23 & -0.095551 & -0.9165 & 0.819097 \tabularnewline
24 & -0.052107 & -0.4998 & 0.690792 \tabularnewline
25 & 0.05278 & 0.5062 & 0.306946 \tabularnewline
26 & -0.0208 & -0.1995 & 0.578847 \tabularnewline
27 & -0.021675 & -0.2079 & 0.582115 \tabularnewline
28 & -0.186977 & -1.7934 & 0.961905 \tabularnewline
29 & -0.031966 & -0.3066 & 0.620084 \tabularnewline
30 & -0.011267 & -0.1081 & 0.542912 \tabularnewline
31 & 0.158366 & 1.519 & 0.066097 \tabularnewline
32 & -0.094875 & -0.91 & 0.817401 \tabularnewline
33 & -0.09617 & -0.9224 & 0.820642 \tabularnewline
34 & -0.038125 & -0.3657 & 0.64228 \tabularnewline
35 & 0.037664 & 0.3613 & 0.359365 \tabularnewline
36 & -0.058301 & -0.5592 & 0.71131 \tabularnewline
37 & 0.047048 & 0.4513 & 0.326429 \tabularnewline
38 & 0.021119 & 0.2026 & 0.41996 \tabularnewline
39 & 0.001356 & 0.013 & 0.494826 \tabularnewline
40 & 0.088527 & 0.8491 & 0.19901 \tabularnewline
41 & 0.014751 & 0.1415 & 0.443897 \tabularnewline
42 & -0.033985 & -0.326 & 0.627406 \tabularnewline
43 & -0.004687 & -0.045 & 0.51788 \tabularnewline
44 & 0.092454 & 0.8868 & 0.188752 \tabularnewline
45 & -0.004038 & -0.0387 & 0.515407 \tabularnewline
46 & 0.042077 & 0.4036 & 0.343725 \tabularnewline
47 & 0.096601 & 0.9266 & 0.178289 \tabularnewline
48 & 0.047344 & 0.4541 & 0.325409 \tabularnewline
49 & 0.072995 & 0.7001 & 0.242803 \tabularnewline
50 & -0.046023 & -0.4414 & 0.670035 \tabularnewline
51 & -0.078026 & -0.7484 & 0.771937 \tabularnewline
52 & 0.045968 & 0.4409 & 0.330156 \tabularnewline
53 & -0.013953 & -0.1338 & 0.553085 \tabularnewline
54 & 0.0048 & 0.046 & 0.481688 \tabularnewline
55 & -0.019 & -0.1822 & 0.572101 \tabularnewline
56 & 0.073155 & 0.7017 & 0.242325 \tabularnewline
57 & -0.07907 & -0.7584 & 0.77493 \tabularnewline
58 & 0.009322 & 0.0894 & 0.464473 \tabularnewline
59 & -0.035817 & -0.3435 & 0.634015 \tabularnewline
\hline
\end{tabular}
%Source: https://freestatistics.org/blog/index.php?pk=2262&T=2

[TABLE]
[ROW][C]Partial Autocorrelation Function[/C][/ROW]
[ROW][C]Time lag k[/C][C]PACF(k)[/C][C]T-STAT[/C][C]P-value[/C][/ROW]
[ROW][C]0[/C][C]0.284676[/C][C]2.7305[/C][C]0.003789[/C][/ROW]
[ROW][C]1[/C][C]-0.031386[/C][C]-0.301[/C][C]0.617969[/C][/ROW]
[ROW][C]2[/C][C]0.148401[/C][C]1.4234[/C][C]0.079[/C][/ROW]
[ROW][C]3[/C][C]-0.112905[/C][C]-1.083[/C][C]0.85917[/C][/ROW]
[ROW][C]4[/C][C]-0.296997[/C][C]-2.8487[/C][C]0.997292[/C][/ROW]
[ROW][C]5[/C][C]-0.045235[/C][C]-0.4339[/C][C]0.667303[/C][/ROW]
[ROW][C]6[/C][C]-0.015506[/C][C]-0.1487[/C][C]0.558952[/C][/ROW]
[ROW][C]7[/C][C]-0.011905[/C][C]-0.1142[/C][C]0.545331[/C][/ROW]
[ROW][C]8[/C][C]-0.062752[/C][C]-0.6019[/C][C]0.725639[/C][/ROW]
[ROW][C]9[/C][C]0.073821[/C][C]0.7081[/C][C]0.240348[/C][/ROW]
[ROW][C]10[/C][C]0.052015[/C][C]0.4989[/C][C]0.309516[/C][/ROW]
[ROW][C]11[/C][C]0.011782[/C][C]0.113[/C][C]0.455135[/C][/ROW]
[ROW][C]12[/C][C]0.057734[/C][C]0.5538[/C][C]0.290541[/C][/ROW]
[ROW][C]13[/C][C]0.125496[/C][C]1.2037[/C][C]0.115893[/C][/ROW]
[ROW][C]14[/C][C]-0.234921[/C][C]-2.2533[/C][C]0.986691[/C][/ROW]
[ROW][C]15[/C][C]0.187344[/C][C]1.7969[/C][C]0.037813[/C][/ROW]
[ROW][C]16[/C][C]-0.147707[/C][C]-1.4168[/C][C]0.920034[/C][/ROW]
[ROW][C]17[/C][C]0.146041[/C][C]1.4008[/C][C]0.082323[/C][/ROW]
[ROW][C]18[/C][C]0.142076[/C][C]1.3627[/C][C]0.088144[/C][/ROW]
[ROW][C]19[/C][C]0.056704[/C][C]0.5439[/C][C]0.293917[/C][/ROW]
[ROW][C]20[/C][C]0.017054[/C][C]0.1636[/C][C]0.435212[/C][/ROW]
[ROW][C]21[/C][C]-0.053887[/C][C]-0.5169[/C][C]0.696756[/C][/ROW]
[ROW][C]22[/C][C]-0.104564[/C][C]-1.0029[/C][C]0.84074[/C][/ROW]
[ROW][C]23[/C][C]-0.095551[/C][C]-0.9165[/C][C]0.819097[/C][/ROW]
[ROW][C]24[/C][C]-0.052107[/C][C]-0.4998[/C][C]0.690792[/C][/ROW]
[ROW][C]25[/C][C]0.05278[/C][C]0.5062[/C][C]0.306946[/C][/ROW]
[ROW][C]26[/C][C]-0.0208[/C][C]-0.1995[/C][C]0.578847[/C][/ROW]
[ROW][C]27[/C][C]-0.021675[/C][C]-0.2079[/C][C]0.582115[/C][/ROW]
[ROW][C]28[/C][C]-0.186977[/C][C]-1.7934[/C][C]0.961905[/C][/ROW]
[ROW][C]29[/C][C]-0.031966[/C][C]-0.3066[/C][C]0.620084[/C][/ROW]
[ROW][C]30[/C][C]-0.011267[/C][C]-0.1081[/C][C]0.542912[/C][/ROW]
[ROW][C]31[/C][C]0.158366[/C][C]1.519[/C][C]0.066097[/C][/ROW]
[ROW][C]32[/C][C]-0.094875[/C][C]-0.91[/C][C]0.817401[/C][/ROW]
[ROW][C]33[/C][C]-0.09617[/C][C]-0.9224[/C][C]0.820642[/C][/ROW]
[ROW][C]34[/C][C]-0.038125[/C][C]-0.3657[/C][C]0.64228[/C][/ROW]
[ROW][C]35[/C][C]0.037664[/C][C]0.3613[/C][C]0.359365[/C][/ROW]
[ROW][C]36[/C][C]-0.058301[/C][C]-0.5592[/C][C]0.71131[/C][/ROW]
[ROW][C]37[/C][C]0.047048[/C][C]0.4513[/C][C]0.326429[/C][/ROW]
[ROW][C]38[/C][C]0.021119[/C][C]0.2026[/C][C]0.41996[/C][/ROW]
[ROW][C]39[/C][C]0.001356[/C][C]0.013[/C][C]0.494826[/C][/ROW]
[ROW][C]40[/C][C]0.088527[/C][C]0.8491[/C][C]0.19901[/C][/ROW]
[ROW][C]41[/C][C]0.014751[/C][C]0.1415[/C][C]0.443897[/C][/ROW]
[ROW][C]42[/C][C]-0.033985[/C][C]-0.326[/C][C]0.627406[/C][/ROW]
[ROW][C]43[/C][C]-0.004687[/C][C]-0.045[/C][C]0.51788[/C][/ROW]
[ROW][C]44[/C][C]0.092454[/C][C]0.8868[/C][C]0.188752[/C][/ROW]
[ROW][C]45[/C][C]-0.004038[/C][C]-0.0387[/C][C]0.515407[/C][/ROW]
[ROW][C]46[/C][C]0.042077[/C][C]0.4036[/C][C]0.343725[/C][/ROW]
[ROW][C]47[/C][C]0.096601[/C][C]0.9266[/C][C]0.178289[/C][/ROW]
[ROW][C]48[/C][C]0.047344[/C][C]0.4541[/C][C]0.325409[/C][/ROW]
[ROW][C]49[/C][C]0.072995[/C][C]0.7001[/C][C]0.242803[/C][/ROW]
[ROW][C]50[/C][C]-0.046023[/C][C]-0.4414[/C][C]0.670035[/C][/ROW]
[ROW][C]51[/C][C]-0.078026[/C][C]-0.7484[/C][C]0.771937[/C][/ROW]
[ROW][C]52[/C][C]0.045968[/C][C]0.4409[/C][C]0.330156[/C][/ROW]
[ROW][C]53[/C][C]-0.013953[/C][C]-0.1338[/C][C]0.553085[/C][/ROW]
[ROW][C]54[/C][C]0.0048[/C][C]0.046[/C][C]0.481688[/C][/ROW]
[ROW][C]55[/C][C]-0.019[/C][C]-0.1822[/C][C]0.572101[/C][/ROW]
[ROW][C]56[/C][C]0.073155[/C][C]0.7017[/C][C]0.242325[/C][/ROW]
[ROW][C]57[/C][C]-0.07907[/C][C]-0.7584[/C][C]0.77493[/C][/ROW]
[ROW][C]58[/C][C]0.009322[/C][C]0.0894[/C][C]0.464473[/C][/ROW]
[ROW][C]59[/C][C]-0.035817[/C][C]-0.3435[/C][C]0.634015[/C][/ROW]
[/TABLE]
Source: https://freestatistics.org/blog/index.php?pk=2262&T=2

Globally Unique Identifier (entire table): ba.freestatistics.org/blog/index.php?pk=2262&T=2

As an alternative you can also use a QR Code:  

The GUIDs for individual cells are displayed in the table below:

Partial Autocorrelation Function
Time lag kPACF(k)T-STATP-value
00.2846762.73050.003789
1-0.031386-0.3010.617969
20.1484011.42340.079
3-0.112905-1.0830.85917
4-0.296997-2.84870.997292
5-0.045235-0.43390.667303
6-0.015506-0.14870.558952
7-0.011905-0.11420.545331
8-0.062752-0.60190.725639
90.0738210.70810.240348
100.0520150.49890.309516
110.0117820.1130.455135
120.0577340.55380.290541
130.1254961.20370.115893
14-0.234921-2.25330.986691
150.1873441.79690.037813
16-0.147707-1.41680.920034
170.1460411.40080.082323
180.1420761.36270.088144
190.0567040.54390.293917
200.0170540.16360.435212
21-0.053887-0.51690.696756
22-0.104564-1.00290.84074
23-0.095551-0.91650.819097
24-0.052107-0.49980.690792
250.052780.50620.306946
26-0.0208-0.19950.578847
27-0.021675-0.20790.582115
28-0.186977-1.79340.961905
29-0.031966-0.30660.620084
30-0.011267-0.10810.542912
310.1583661.5190.066097
32-0.094875-0.910.817401
33-0.09617-0.92240.820642
34-0.038125-0.36570.64228
350.0376640.36130.359365
36-0.058301-0.55920.71131
370.0470480.45130.326429
380.0211190.20260.41996
390.0013560.0130.494826
400.0885270.84910.19901
410.0147510.14150.443897
42-0.033985-0.3260.627406
43-0.004687-0.0450.51788
440.0924540.88680.188752
45-0.004038-0.03870.515407
460.0420770.40360.343725
470.0966010.92660.178289
480.0473440.45410.325409
490.0729950.70010.242803
50-0.046023-0.44140.670035
51-0.078026-0.74840.771937
520.0459680.44090.330156
53-0.013953-0.13380.553085
540.00480.0460.481688
55-0.019-0.18220.572101
560.0731550.70170.242325
57-0.07907-0.75840.77493
580.0093220.08940.464473
59-0.035817-0.34350.634015


Parameters (Session):
par1 = 60 ; par2 = 1 ; par3 = 1 ; par4 = 0 ; par5 = 12 ;
Parameters (R input):
par1 = 60 ; par2 = 1 ; par3 = 1 ; par4 = 0 ; par5 = 12 ;
R code (references can be found in the software module):
if (par1 == 'Default') {
par1 = 10*log10(length(x))
} else {
par1 <- as.numeric(par1)
}
par2 <- as.numeric(par2)
par3 <- as.numeric(par3)
par4 <- as.numeric(par4)
par5 <- as.numeric(par5)
if (par2 == 0) {
x <- log(x)
} else {
x <- (x ^ par2 - 1) / par2
}
if (par3 > 0) x <- diff(x,lag=1,difference=par3)
if (par4 > 0) x <- diff(x,lag=par5,difference=par4)
bitmap(file='pic1.png')
racf <- acf(x,par1,main='Autocorrelation',xlab='lags',ylab='ACF')
dev.off()
bitmap(file='pic2.png')
rpacf <- pacf(x,par1,main='Partial Autocorrelation',xlab='lags',ylab='PACF')
dev.off()
(myacf <- c(racf$acf))
(mypacf <- c(rpacf$acf))
lengthx <- length(x)
sqrtn <- sqrt(lengthx)
load(file='createtable')
a<-table.start()
a<-table.row.start(a)
a<-table.element(a,'Autocorrelation Function',4,TRUE)
a<-table.row.end(a)
a<-table.row.start(a)
a<-table.element(a,'Time lag k',header=TRUE)
a<-table.element(a,hyperlink('basics.htm','ACF(k)','click here for more information about the Autocorrelation Function'),header=TRUE)
a<-table.element(a,'T-STAT',header=TRUE)
a<-table.element(a,'P-value',header=TRUE)
a<-table.row.end(a)
for (i in 1:par1) {
a<-table.row.start(a)
a<-table.element(a,i-1,header=TRUE)
a<-table.element(a,round(myacf[i],6))
mytstat <- myacf[i]*sqrtn
a<-table.element(a,round(mytstat,4))
a<-table.element(a,round(1-pt(mytstat,lengthx),6))
a<-table.row.end(a)
}
a<-table.end(a)
table.save(a,file='mytable.tab')
a<-table.start()
a<-table.row.start(a)
a<-table.element(a,'Partial Autocorrelation Function',4,TRUE)
a<-table.row.end(a)
a<-table.row.start(a)
a<-table.element(a,'Time lag k',header=TRUE)
a<-table.element(a,hyperlink('basics.htm','PACF(k)','click here for more information about the Partial Autocorrelation Function'),header=TRUE)
a<-table.element(a,'T-STAT',header=TRUE)
a<-table.element(a,'P-value',header=TRUE)
a<-table.row.end(a)
for (i in 1:par1) {
a<-table.row.start(a)
a<-table.element(a,i-1,header=TRUE)
a<-table.element(a,round(mypacf[i],6))
mytstat <- mypacf[i]*sqrtn
a<-table.element(a,round(mytstat,4))
a<-table.element(a,round(1-pt(mytstat,lengthx),6))
a<-table.row.end(a)
}
a<-table.end(a)
table.save(a,file='mytable1.tab')