Free Statistics

of Irreproducible Research!

Author's title

Author*Unverified author*
R Software Modulerwasp_autocorrelation.wasp
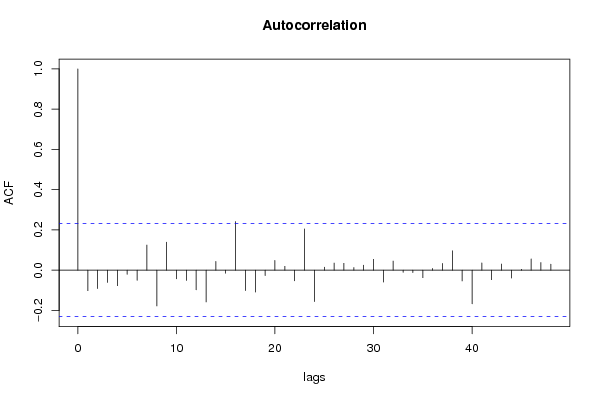
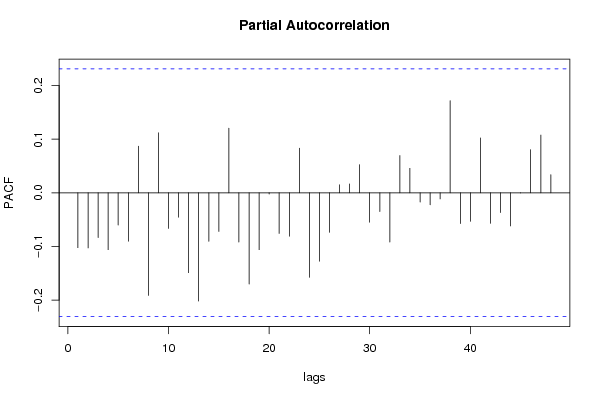
Title produced by software(Partial) Autocorrelation Function
Date of computationFri, 30 Nov 2007 17:15:20 -0700
Cite this page as followsStatistical Computations at FreeStatistics.org, Office for Research Development and Education, URL https://freestatistics.org/blog/index.php?v=date/2007/Dec/01/t1196467448tmlxwp041ishysp.htm/, Retrieved Sun, 19 May 2024 19:08:51 +0000
Statistical Computations at FreeStatistics.org, Office for Research Development and Education, URL https://freestatistics.org/blog/index.php?pk=2191, Retrieved Sun, 19 May 2024 19:08:51 +0000
QR Codes:

Original text written by user:
IsPrivate?No (this computation is public)
User-defined keywords
Estimated Impact231
Family? (F = Feedback message, R = changed R code, M = changed R Module, P = changed Parameters, D = changed Data)
-       [(Partial) Autocorrelation Function] [] [2007-12-01 00:15:20] [94abaf6e1c7b1fd4f9d5e2c2d987f350] [Current]
Feedback Forum

Post a new message
Dataseries X:
87
75
74
91
101
103
106
102
105
105
100
95
96
98
99
92
84
81
72
89
96
91
88
90
98
87
100
100
104
107
105
102
98
106
97
101
100
93
94
96
96
98
102
95
85
84
82
87
77
90
90
94
97
96
93
93
93
97
100
95
97
103
102
93
99
100
97
104
102
103
100
90
90


Summary of compuational transaction
Raw Inputview raw input (R code)
Raw Outputview raw output of R engine
Computing time2 seconds
R Server'Gwilym Jenkins' @ 72.249.127.135

\begin{tabular}{lllllllll}
\hline
Summary of compuational transaction \tabularnewline
Raw Input & view raw input (R code)  \tabularnewline
Raw Output & view raw output of R engine  \tabularnewline
Computing time & 2 seconds \tabularnewline
R Server & 'Gwilym Jenkins' @ 72.249.127.135 \tabularnewline
\hline
\end{tabular}
%Source: https://freestatistics.org/blog/index.php?pk=2191&T=0

[TABLE]
[ROW][C]Summary of compuational transaction[/C][/ROW]
[ROW][C]Raw Input[/C][C]view raw input (R code) [/C][/ROW]
[ROW][C]Raw Output[/C][C]view raw output of R engine [/C][/ROW]
[ROW][C]Computing time[/C][C]2 seconds[/C][/ROW]
[ROW][C]R Server[/C][C]'Gwilym Jenkins' @ 72.249.127.135[/C][/ROW]
[/TABLE]
Source: https://freestatistics.org/blog/index.php?pk=2191&T=0

Globally Unique Identifier (entire table): ba.freestatistics.org/blog/index.php?pk=2191&T=0

As an alternative you can also use a QR Code:  

The GUIDs for individual cells are displayed in the table below:

Summary of compuational transaction
Raw Inputview raw input (R code)
Raw Outputview raw output of R engine
Computing time2 seconds
R Server'Gwilym Jenkins' @ 72.249.127.135


Autocorrelation Function
Time lag kACF(k)T-STATP-value
018.48530
1-0.102261-0.86770.805784
2-0.091381-0.77540.779676
3-0.060962-0.51730.696728
4-0.077001-0.65340.742203
5-0.020646-0.17520.569287
6-0.050697-0.43020.665824
70.1248941.05980.146398
8-0.177453-1.50570.931746
90.1390431.17980.120978
10-0.043133-0.3660.642279
11-0.050961-0.43240.666635
12-0.097633-0.82840.794922
13-0.157612-1.33740.907347
140.043440.36860.356754
15-0.01482-0.12580.54986
160.2418522.05220.021894
17-0.10112-0.8580.80314
18-0.108626-0.92170.820124
19-0.027008-0.22920.590309
200.0485930.41230.340663
210.0194630.16510.434646
22-0.053086-0.45040.67313
230.2051511.74080.042998
24-0.15587-1.32260.904923
250.0150860.1280.449249
260.035620.30220.381667
270.0341160.28950.386523
280.0127970.10860.456915
290.0248440.21080.416815
300.0541730.45970.323568
31-0.059261-0.50280.691697
320.0453160.38450.350863
33-0.01055-0.08950.53554
34-0.012131-0.10290.540849
35-0.037102-0.31480.623096
360.0084490.07170.471523
370.0333730.28320.388927
380.0964350.81830.207949
39-0.053588-0.45470.674656
40-0.166915-1.41630.919503
410.036010.30560.380413
42-0.047221-0.40070.655079
430.0303610.25760.398718
44-0.038996-0.33090.629155
450.0045140.03830.484776
460.0556820.47250.319007
470.0379090.32170.374318

\begin{tabular}{lllllllll}
\hline
Autocorrelation Function \tabularnewline
Time lag k & ACF(k) & T-STAT & P-value \tabularnewline
0 & 1 & 8.4853 & 0 \tabularnewline
1 & -0.102261 & -0.8677 & 0.805784 \tabularnewline
2 & -0.091381 & -0.7754 & 0.779676 \tabularnewline
3 & -0.060962 & -0.5173 & 0.696728 \tabularnewline
4 & -0.077001 & -0.6534 & 0.742203 \tabularnewline
5 & -0.020646 & -0.1752 & 0.569287 \tabularnewline
6 & -0.050697 & -0.4302 & 0.665824 \tabularnewline
7 & 0.124894 & 1.0598 & 0.146398 \tabularnewline
8 & -0.177453 & -1.5057 & 0.931746 \tabularnewline
9 & 0.139043 & 1.1798 & 0.120978 \tabularnewline
10 & -0.043133 & -0.366 & 0.642279 \tabularnewline
11 & -0.050961 & -0.4324 & 0.666635 \tabularnewline
12 & -0.097633 & -0.8284 & 0.794922 \tabularnewline
13 & -0.157612 & -1.3374 & 0.907347 \tabularnewline
14 & 0.04344 & 0.3686 & 0.356754 \tabularnewline
15 & -0.01482 & -0.1258 & 0.54986 \tabularnewline
16 & 0.241852 & 2.0522 & 0.021894 \tabularnewline
17 & -0.10112 & -0.858 & 0.80314 \tabularnewline
18 & -0.108626 & -0.9217 & 0.820124 \tabularnewline
19 & -0.027008 & -0.2292 & 0.590309 \tabularnewline
20 & 0.048593 & 0.4123 & 0.340663 \tabularnewline
21 & 0.019463 & 0.1651 & 0.434646 \tabularnewline
22 & -0.053086 & -0.4504 & 0.67313 \tabularnewline
23 & 0.205151 & 1.7408 & 0.042998 \tabularnewline
24 & -0.15587 & -1.3226 & 0.904923 \tabularnewline
25 & 0.015086 & 0.128 & 0.449249 \tabularnewline
26 & 0.03562 & 0.3022 & 0.381667 \tabularnewline
27 & 0.034116 & 0.2895 & 0.386523 \tabularnewline
28 & 0.012797 & 0.1086 & 0.456915 \tabularnewline
29 & 0.024844 & 0.2108 & 0.416815 \tabularnewline
30 & 0.054173 & 0.4597 & 0.323568 \tabularnewline
31 & -0.059261 & -0.5028 & 0.691697 \tabularnewline
32 & 0.045316 & 0.3845 & 0.350863 \tabularnewline
33 & -0.01055 & -0.0895 & 0.53554 \tabularnewline
34 & -0.012131 & -0.1029 & 0.540849 \tabularnewline
35 & -0.037102 & -0.3148 & 0.623096 \tabularnewline
36 & 0.008449 & 0.0717 & 0.471523 \tabularnewline
37 & 0.033373 & 0.2832 & 0.388927 \tabularnewline
38 & 0.096435 & 0.8183 & 0.207949 \tabularnewline
39 & -0.053588 & -0.4547 & 0.674656 \tabularnewline
40 & -0.166915 & -1.4163 & 0.919503 \tabularnewline
41 & 0.03601 & 0.3056 & 0.380413 \tabularnewline
42 & -0.047221 & -0.4007 & 0.655079 \tabularnewline
43 & 0.030361 & 0.2576 & 0.398718 \tabularnewline
44 & -0.038996 & -0.3309 & 0.629155 \tabularnewline
45 & 0.004514 & 0.0383 & 0.484776 \tabularnewline
46 & 0.055682 & 0.4725 & 0.319007 \tabularnewline
47 & 0.037909 & 0.3217 & 0.374318 \tabularnewline
\hline
\end{tabular}
%Source: https://freestatistics.org/blog/index.php?pk=2191&T=1

[TABLE]
[ROW][C]Autocorrelation Function[/C][/ROW]
[ROW][C]Time lag k[/C][C]ACF(k)[/C][C]T-STAT[/C][C]P-value[/C][/ROW]
[ROW][C]0[/C][C]1[/C][C]8.4853[/C][C]0[/C][/ROW]
[ROW][C]1[/C][C]-0.102261[/C][C]-0.8677[/C][C]0.805784[/C][/ROW]
[ROW][C]2[/C][C]-0.091381[/C][C]-0.7754[/C][C]0.779676[/C][/ROW]
[ROW][C]3[/C][C]-0.060962[/C][C]-0.5173[/C][C]0.696728[/C][/ROW]
[ROW][C]4[/C][C]-0.077001[/C][C]-0.6534[/C][C]0.742203[/C][/ROW]
[ROW][C]5[/C][C]-0.020646[/C][C]-0.1752[/C][C]0.569287[/C][/ROW]
[ROW][C]6[/C][C]-0.050697[/C][C]-0.4302[/C][C]0.665824[/C][/ROW]
[ROW][C]7[/C][C]0.124894[/C][C]1.0598[/C][C]0.146398[/C][/ROW]
[ROW][C]8[/C][C]-0.177453[/C][C]-1.5057[/C][C]0.931746[/C][/ROW]
[ROW][C]9[/C][C]0.139043[/C][C]1.1798[/C][C]0.120978[/C][/ROW]
[ROW][C]10[/C][C]-0.043133[/C][C]-0.366[/C][C]0.642279[/C][/ROW]
[ROW][C]11[/C][C]-0.050961[/C][C]-0.4324[/C][C]0.666635[/C][/ROW]
[ROW][C]12[/C][C]-0.097633[/C][C]-0.8284[/C][C]0.794922[/C][/ROW]
[ROW][C]13[/C][C]-0.157612[/C][C]-1.3374[/C][C]0.907347[/C][/ROW]
[ROW][C]14[/C][C]0.04344[/C][C]0.3686[/C][C]0.356754[/C][/ROW]
[ROW][C]15[/C][C]-0.01482[/C][C]-0.1258[/C][C]0.54986[/C][/ROW]
[ROW][C]16[/C][C]0.241852[/C][C]2.0522[/C][C]0.021894[/C][/ROW]
[ROW][C]17[/C][C]-0.10112[/C][C]-0.858[/C][C]0.80314[/C][/ROW]
[ROW][C]18[/C][C]-0.108626[/C][C]-0.9217[/C][C]0.820124[/C][/ROW]
[ROW][C]19[/C][C]-0.027008[/C][C]-0.2292[/C][C]0.590309[/C][/ROW]
[ROW][C]20[/C][C]0.048593[/C][C]0.4123[/C][C]0.340663[/C][/ROW]
[ROW][C]21[/C][C]0.019463[/C][C]0.1651[/C][C]0.434646[/C][/ROW]
[ROW][C]22[/C][C]-0.053086[/C][C]-0.4504[/C][C]0.67313[/C][/ROW]
[ROW][C]23[/C][C]0.205151[/C][C]1.7408[/C][C]0.042998[/C][/ROW]
[ROW][C]24[/C][C]-0.15587[/C][C]-1.3226[/C][C]0.904923[/C][/ROW]
[ROW][C]25[/C][C]0.015086[/C][C]0.128[/C][C]0.449249[/C][/ROW]
[ROW][C]26[/C][C]0.03562[/C][C]0.3022[/C][C]0.381667[/C][/ROW]
[ROW][C]27[/C][C]0.034116[/C][C]0.2895[/C][C]0.386523[/C][/ROW]
[ROW][C]28[/C][C]0.012797[/C][C]0.1086[/C][C]0.456915[/C][/ROW]
[ROW][C]29[/C][C]0.024844[/C][C]0.2108[/C][C]0.416815[/C][/ROW]
[ROW][C]30[/C][C]0.054173[/C][C]0.4597[/C][C]0.323568[/C][/ROW]
[ROW][C]31[/C][C]-0.059261[/C][C]-0.5028[/C][C]0.691697[/C][/ROW]
[ROW][C]32[/C][C]0.045316[/C][C]0.3845[/C][C]0.350863[/C][/ROW]
[ROW][C]33[/C][C]-0.01055[/C][C]-0.0895[/C][C]0.53554[/C][/ROW]
[ROW][C]34[/C][C]-0.012131[/C][C]-0.1029[/C][C]0.540849[/C][/ROW]
[ROW][C]35[/C][C]-0.037102[/C][C]-0.3148[/C][C]0.623096[/C][/ROW]
[ROW][C]36[/C][C]0.008449[/C][C]0.0717[/C][C]0.471523[/C][/ROW]
[ROW][C]37[/C][C]0.033373[/C][C]0.2832[/C][C]0.388927[/C][/ROW]
[ROW][C]38[/C][C]0.096435[/C][C]0.8183[/C][C]0.207949[/C][/ROW]
[ROW][C]39[/C][C]-0.053588[/C][C]-0.4547[/C][C]0.674656[/C][/ROW]
[ROW][C]40[/C][C]-0.166915[/C][C]-1.4163[/C][C]0.919503[/C][/ROW]
[ROW][C]41[/C][C]0.03601[/C][C]0.3056[/C][C]0.380413[/C][/ROW]
[ROW][C]42[/C][C]-0.047221[/C][C]-0.4007[/C][C]0.655079[/C][/ROW]
[ROW][C]43[/C][C]0.030361[/C][C]0.2576[/C][C]0.398718[/C][/ROW]
[ROW][C]44[/C][C]-0.038996[/C][C]-0.3309[/C][C]0.629155[/C][/ROW]
[ROW][C]45[/C][C]0.004514[/C][C]0.0383[/C][C]0.484776[/C][/ROW]
[ROW][C]46[/C][C]0.055682[/C][C]0.4725[/C][C]0.319007[/C][/ROW]
[ROW][C]47[/C][C]0.037909[/C][C]0.3217[/C][C]0.374318[/C][/ROW]
[/TABLE]
Source: https://freestatistics.org/blog/index.php?pk=2191&T=1

Globally Unique Identifier (entire table): ba.freestatistics.org/blog/index.php?pk=2191&T=1

As an alternative you can also use a QR Code:  

The GUIDs for individual cells are displayed in the table below:

Autocorrelation Function
Time lag kACF(k)T-STATP-value
018.48530
1-0.102261-0.86770.805784
2-0.091381-0.77540.779676
3-0.060962-0.51730.696728
4-0.077001-0.65340.742203
5-0.020646-0.17520.569287
6-0.050697-0.43020.665824
70.1248941.05980.146398
8-0.177453-1.50570.931746
90.1390431.17980.120978
10-0.043133-0.3660.642279
11-0.050961-0.43240.666635
12-0.097633-0.82840.794922
13-0.157612-1.33740.907347
140.043440.36860.356754
15-0.01482-0.12580.54986
160.2418522.05220.021894
17-0.10112-0.8580.80314
18-0.108626-0.92170.820124
19-0.027008-0.22920.590309
200.0485930.41230.340663
210.0194630.16510.434646
22-0.053086-0.45040.67313
230.2051511.74080.042998
24-0.15587-1.32260.904923
250.0150860.1280.449249
260.035620.30220.381667
270.0341160.28950.386523
280.0127970.10860.456915
290.0248440.21080.416815
300.0541730.45970.323568
31-0.059261-0.50280.691697
320.0453160.38450.350863
33-0.01055-0.08950.53554
34-0.012131-0.10290.540849
35-0.037102-0.31480.623096
360.0084490.07170.471523
370.0333730.28320.388927
380.0964350.81830.207949
39-0.053588-0.45470.674656
40-0.166915-1.41630.919503
410.036010.30560.380413
42-0.047221-0.40070.655079
430.0303610.25760.398718
44-0.038996-0.33090.629155
450.0045140.03830.484776
460.0556820.47250.319007
470.0379090.32170.374318


Partial Autocorrelation Function
Time lag kPACF(k)T-STATP-value
0-0.102261-0.86770.805784
1-0.102914-0.87330.807287
2-0.083542-0.70890.759655
3-0.106158-0.90080.814645
4-0.060251-0.51120.69463
5-0.090258-0.76590.77687
60.0868860.73730.231681
7-0.191383-1.62390.94562
80.1119690.95010.172623
9-0.066439-0.56370.712662
10-0.045408-0.38530.649424
11-0.148938-1.26380.894807
12-0.20195-1.71360.954548
13-0.090459-0.76760.777374
14-0.071975-0.61070.728349
150.1204311.02190.155127
16-0.09194-0.78010.781065
17-0.170313-1.44520.923624
18-0.106039-0.89980.814379
19-0.002275-0.01930.507673
20-0.07588-0.64390.739145
21-0.080971-0.68710.752873
220.083180.70580.241294
23-0.15762-1.33750.907358
24-0.127564-1.08240.858661
25-0.073764-0.62590.733322
260.0147840.12540.450259
270.0165680.14060.444297
280.0524040.44470.32895
29-0.054779-0.46480.678266
30-0.035015-0.29710.616381
31-0.091808-0.7790.780738
320.0694710.58950.278692
330.0455550.38650.350115
34-0.017298-0.14680.558141
35-0.02231-0.18930.574809
36-0.01146-0.09720.538597
370.1717651.45750.074667
38-0.057386-0.48690.686109
39-0.053186-0.45130.673436
400.1023320.86830.194053
41-0.056856-0.48240.684521
42-0.036838-0.31260.622248
43-0.061703-0.52360.698906
44-0.000359-0.0030.501212
450.0804560.68270.248496
460.1077510.91430.181806
470.0337970.28680.387554

\begin{tabular}{lllllllll}
\hline
Partial Autocorrelation Function \tabularnewline
Time lag k & PACF(k) & T-STAT & P-value \tabularnewline
0 & -0.102261 & -0.8677 & 0.805784 \tabularnewline
1 & -0.102914 & -0.8733 & 0.807287 \tabularnewline
2 & -0.083542 & -0.7089 & 0.759655 \tabularnewline
3 & -0.106158 & -0.9008 & 0.814645 \tabularnewline
4 & -0.060251 & -0.5112 & 0.69463 \tabularnewline
5 & -0.090258 & -0.7659 & 0.77687 \tabularnewline
6 & 0.086886 & 0.7373 & 0.231681 \tabularnewline
7 & -0.191383 & -1.6239 & 0.94562 \tabularnewline
8 & 0.111969 & 0.9501 & 0.172623 \tabularnewline
9 & -0.066439 & -0.5637 & 0.712662 \tabularnewline
10 & -0.045408 & -0.3853 & 0.649424 \tabularnewline
11 & -0.148938 & -1.2638 & 0.894807 \tabularnewline
12 & -0.20195 & -1.7136 & 0.954548 \tabularnewline
13 & -0.090459 & -0.7676 & 0.777374 \tabularnewline
14 & -0.071975 & -0.6107 & 0.728349 \tabularnewline
15 & 0.120431 & 1.0219 & 0.155127 \tabularnewline
16 & -0.09194 & -0.7801 & 0.781065 \tabularnewline
17 & -0.170313 & -1.4452 & 0.923624 \tabularnewline
18 & -0.106039 & -0.8998 & 0.814379 \tabularnewline
19 & -0.002275 & -0.0193 & 0.507673 \tabularnewline
20 & -0.07588 & -0.6439 & 0.739145 \tabularnewline
21 & -0.080971 & -0.6871 & 0.752873 \tabularnewline
22 & 0.08318 & 0.7058 & 0.241294 \tabularnewline
23 & -0.15762 & -1.3375 & 0.907358 \tabularnewline
24 & -0.127564 & -1.0824 & 0.858661 \tabularnewline
25 & -0.073764 & -0.6259 & 0.733322 \tabularnewline
26 & 0.014784 & 0.1254 & 0.450259 \tabularnewline
27 & 0.016568 & 0.1406 & 0.444297 \tabularnewline
28 & 0.052404 & 0.4447 & 0.32895 \tabularnewline
29 & -0.054779 & -0.4648 & 0.678266 \tabularnewline
30 & -0.035015 & -0.2971 & 0.616381 \tabularnewline
31 & -0.091808 & -0.779 & 0.780738 \tabularnewline
32 & 0.069471 & 0.5895 & 0.278692 \tabularnewline
33 & 0.045555 & 0.3865 & 0.350115 \tabularnewline
34 & -0.017298 & -0.1468 & 0.558141 \tabularnewline
35 & -0.02231 & -0.1893 & 0.574809 \tabularnewline
36 & -0.01146 & -0.0972 & 0.538597 \tabularnewline
37 & 0.171765 & 1.4575 & 0.074667 \tabularnewline
38 & -0.057386 & -0.4869 & 0.686109 \tabularnewline
39 & -0.053186 & -0.4513 & 0.673436 \tabularnewline
40 & 0.102332 & 0.8683 & 0.194053 \tabularnewline
41 & -0.056856 & -0.4824 & 0.684521 \tabularnewline
42 & -0.036838 & -0.3126 & 0.622248 \tabularnewline
43 & -0.061703 & -0.5236 & 0.698906 \tabularnewline
44 & -0.000359 & -0.003 & 0.501212 \tabularnewline
45 & 0.080456 & 0.6827 & 0.248496 \tabularnewline
46 & 0.107751 & 0.9143 & 0.181806 \tabularnewline
47 & 0.033797 & 0.2868 & 0.387554 \tabularnewline
\hline
\end{tabular}
%Source: https://freestatistics.org/blog/index.php?pk=2191&T=2

[TABLE]
[ROW][C]Partial Autocorrelation Function[/C][/ROW]
[ROW][C]Time lag k[/C][C]PACF(k)[/C][C]T-STAT[/C][C]P-value[/C][/ROW]
[ROW][C]0[/C][C]-0.102261[/C][C]-0.8677[/C][C]0.805784[/C][/ROW]
[ROW][C]1[/C][C]-0.102914[/C][C]-0.8733[/C][C]0.807287[/C][/ROW]
[ROW][C]2[/C][C]-0.083542[/C][C]-0.7089[/C][C]0.759655[/C][/ROW]
[ROW][C]3[/C][C]-0.106158[/C][C]-0.9008[/C][C]0.814645[/C][/ROW]
[ROW][C]4[/C][C]-0.060251[/C][C]-0.5112[/C][C]0.69463[/C][/ROW]
[ROW][C]5[/C][C]-0.090258[/C][C]-0.7659[/C][C]0.77687[/C][/ROW]
[ROW][C]6[/C][C]0.086886[/C][C]0.7373[/C][C]0.231681[/C][/ROW]
[ROW][C]7[/C][C]-0.191383[/C][C]-1.6239[/C][C]0.94562[/C][/ROW]
[ROW][C]8[/C][C]0.111969[/C][C]0.9501[/C][C]0.172623[/C][/ROW]
[ROW][C]9[/C][C]-0.066439[/C][C]-0.5637[/C][C]0.712662[/C][/ROW]
[ROW][C]10[/C][C]-0.045408[/C][C]-0.3853[/C][C]0.649424[/C][/ROW]
[ROW][C]11[/C][C]-0.148938[/C][C]-1.2638[/C][C]0.894807[/C][/ROW]
[ROW][C]12[/C][C]-0.20195[/C][C]-1.7136[/C][C]0.954548[/C][/ROW]
[ROW][C]13[/C][C]-0.090459[/C][C]-0.7676[/C][C]0.777374[/C][/ROW]
[ROW][C]14[/C][C]-0.071975[/C][C]-0.6107[/C][C]0.728349[/C][/ROW]
[ROW][C]15[/C][C]0.120431[/C][C]1.0219[/C][C]0.155127[/C][/ROW]
[ROW][C]16[/C][C]-0.09194[/C][C]-0.7801[/C][C]0.781065[/C][/ROW]
[ROW][C]17[/C][C]-0.170313[/C][C]-1.4452[/C][C]0.923624[/C][/ROW]
[ROW][C]18[/C][C]-0.106039[/C][C]-0.8998[/C][C]0.814379[/C][/ROW]
[ROW][C]19[/C][C]-0.002275[/C][C]-0.0193[/C][C]0.507673[/C][/ROW]
[ROW][C]20[/C][C]-0.07588[/C][C]-0.6439[/C][C]0.739145[/C][/ROW]
[ROW][C]21[/C][C]-0.080971[/C][C]-0.6871[/C][C]0.752873[/C][/ROW]
[ROW][C]22[/C][C]0.08318[/C][C]0.7058[/C][C]0.241294[/C][/ROW]
[ROW][C]23[/C][C]-0.15762[/C][C]-1.3375[/C][C]0.907358[/C][/ROW]
[ROW][C]24[/C][C]-0.127564[/C][C]-1.0824[/C][C]0.858661[/C][/ROW]
[ROW][C]25[/C][C]-0.073764[/C][C]-0.6259[/C][C]0.733322[/C][/ROW]
[ROW][C]26[/C][C]0.014784[/C][C]0.1254[/C][C]0.450259[/C][/ROW]
[ROW][C]27[/C][C]0.016568[/C][C]0.1406[/C][C]0.444297[/C][/ROW]
[ROW][C]28[/C][C]0.052404[/C][C]0.4447[/C][C]0.32895[/C][/ROW]
[ROW][C]29[/C][C]-0.054779[/C][C]-0.4648[/C][C]0.678266[/C][/ROW]
[ROW][C]30[/C][C]-0.035015[/C][C]-0.2971[/C][C]0.616381[/C][/ROW]
[ROW][C]31[/C][C]-0.091808[/C][C]-0.779[/C][C]0.780738[/C][/ROW]
[ROW][C]32[/C][C]0.069471[/C][C]0.5895[/C][C]0.278692[/C][/ROW]
[ROW][C]33[/C][C]0.045555[/C][C]0.3865[/C][C]0.350115[/C][/ROW]
[ROW][C]34[/C][C]-0.017298[/C][C]-0.1468[/C][C]0.558141[/C][/ROW]
[ROW][C]35[/C][C]-0.02231[/C][C]-0.1893[/C][C]0.574809[/C][/ROW]
[ROW][C]36[/C][C]-0.01146[/C][C]-0.0972[/C][C]0.538597[/C][/ROW]
[ROW][C]37[/C][C]0.171765[/C][C]1.4575[/C][C]0.074667[/C][/ROW]
[ROW][C]38[/C][C]-0.057386[/C][C]-0.4869[/C][C]0.686109[/C][/ROW]
[ROW][C]39[/C][C]-0.053186[/C][C]-0.4513[/C][C]0.673436[/C][/ROW]
[ROW][C]40[/C][C]0.102332[/C][C]0.8683[/C][C]0.194053[/C][/ROW]
[ROW][C]41[/C][C]-0.056856[/C][C]-0.4824[/C][C]0.684521[/C][/ROW]
[ROW][C]42[/C][C]-0.036838[/C][C]-0.3126[/C][C]0.622248[/C][/ROW]
[ROW][C]43[/C][C]-0.061703[/C][C]-0.5236[/C][C]0.698906[/C][/ROW]
[ROW][C]44[/C][C]-0.000359[/C][C]-0.003[/C][C]0.501212[/C][/ROW]
[ROW][C]45[/C][C]0.080456[/C][C]0.6827[/C][C]0.248496[/C][/ROW]
[ROW][C]46[/C][C]0.107751[/C][C]0.9143[/C][C]0.181806[/C][/ROW]
[ROW][C]47[/C][C]0.033797[/C][C]0.2868[/C][C]0.387554[/C][/ROW]
[/TABLE]
Source: https://freestatistics.org/blog/index.php?pk=2191&T=2

Globally Unique Identifier (entire table): ba.freestatistics.org/blog/index.php?pk=2191&T=2

As an alternative you can also use a QR Code:  

The GUIDs for individual cells are displayed in the table below:

Partial Autocorrelation Function
Time lag kPACF(k)T-STATP-value
0-0.102261-0.86770.805784
1-0.102914-0.87330.807287
2-0.083542-0.70890.759655
3-0.106158-0.90080.814645
4-0.060251-0.51120.69463
5-0.090258-0.76590.77687
60.0868860.73730.231681
7-0.191383-1.62390.94562
80.1119690.95010.172623
9-0.066439-0.56370.712662
10-0.045408-0.38530.649424
11-0.148938-1.26380.894807
12-0.20195-1.71360.954548
13-0.090459-0.76760.777374
14-0.071975-0.61070.728349
150.1204311.02190.155127
16-0.09194-0.78010.781065
17-0.170313-1.44520.923624
18-0.106039-0.89980.814379
19-0.002275-0.01930.507673
20-0.07588-0.64390.739145
21-0.080971-0.68710.752873
220.083180.70580.241294
23-0.15762-1.33750.907358
24-0.127564-1.08240.858661
25-0.073764-0.62590.733322
260.0147840.12540.450259
270.0165680.14060.444297
280.0524040.44470.32895
29-0.054779-0.46480.678266
30-0.035015-0.29710.616381
31-0.091808-0.7790.780738
320.0694710.58950.278692
330.0455550.38650.350115
34-0.017298-0.14680.558141
35-0.02231-0.18930.574809
36-0.01146-0.09720.538597
370.1717651.45750.074667
38-0.057386-0.48690.686109
39-0.053186-0.45130.673436
400.1023320.86830.194053
41-0.056856-0.48240.684521
42-0.036838-0.31260.622248
43-0.061703-0.52360.698906
44-0.000359-0.0030.501212
450.0804560.68270.248496
460.1077510.91430.181806
470.0337970.28680.387554


Parameters (Session):
par1 = 48 ; par2 = 1 ; par3 = 1 ; par4 = 0 ; par5 = 12 ;
Parameters (R input):
par1 = 48 ; par2 = 1 ; par3 = 1 ; par4 = 0 ; par5 = 12 ;
R code (references can be found in the software module):
if (par1 == 'Default') {
par1 = 10*log10(length(x))
} else {
par1 <- as.numeric(par1)
}
par2 <- as.numeric(par2)
par3 <- as.numeric(par3)
par4 <- as.numeric(par4)
par5 <- as.numeric(par5)
if (par2 == 0) {
x <- log(x)
} else {
x <- (x ^ par2 - 1) / par2
}
if (par3 > 0) x <- diff(x,lag=1,difference=par3)
if (par4 > 0) x <- diff(x,lag=par5,difference=par4)
bitmap(file='pic1.png')
racf <- acf(x,par1,main='Autocorrelation',xlab='lags',ylab='ACF')
dev.off()
bitmap(file='pic2.png')
rpacf <- pacf(x,par1,main='Partial Autocorrelation',xlab='lags',ylab='PACF')
dev.off()
(myacf <- c(racf$acf))
(mypacf <- c(rpacf$acf))
lengthx <- length(x)
sqrtn <- sqrt(lengthx)
load(file='createtable')
a<-table.start()
a<-table.row.start(a)
a<-table.element(a,'Autocorrelation Function',4,TRUE)
a<-table.row.end(a)
a<-table.row.start(a)
a<-table.element(a,'Time lag k',header=TRUE)
a<-table.element(a,hyperlink('basics.htm','ACF(k)','click here for more information about the Autocorrelation Function'),header=TRUE)
a<-table.element(a,'T-STAT',header=TRUE)
a<-table.element(a,'P-value',header=TRUE)
a<-table.row.end(a)
for (i in 1:par1) {
a<-table.row.start(a)
a<-table.element(a,i-1,header=TRUE)
a<-table.element(a,round(myacf[i],6))
mytstat <- myacf[i]*sqrtn
a<-table.element(a,round(mytstat,4))
a<-table.element(a,round(1-pt(mytstat,lengthx),6))
a<-table.row.end(a)
}
a<-table.end(a)
table.save(a,file='mytable.tab')
a<-table.start()
a<-table.row.start(a)
a<-table.element(a,'Partial Autocorrelation Function',4,TRUE)
a<-table.row.end(a)
a<-table.row.start(a)
a<-table.element(a,'Time lag k',header=TRUE)
a<-table.element(a,hyperlink('basics.htm','PACF(k)','click here for more information about the Partial Autocorrelation Function'),header=TRUE)
a<-table.element(a,'T-STAT',header=TRUE)
a<-table.element(a,'P-value',header=TRUE)
a<-table.row.end(a)
for (i in 1:par1) {
a<-table.row.start(a)
a<-table.element(a,i-1,header=TRUE)
a<-table.element(a,round(mypacf[i],6))
mytstat <- mypacf[i]*sqrtn
a<-table.element(a,round(mytstat,4))
a<-table.element(a,round(1-pt(mytstat,lengthx),6))
a<-table.row.end(a)
}
a<-table.end(a)
table.save(a,file='mytable1.tab')