Free Statistics

of Irreproducible Research!

Author's title

Author*The author of this computation has been verified*
R Software Modulerwasp_exponentialsmoothing.wasp
Title produced by softwareExponential Smoothing
Date of computationFri, 21 Dec 2012 06:32:59 -0500
Cite this page as followsStatistical Computations at FreeStatistics.org, Office for Research Development and Education, URL https://freestatistics.org/blog/index.php?v=date/2012/Dec/21/t1356089586pch47igwiodkj9l.htm/, Retrieved Fri, 26 Apr 2024 23:36:50 +0000
Statistical Computations at FreeStatistics.org, Office for Research Development and Education, URL https://freestatistics.org/blog/index.php?pk=203498, Retrieved Fri, 26 Apr 2024 23:36:50 +0000
QR Codes:

Original text written by user:
IsPrivate?No (this computation is public)
User-defined keywords
Estimated Impact86
Family? (F = Feedback message, R = changed R code, M = changed R Module, P = changed Parameters, D = changed Data)
-     [Exponential Smoothing] [HPC Retail Sales] [2008-03-10 17:43:04] [74be16979710d4c4e7c6647856088456]
- RM D  [Exponential Smoothing] [...] [2012-11-24 22:27:08] [0883bf8f4217d775edf6393676d58a73]
-    D    [Exponential Smoothing] [Single] [2012-12-21 11:31:18] [0604709baf8ca89a71bc0fcadc3cdffd]
- R PD        [Exponential Smoothing] [double] [2012-12-21 11:32:59] [b650a28572edc4a1d205c228043a3295] [Current]
-   P           [Exponential Smoothing] [triple] [2012-12-21 11:34:02] [0604709baf8ca89a71bc0fcadc3cdffd]
- RMPD          [Histogram] [] [2012-12-21 13:41:38] [0604709baf8ca89a71bc0fcadc3cdffd]
Feedback Forum

Post a new message
Dataseries X:
1.4761
1.4721
1.487
1.5167
1.5812
1.554
1.5508
1.5764
1.5611
1.4735
1.4303
1.2757
1.2727
1.3917
1.2816
1.2644
1.3308
1.3275
1.4098
1.4134
1.4138
1.4272
1.4643
1.48
1.5023
1.4406
1.3966
1.357
1.3479
1.3315
1.2307
1.2271
1.3028
1.268
1.3648
1.3857
1.2998
1.3362
1.3692
1.3834
1.4207
1.486
1.4385
1.4453
1.426
1.445
1.3503
1.4001
1.3418
1.2939
1.3176
1.3443
1.3356
1.3214
1.2403
1.259
1.2284
1.2611
1.293
1.2993
1.2986


Summary of computational transaction
Raw Inputview raw input (R code)
Raw Outputview raw output of R engine
Computing time2 seconds
R Server'Gertrude Mary Cox' @ cox.wessa.net

\begin{tabular}{lllllllll}
\hline
Summary of computational transaction \tabularnewline
Raw Input & view raw input (R code)  \tabularnewline
Raw Output & view raw output of R engine  \tabularnewline
Computing time & 2 seconds \tabularnewline
R Server & 'Gertrude Mary Cox' @ cox.wessa.net \tabularnewline
\hline
\end{tabular}
%Source: https://freestatistics.org/blog/index.php?pk=203498&T=0

[TABLE]
[ROW][C]Summary of computational transaction[/C][/ROW]
[ROW][C]Raw Input[/C][C]view raw input (R code) [/C][/ROW]
[ROW][C]Raw Output[/C][C]view raw output of R engine [/C][/ROW]
[ROW][C]Computing time[/C][C]2 seconds[/C][/ROW]
[ROW][C]R Server[/C][C]'Gertrude Mary Cox' @ cox.wessa.net[/C][/ROW]
[/TABLE]
Source: https://freestatistics.org/blog/index.php?pk=203498&T=0

Globally Unique Identifier (entire table): ba.freestatistics.org/blog/index.php?pk=203498&T=0

As an alternative you can also use a QR Code:  

The GUIDs for individual cells are displayed in the table below:

Summary of computational transaction
Raw Inputview raw input (R code)
Raw Outputview raw output of R engine
Computing time2 seconds
R Server'Gertrude Mary Cox' @ cox.wessa.net


Estimated Parameters of Exponential Smoothing
ParameterValue
alpha0.929242079750219
beta0
gammaFALSE

\begin{tabular}{lllllllll}
\hline
Estimated Parameters of Exponential Smoothing \tabularnewline
Parameter & Value \tabularnewline
alpha & 0.929242079750219 \tabularnewline
beta & 0 \tabularnewline
gamma & FALSE \tabularnewline
\hline
\end{tabular}
%Source: https://freestatistics.org/blog/index.php?pk=203498&T=1

[TABLE]
[ROW][C]Estimated Parameters of Exponential Smoothing[/C][/ROW]
[ROW][C]Parameter[/C][C]Value[/C][/ROW]
[ROW][C]alpha[/C][C]0.929242079750219[/C][/ROW]
[ROW][C]beta[/C][C]0[/C][/ROW]
[ROW][C]gamma[/C][C]FALSE[/C][/ROW]
[/TABLE]
Source: https://freestatistics.org/blog/index.php?pk=203498&T=1

Globally Unique Identifier (entire table): ba.freestatistics.org/blog/index.php?pk=203498&T=1

As an alternative you can also use a QR Code:  

The GUIDs for individual cells are displayed in the table below:

Estimated Parameters of Exponential Smoothing
ParameterValue
alpha0.929242079750219
beta0
gammaFALSE


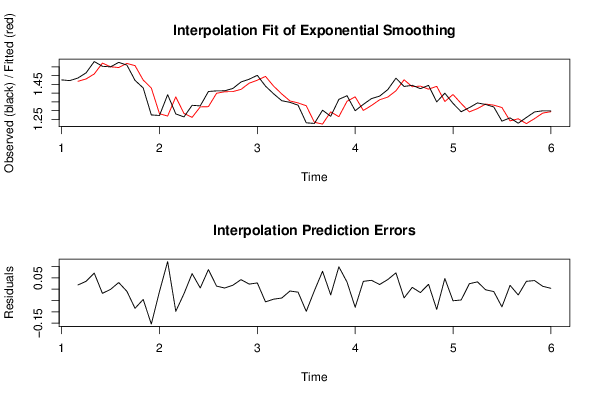
Interpolation Forecasts of Exponential Smoothing
tObservedFittedResiduals
31.4871.46810.0189000000000001
41.51671.481662675307280.0350373246927207
51.58121.510220831773630.0709791682263732
61.5541.57217766167524-0.0181776616752423
71.55081.55128621353514-0.000486213535144442
81.57641.546834403458540.0295655965414559
91.56111.57030799987778-0.00920799987778254
101.47351.55775153892101-0.0842515389210121
111.43031.47546146367189-0.0451614636718944
121.27571.42949553124486-0.153795531244859
131.27271.2825822519346-0.00988225193459669
141.39171.269399247594280.122300752405724
151.28161.37904625311479-0.0974462531147875
161.26441.28449509420654-0.0200950942065363
171.33081.261821887073280.0689781129267222
181.32751.321919252186550.0055807478134493
191.40981.323105117891280.0866948821087183
201.41341.399665650445690.013734349554313
211.41381.408428185989550.00537181401044662
221.42721.409419901612650.017780098387348
231.46431.421941917216270.0423580827837251
241.481.457302830156460.0226971698435445
251.50231.474393995466310.0279060045336852
261.44061.49632542915672-0.0557254291567153
271.39661.44054301547216-0.0439430154721558
281.3571.39570931638431-0.0387093163843137
291.34791.35573899072164-0.00783899072164473
301.33151.34445467068032-0.0129546706803212
311.23071.32841664555486-0.0977166455548604
321.22711.23361422661325-0.00651422661324674
331.30281.223560933127190.0792390668728107
341.2681.29319320842555-0.0251932084255466
351.36481.265782619032610.0990173809673891
361.38571.353793736054170.0319062639458327
371.29981.37944237912025-0.0796423791202521
381.33621.301435329110290.0347646708897063
391.36921.329740124189680.0394598758103237
401.38341.362407901254350.0209920987456531
411.42071.377914642751080.0427853572489205
421.4861.413672597103920.0723274028960774
431.43851.47688226339401-0.0383822633940056
441.44531.437215849132240.00808415086776093
451.4261.44072798229761-0.0147279822976119
461.4451.423042121396850.0219578786031456
471.35031.43944630617694-0.0891463061769442
481.40011.352607807223030.0474921927769691
491.34181.392739551211-0.0509395512109998
501.29391.34140437670215-0.0475043767021477
511.31761.293261310898210.0243386891017938
521.34431.311877844977550.0324221550224488
531.33561.3380058757406-0.00240587574059559
541.32141.33177023476378-0.010370234763784
551.24031.31813377624439-0.0778337762443873
561.2591.241807356132240.0171926438677603
571.22841.25378348427632-0.0253834842763221
581.26111.226196082556090.0349039174439145
591.2931.25463027139310.0383697286069014
601.29931.286285037803230.0130149621967728
611.29861.294379088342830.0042209116571732

\begin{tabular}{lllllllll}
\hline
Interpolation Forecasts of Exponential Smoothing \tabularnewline
t & Observed & Fitted & Residuals \tabularnewline
3 & 1.487 & 1.4681 & 0.0189000000000001 \tabularnewline
4 & 1.5167 & 1.48166267530728 & 0.0350373246927207 \tabularnewline
5 & 1.5812 & 1.51022083177363 & 0.0709791682263732 \tabularnewline
6 & 1.554 & 1.57217766167524 & -0.0181776616752423 \tabularnewline
7 & 1.5508 & 1.55128621353514 & -0.000486213535144442 \tabularnewline
8 & 1.5764 & 1.54683440345854 & 0.0295655965414559 \tabularnewline
9 & 1.5611 & 1.57030799987778 & -0.00920799987778254 \tabularnewline
10 & 1.4735 & 1.55775153892101 & -0.0842515389210121 \tabularnewline
11 & 1.4303 & 1.47546146367189 & -0.0451614636718944 \tabularnewline
12 & 1.2757 & 1.42949553124486 & -0.153795531244859 \tabularnewline
13 & 1.2727 & 1.2825822519346 & -0.00988225193459669 \tabularnewline
14 & 1.3917 & 1.26939924759428 & 0.122300752405724 \tabularnewline
15 & 1.2816 & 1.37904625311479 & -0.0974462531147875 \tabularnewline
16 & 1.2644 & 1.28449509420654 & -0.0200950942065363 \tabularnewline
17 & 1.3308 & 1.26182188707328 & 0.0689781129267222 \tabularnewline
18 & 1.3275 & 1.32191925218655 & 0.0055807478134493 \tabularnewline
19 & 1.4098 & 1.32310511789128 & 0.0866948821087183 \tabularnewline
20 & 1.4134 & 1.39966565044569 & 0.013734349554313 \tabularnewline
21 & 1.4138 & 1.40842818598955 & 0.00537181401044662 \tabularnewline
22 & 1.4272 & 1.40941990161265 & 0.017780098387348 \tabularnewline
23 & 1.4643 & 1.42194191721627 & 0.0423580827837251 \tabularnewline
24 & 1.48 & 1.45730283015646 & 0.0226971698435445 \tabularnewline
25 & 1.5023 & 1.47439399546631 & 0.0279060045336852 \tabularnewline
26 & 1.4406 & 1.49632542915672 & -0.0557254291567153 \tabularnewline
27 & 1.3966 & 1.44054301547216 & -0.0439430154721558 \tabularnewline
28 & 1.357 & 1.39570931638431 & -0.0387093163843137 \tabularnewline
29 & 1.3479 & 1.35573899072164 & -0.00783899072164473 \tabularnewline
30 & 1.3315 & 1.34445467068032 & -0.0129546706803212 \tabularnewline
31 & 1.2307 & 1.32841664555486 & -0.0977166455548604 \tabularnewline
32 & 1.2271 & 1.23361422661325 & -0.00651422661324674 \tabularnewline
33 & 1.3028 & 1.22356093312719 & 0.0792390668728107 \tabularnewline
34 & 1.268 & 1.29319320842555 & -0.0251932084255466 \tabularnewline
35 & 1.3648 & 1.26578261903261 & 0.0990173809673891 \tabularnewline
36 & 1.3857 & 1.35379373605417 & 0.0319062639458327 \tabularnewline
37 & 1.2998 & 1.37944237912025 & -0.0796423791202521 \tabularnewline
38 & 1.3362 & 1.30143532911029 & 0.0347646708897063 \tabularnewline
39 & 1.3692 & 1.32974012418968 & 0.0394598758103237 \tabularnewline
40 & 1.3834 & 1.36240790125435 & 0.0209920987456531 \tabularnewline
41 & 1.4207 & 1.37791464275108 & 0.0427853572489205 \tabularnewline
42 & 1.486 & 1.41367259710392 & 0.0723274028960774 \tabularnewline
43 & 1.4385 & 1.47688226339401 & -0.0383822633940056 \tabularnewline
44 & 1.4453 & 1.43721584913224 & 0.00808415086776093 \tabularnewline
45 & 1.426 & 1.44072798229761 & -0.0147279822976119 \tabularnewline
46 & 1.445 & 1.42304212139685 & 0.0219578786031456 \tabularnewline
47 & 1.3503 & 1.43944630617694 & -0.0891463061769442 \tabularnewline
48 & 1.4001 & 1.35260780722303 & 0.0474921927769691 \tabularnewline
49 & 1.3418 & 1.392739551211 & -0.0509395512109998 \tabularnewline
50 & 1.2939 & 1.34140437670215 & -0.0475043767021477 \tabularnewline
51 & 1.3176 & 1.29326131089821 & 0.0243386891017938 \tabularnewline
52 & 1.3443 & 1.31187784497755 & 0.0324221550224488 \tabularnewline
53 & 1.3356 & 1.3380058757406 & -0.00240587574059559 \tabularnewline
54 & 1.3214 & 1.33177023476378 & -0.010370234763784 \tabularnewline
55 & 1.2403 & 1.31813377624439 & -0.0778337762443873 \tabularnewline
56 & 1.259 & 1.24180735613224 & 0.0171926438677603 \tabularnewline
57 & 1.2284 & 1.25378348427632 & -0.0253834842763221 \tabularnewline
58 & 1.2611 & 1.22619608255609 & 0.0349039174439145 \tabularnewline
59 & 1.293 & 1.2546302713931 & 0.0383697286069014 \tabularnewline
60 & 1.2993 & 1.28628503780323 & 0.0130149621967728 \tabularnewline
61 & 1.2986 & 1.29437908834283 & 0.0042209116571732 \tabularnewline
\hline
\end{tabular}
%Source: https://freestatistics.org/blog/index.php?pk=203498&T=2

[TABLE]
[ROW][C]Interpolation Forecasts of Exponential Smoothing[/C][/ROW]
[ROW][C]t[/C][C]Observed[/C][C]Fitted[/C][C]Residuals[/C][/ROW]
[ROW][C]3[/C][C]1.487[/C][C]1.4681[/C][C]0.0189000000000001[/C][/ROW]
[ROW][C]4[/C][C]1.5167[/C][C]1.48166267530728[/C][C]0.0350373246927207[/C][/ROW]
[ROW][C]5[/C][C]1.5812[/C][C]1.51022083177363[/C][C]0.0709791682263732[/C][/ROW]
[ROW][C]6[/C][C]1.554[/C][C]1.57217766167524[/C][C]-0.0181776616752423[/C][/ROW]
[ROW][C]7[/C][C]1.5508[/C][C]1.55128621353514[/C][C]-0.000486213535144442[/C][/ROW]
[ROW][C]8[/C][C]1.5764[/C][C]1.54683440345854[/C][C]0.0295655965414559[/C][/ROW]
[ROW][C]9[/C][C]1.5611[/C][C]1.57030799987778[/C][C]-0.00920799987778254[/C][/ROW]
[ROW][C]10[/C][C]1.4735[/C][C]1.55775153892101[/C][C]-0.0842515389210121[/C][/ROW]
[ROW][C]11[/C][C]1.4303[/C][C]1.47546146367189[/C][C]-0.0451614636718944[/C][/ROW]
[ROW][C]12[/C][C]1.2757[/C][C]1.42949553124486[/C][C]-0.153795531244859[/C][/ROW]
[ROW][C]13[/C][C]1.2727[/C][C]1.2825822519346[/C][C]-0.00988225193459669[/C][/ROW]
[ROW][C]14[/C][C]1.3917[/C][C]1.26939924759428[/C][C]0.122300752405724[/C][/ROW]
[ROW][C]15[/C][C]1.2816[/C][C]1.37904625311479[/C][C]-0.0974462531147875[/C][/ROW]
[ROW][C]16[/C][C]1.2644[/C][C]1.28449509420654[/C][C]-0.0200950942065363[/C][/ROW]
[ROW][C]17[/C][C]1.3308[/C][C]1.26182188707328[/C][C]0.0689781129267222[/C][/ROW]
[ROW][C]18[/C][C]1.3275[/C][C]1.32191925218655[/C][C]0.0055807478134493[/C][/ROW]
[ROW][C]19[/C][C]1.4098[/C][C]1.32310511789128[/C][C]0.0866948821087183[/C][/ROW]
[ROW][C]20[/C][C]1.4134[/C][C]1.39966565044569[/C][C]0.013734349554313[/C][/ROW]
[ROW][C]21[/C][C]1.4138[/C][C]1.40842818598955[/C][C]0.00537181401044662[/C][/ROW]
[ROW][C]22[/C][C]1.4272[/C][C]1.40941990161265[/C][C]0.017780098387348[/C][/ROW]
[ROW][C]23[/C][C]1.4643[/C][C]1.42194191721627[/C][C]0.0423580827837251[/C][/ROW]
[ROW][C]24[/C][C]1.48[/C][C]1.45730283015646[/C][C]0.0226971698435445[/C][/ROW]
[ROW][C]25[/C][C]1.5023[/C][C]1.47439399546631[/C][C]0.0279060045336852[/C][/ROW]
[ROW][C]26[/C][C]1.4406[/C][C]1.49632542915672[/C][C]-0.0557254291567153[/C][/ROW]
[ROW][C]27[/C][C]1.3966[/C][C]1.44054301547216[/C][C]-0.0439430154721558[/C][/ROW]
[ROW][C]28[/C][C]1.357[/C][C]1.39570931638431[/C][C]-0.0387093163843137[/C][/ROW]
[ROW][C]29[/C][C]1.3479[/C][C]1.35573899072164[/C][C]-0.00783899072164473[/C][/ROW]
[ROW][C]30[/C][C]1.3315[/C][C]1.34445467068032[/C][C]-0.0129546706803212[/C][/ROW]
[ROW][C]31[/C][C]1.2307[/C][C]1.32841664555486[/C][C]-0.0977166455548604[/C][/ROW]
[ROW][C]32[/C][C]1.2271[/C][C]1.23361422661325[/C][C]-0.00651422661324674[/C][/ROW]
[ROW][C]33[/C][C]1.3028[/C][C]1.22356093312719[/C][C]0.0792390668728107[/C][/ROW]
[ROW][C]34[/C][C]1.268[/C][C]1.29319320842555[/C][C]-0.0251932084255466[/C][/ROW]
[ROW][C]35[/C][C]1.3648[/C][C]1.26578261903261[/C][C]0.0990173809673891[/C][/ROW]
[ROW][C]36[/C][C]1.3857[/C][C]1.35379373605417[/C][C]0.0319062639458327[/C][/ROW]
[ROW][C]37[/C][C]1.2998[/C][C]1.37944237912025[/C][C]-0.0796423791202521[/C][/ROW]
[ROW][C]38[/C][C]1.3362[/C][C]1.30143532911029[/C][C]0.0347646708897063[/C][/ROW]
[ROW][C]39[/C][C]1.3692[/C][C]1.32974012418968[/C][C]0.0394598758103237[/C][/ROW]
[ROW][C]40[/C][C]1.3834[/C][C]1.36240790125435[/C][C]0.0209920987456531[/C][/ROW]
[ROW][C]41[/C][C]1.4207[/C][C]1.37791464275108[/C][C]0.0427853572489205[/C][/ROW]
[ROW][C]42[/C][C]1.486[/C][C]1.41367259710392[/C][C]0.0723274028960774[/C][/ROW]
[ROW][C]43[/C][C]1.4385[/C][C]1.47688226339401[/C][C]-0.0383822633940056[/C][/ROW]
[ROW][C]44[/C][C]1.4453[/C][C]1.43721584913224[/C][C]0.00808415086776093[/C][/ROW]
[ROW][C]45[/C][C]1.426[/C][C]1.44072798229761[/C][C]-0.0147279822976119[/C][/ROW]
[ROW][C]46[/C][C]1.445[/C][C]1.42304212139685[/C][C]0.0219578786031456[/C][/ROW]
[ROW][C]47[/C][C]1.3503[/C][C]1.43944630617694[/C][C]-0.0891463061769442[/C][/ROW]
[ROW][C]48[/C][C]1.4001[/C][C]1.35260780722303[/C][C]0.0474921927769691[/C][/ROW]
[ROW][C]49[/C][C]1.3418[/C][C]1.392739551211[/C][C]-0.0509395512109998[/C][/ROW]
[ROW][C]50[/C][C]1.2939[/C][C]1.34140437670215[/C][C]-0.0475043767021477[/C][/ROW]
[ROW][C]51[/C][C]1.3176[/C][C]1.29326131089821[/C][C]0.0243386891017938[/C][/ROW]
[ROW][C]52[/C][C]1.3443[/C][C]1.31187784497755[/C][C]0.0324221550224488[/C][/ROW]
[ROW][C]53[/C][C]1.3356[/C][C]1.3380058757406[/C][C]-0.00240587574059559[/C][/ROW]
[ROW][C]54[/C][C]1.3214[/C][C]1.33177023476378[/C][C]-0.010370234763784[/C][/ROW]
[ROW][C]55[/C][C]1.2403[/C][C]1.31813377624439[/C][C]-0.0778337762443873[/C][/ROW]
[ROW][C]56[/C][C]1.259[/C][C]1.24180735613224[/C][C]0.0171926438677603[/C][/ROW]
[ROW][C]57[/C][C]1.2284[/C][C]1.25378348427632[/C][C]-0.0253834842763221[/C][/ROW]
[ROW][C]58[/C][C]1.2611[/C][C]1.22619608255609[/C][C]0.0349039174439145[/C][/ROW]
[ROW][C]59[/C][C]1.293[/C][C]1.2546302713931[/C][C]0.0383697286069014[/C][/ROW]
[ROW][C]60[/C][C]1.2993[/C][C]1.28628503780323[/C][C]0.0130149621967728[/C][/ROW]
[ROW][C]61[/C][C]1.2986[/C][C]1.29437908834283[/C][C]0.0042209116571732[/C][/ROW]
[/TABLE]
Source: https://freestatistics.org/blog/index.php?pk=203498&T=2

Globally Unique Identifier (entire table): ba.freestatistics.org/blog/index.php?pk=203498&T=2

As an alternative you can also use a QR Code:  

The GUIDs for individual cells are displayed in the table below:

Interpolation Forecasts of Exponential Smoothing
tObservedFittedResiduals
31.4871.46810.0189000000000001
41.51671.481662675307280.0350373246927207
51.58121.510220831773630.0709791682263732
61.5541.57217766167524-0.0181776616752423
71.55081.55128621353514-0.000486213535144442
81.57641.546834403458540.0295655965414559
91.56111.57030799987778-0.00920799987778254
101.47351.55775153892101-0.0842515389210121
111.43031.47546146367189-0.0451614636718944
121.27571.42949553124486-0.153795531244859
131.27271.2825822519346-0.00988225193459669
141.39171.269399247594280.122300752405724
151.28161.37904625311479-0.0974462531147875
161.26441.28449509420654-0.0200950942065363
171.33081.261821887073280.0689781129267222
181.32751.321919252186550.0055807478134493
191.40981.323105117891280.0866948821087183
201.41341.399665650445690.013734349554313
211.41381.408428185989550.00537181401044662
221.42721.409419901612650.017780098387348
231.46431.421941917216270.0423580827837251
241.481.457302830156460.0226971698435445
251.50231.474393995466310.0279060045336852
261.44061.49632542915672-0.0557254291567153
271.39661.44054301547216-0.0439430154721558
281.3571.39570931638431-0.0387093163843137
291.34791.35573899072164-0.00783899072164473
301.33151.34445467068032-0.0129546706803212
311.23071.32841664555486-0.0977166455548604
321.22711.23361422661325-0.00651422661324674
331.30281.223560933127190.0792390668728107
341.2681.29319320842555-0.0251932084255466
351.36481.265782619032610.0990173809673891
361.38571.353793736054170.0319062639458327
371.29981.37944237912025-0.0796423791202521
381.33621.301435329110290.0347646708897063
391.36921.329740124189680.0394598758103237
401.38341.362407901254350.0209920987456531
411.42071.377914642751080.0427853572489205
421.4861.413672597103920.0723274028960774
431.43851.47688226339401-0.0383822633940056
441.44531.437215849132240.00808415086776093
451.4261.44072798229761-0.0147279822976119
461.4451.423042121396850.0219578786031456
471.35031.43944630617694-0.0891463061769442
481.40011.352607807223030.0474921927769691
491.34181.392739551211-0.0509395512109998
501.29391.34140437670215-0.0475043767021477
511.31761.293261310898210.0243386891017938
521.34431.311877844977550.0324221550224488
531.33561.3380058757406-0.00240587574059559
541.32141.33177023476378-0.010370234763784
551.24031.31813377624439-0.0778337762443873
561.2591.241807356132240.0171926438677603
571.22841.25378348427632-0.0253834842763221
581.26111.226196082556090.0349039174439145
591.2931.25463027139310.0383697286069014
601.29931.286285037803230.0130149621967728
611.29861.294379088342830.0042209116571732


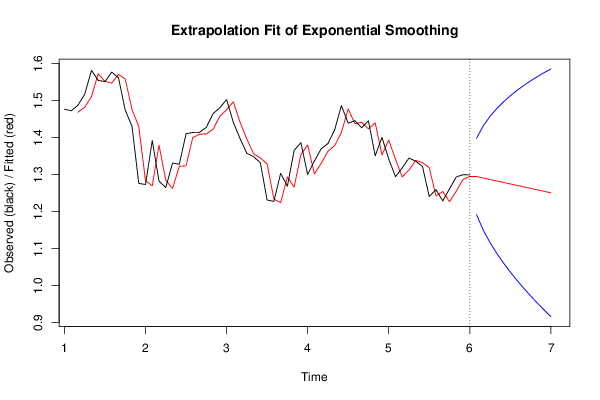
Extrapolation Forecasts of Exponential Smoothing
tForecast95% Lower Bound95% Upper Bound
621.294301337069581.190994386683861.3976082874553
631.290301337069581.149277290295931.43132538384323
641.286301337069581.11570462684681.45689804729236
651.282301337069581.086549725813751.47805294832541
661.278301337069581.060278060606561.4963246135326
671.274301337069581.036079581450811.51252309268835
681.270301337069581.01346469517341.52713797896576
691.266301337069580.9921106800607621.5404919940784
701.262301337069580.9717914884218181.55281118571734
711.258301337069580.9523414901423011.56426118399686
721.254301337069580.9336350249908361.57496764914832
731.250301337069580.9155740757468711.58502859839229

\begin{tabular}{lllllllll}
\hline
Extrapolation Forecasts of Exponential Smoothing \tabularnewline
t & Forecast & 95% Lower Bound & 95% Upper Bound \tabularnewline
62 & 1.29430133706958 & 1.19099438668386 & 1.3976082874553 \tabularnewline
63 & 1.29030133706958 & 1.14927729029593 & 1.43132538384323 \tabularnewline
64 & 1.28630133706958 & 1.1157046268468 & 1.45689804729236 \tabularnewline
65 & 1.28230133706958 & 1.08654972581375 & 1.47805294832541 \tabularnewline
66 & 1.27830133706958 & 1.06027806060656 & 1.4963246135326 \tabularnewline
67 & 1.27430133706958 & 1.03607958145081 & 1.51252309268835 \tabularnewline
68 & 1.27030133706958 & 1.0134646951734 & 1.52713797896576 \tabularnewline
69 & 1.26630133706958 & 0.992110680060762 & 1.5404919940784 \tabularnewline
70 & 1.26230133706958 & 0.971791488421818 & 1.55281118571734 \tabularnewline
71 & 1.25830133706958 & 0.952341490142301 & 1.56426118399686 \tabularnewline
72 & 1.25430133706958 & 0.933635024990836 & 1.57496764914832 \tabularnewline
73 & 1.25030133706958 & 0.915574075746871 & 1.58502859839229 \tabularnewline
\hline
\end{tabular}
%Source: https://freestatistics.org/blog/index.php?pk=203498&T=3

[TABLE]
[ROW][C]Extrapolation Forecasts of Exponential Smoothing[/C][/ROW]
[ROW][C]t[/C][C]Forecast[/C][C]95% Lower Bound[/C][C]95% Upper Bound[/C][/ROW]
[ROW][C]62[/C][C]1.29430133706958[/C][C]1.19099438668386[/C][C]1.3976082874553[/C][/ROW]
[ROW][C]63[/C][C]1.29030133706958[/C][C]1.14927729029593[/C][C]1.43132538384323[/C][/ROW]
[ROW][C]64[/C][C]1.28630133706958[/C][C]1.1157046268468[/C][C]1.45689804729236[/C][/ROW]
[ROW][C]65[/C][C]1.28230133706958[/C][C]1.08654972581375[/C][C]1.47805294832541[/C][/ROW]
[ROW][C]66[/C][C]1.27830133706958[/C][C]1.06027806060656[/C][C]1.4963246135326[/C][/ROW]
[ROW][C]67[/C][C]1.27430133706958[/C][C]1.03607958145081[/C][C]1.51252309268835[/C][/ROW]
[ROW][C]68[/C][C]1.27030133706958[/C][C]1.0134646951734[/C][C]1.52713797896576[/C][/ROW]
[ROW][C]69[/C][C]1.26630133706958[/C][C]0.992110680060762[/C][C]1.5404919940784[/C][/ROW]
[ROW][C]70[/C][C]1.26230133706958[/C][C]0.971791488421818[/C][C]1.55281118571734[/C][/ROW]
[ROW][C]71[/C][C]1.25830133706958[/C][C]0.952341490142301[/C][C]1.56426118399686[/C][/ROW]
[ROW][C]72[/C][C]1.25430133706958[/C][C]0.933635024990836[/C][C]1.57496764914832[/C][/ROW]
[ROW][C]73[/C][C]1.25030133706958[/C][C]0.915574075746871[/C][C]1.58502859839229[/C][/ROW]
[/TABLE]
Source: https://freestatistics.org/blog/index.php?pk=203498&T=3

Globally Unique Identifier (entire table): ba.freestatistics.org/blog/index.php?pk=203498&T=3

As an alternative you can also use a QR Code:  

The GUIDs for individual cells are displayed in the table below:

Extrapolation Forecasts of Exponential Smoothing
tForecast95% Lower Bound95% Upper Bound
621.294301337069581.190994386683861.3976082874553
631.290301337069581.149277290295931.43132538384323
641.286301337069581.11570462684681.45689804729236
651.282301337069581.086549725813751.47805294832541
661.278301337069581.060278060606561.4963246135326
671.274301337069581.036079581450811.51252309268835
681.270301337069581.01346469517341.52713797896576
691.266301337069580.9921106800607621.5404919940784
701.262301337069580.9717914884218181.55281118571734
711.258301337069580.9523414901423011.56426118399686
721.254301337069580.9336350249908361.57496764914832
731.250301337069580.9155740757468711.58502859839229


Parameters (Session):
par1 = 12 ; par2 = Double ; par3 = additive ;
Parameters (R input):
par1 = 12 ; par2 = Double ; par3 = additive ;
R code (references can be found in the software module):
par1 <- as.numeric(par1)
if (par2 == 'Single') K <- 1
if (par2 == 'Double') K <- 2
if (par2 == 'Triple') K <- par1
nx <- length(x)
nxmK <- nx - K
x <- ts(x, frequency = par1)
if (par2 == 'Single') fit <- HoltWinters(x, gamma=F, beta=F)
if (par2 == 'Double') fit <- HoltWinters(x, gamma=F)
if (par2 == 'Triple') fit <- HoltWinters(x, seasonal=par3)
fit
myresid <- x - fit$fitted[,'xhat']
bitmap(file='test1.png')
op <- par(mfrow=c(2,1))
plot(fit,ylab='Observed (black) / Fitted (red)',main='Interpolation Fit of Exponential Smoothing')
plot(myresid,ylab='Residuals',main='Interpolation Prediction Errors')
par(op)
dev.off()
bitmap(file='test2.png')
p <- predict(fit, par1, prediction.interval=TRUE)
np <- length(p[,1])
plot(fit,p,ylab='Observed (black) / Fitted (red)',main='Extrapolation Fit of Exponential Smoothing')
dev.off()
bitmap(file='test3.png')
op <- par(mfrow = c(2,2))
acf(as.numeric(myresid),lag.max = nx/2,main='Residual ACF')
spectrum(myresid,main='Residals Periodogram')
cpgram(myresid,main='Residal Cumulative Periodogram')
qqnorm(myresid,main='Residual Normal QQ Plot')
qqline(myresid)
par(op)
dev.off()
load(file='createtable')
a<-table.start()
a<-table.row.start(a)
a<-table.element(a,'Estimated Parameters of Exponential Smoothing',2,TRUE)
a<-table.row.end(a)
a<-table.row.start(a)
a<-table.element(a,'Parameter',header=TRUE)
a<-table.element(a,'Value',header=TRUE)
a<-table.row.end(a)
a<-table.row.start(a)
a<-table.element(a,'alpha',header=TRUE)
a<-table.element(a,fit$alpha)
a<-table.row.end(a)
a<-table.row.start(a)
a<-table.element(a,'beta',header=TRUE)
a<-table.element(a,fit$beta)
a<-table.row.end(a)
a<-table.row.start(a)
a<-table.element(a,'gamma',header=TRUE)
a<-table.element(a,fit$gamma)
a<-table.row.end(a)
a<-table.end(a)
table.save(a,file='mytable.tab')
a<-table.start()
a<-table.row.start(a)
a<-table.element(a,'Interpolation Forecasts of Exponential Smoothing',4,TRUE)
a<-table.row.end(a)
a<-table.row.start(a)
a<-table.element(a,'t',header=TRUE)
a<-table.element(a,'Observed',header=TRUE)
a<-table.element(a,'Fitted',header=TRUE)
a<-table.element(a,'Residuals',header=TRUE)
a<-table.row.end(a)
for (i in 1:nxmK) {
a<-table.row.start(a)
a<-table.element(a,i+K,header=TRUE)
a<-table.element(a,x[i+K])
a<-table.element(a,fit$fitted[i,'xhat'])
a<-table.element(a,myresid[i])
a<-table.row.end(a)
}
a<-table.end(a)
table.save(a,file='mytable1.tab')
a<-table.start()
a<-table.row.start(a)
a<-table.element(a,'Extrapolation Forecasts of Exponential Smoothing',4,TRUE)
a<-table.row.end(a)
a<-table.row.start(a)
a<-table.element(a,'t',header=TRUE)
a<-table.element(a,'Forecast',header=TRUE)
a<-table.element(a,'95% Lower Bound',header=TRUE)
a<-table.element(a,'95% Upper Bound',header=TRUE)
a<-table.row.end(a)
for (i in 1:np) {
a<-table.row.start(a)
a<-table.element(a,nx+i,header=TRUE)
a<-table.element(a,p[i,'fit'])
a<-table.element(a,p[i,'lwr'])
a<-table.element(a,p[i,'upr'])
a<-table.row.end(a)
}
a<-table.end(a)
table.save(a,file='mytable2.tab')